
Customer churn costs U.S. businesses $168 billion annually. For B2B support teams, the challenge is identifying at-risk accounts before they leave. A simple way to do this? Build a customer health score using only support data – no need for complex integrations across departments.
Here’s how:
- Focus on key support metrics: Use ticket volume, resolution times, sentiment trends, and escalation patterns.
- Skip the bottlenecks: Relying solely on support data avoids delays and keeps implementation simple.
- Act early: Support interactions often signal churn 60–90 days in advance.
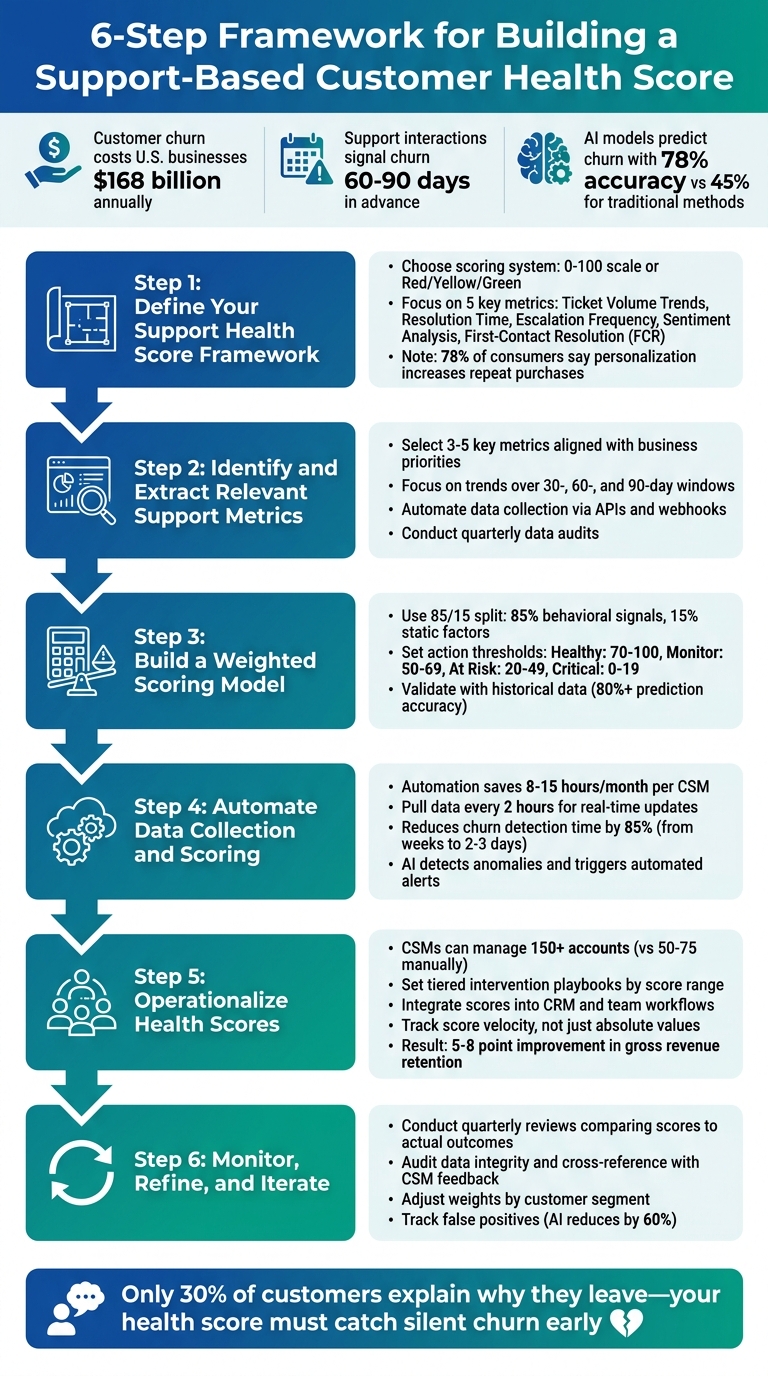
6-Step Framework for Building a Support-Based Customer Health Score
How To Spot Unhappy Customers Early
sbb-itb-e60d259
Step 1: Define Your Support Health Score Framework
Start by pinpointing exactly what you want to measure and why. A support-based health score helps you assess the quality of your customer relationships and predict churn or growth opportunities [2]. To make this effective, clarity is key – your team needs actionable insights, not confusion.
The first step is deciding on a scoring system that’s easy to understand. Many teams opt for either a 0–100 scale or a simple color-coded system (Red/Yellow/Green).
"The best metrics are clarity metrics, not vanity metrics."
Next, tie the framework directly to your business priorities. For example, if reducing churn is your focus, emphasize metrics like escalation frequency or trends in negative sentiment, as these often signal cancellations [2][12]. On the other hand, if you’re looking to identify potential for growth, prioritize indicators like high engagement or quick resolution times, which suggest a strong, positive relationship.
Remember, customer needs change over time. Signals that show engagement during onboarding might signal friction during renewal [11]. Tailor your metrics to fit these lifecycle stages, and focus on the ones that provide the most actionable insights.
Key Metrics for Support-Only Health Scoring
The effectiveness of your health score depends on the data you track. These metrics provide insight into customer friction, satisfaction, and risks:
- Ticket Volume Trends: A sudden spike in tickets often points to product issues or technical problems, while a sharp drop from an active account could mean disengagement [2].
- Resolution Time: Slow responses frustrate customers and increase churn risk [1].
- Escalation Frequency: Frequent escalations signal unresolved issues and at-risk customers [5].
- Sentiment Analysis: AI tools can assess customer sentiment in support interactions, offering early warnings of dissatisfaction [2][5].
- First-Contact Resolution (FCR): High FCR rates indicate a seamless customer experience, which boosts loyalty [10]. Notably, 78% of consumers say personalization increases their likelihood of repeat purchases [1].
| Support Metric | What It Reflects | Churn/Growth Signal |
|---|---|---|
| Ticket Volume Trends | Friction or engagement levels | Spikes suggest friction; drops may signal disengagement [2] |
| Resolution Time | Service efficiency and customer effort | Long times indicate friction and declining satisfaction [1] |
| Escalation Frequency | Severity of unresolved challenges | High frequency is a sign of at-risk customers [5] |
| Sentiment Analysis | Emotional tone of customer interactions | Negative sentiment predicts churn [2][5] |
| First-Contact Resolution | Ease and effectiveness of support | High rates link to satisfaction and loyalty [10] |
How Support Metrics Reflect Customer Health
Each of these metrics paints a clear picture of how customers perceive your support. For instance, if a customer who usually submits two tickets a month suddenly submits ten, they’re likely facing a major issue. On the flip side, if a typically active customer stops submitting tickets altogether, it might mean they’ve disengaged [2].
Resolution time is another critical indicator. When problems take too long to fix, customers may start questioning whether your product is worth the hassle.
Frequent escalations suggest your support team isn’t meeting customer expectations, which can erode trust [5].
And here’s a concerning trend: only 3 out of 10 customers explain why they leave a brand, while 30% simply walk away without saying a word [10]. This makes sentiment analysis – tracking negative language in support communications – a vital early warning system.
Lastly, first-contact resolution is a strong measure of your team’s efficiency. High FCR rates not only improve satisfaction but also build loyalty. With 78% of consumers saying personalization makes them more likely to repurchase [1], delivering fast, effective support is more important than ever.
Step 2: Identify and Extract Relevant Support Metrics
Once you’ve defined your framework, it’s time to focus on the data that truly matters. The goal here is to extract metrics that can reliably predict churn or growth, ensuring your analysis drives actionable insights.
Selecting the Right Metrics for Your Model
Start by revisiting the metrics outlined in Step 1 and confirm that your support platform consistently tracks them. Different systems capture data in varying ways, so it’s essential to choose metrics that are both reliable and aligned with your business priorities. Aim to focus on three to five key metrics – tracking too many can dilute your efforts. For instance, if reducing churn is your primary objective, prioritize metrics like ticket escalations, resolution time, and sentiment analysis. Metrics such as knowledge base views, while useful, may not directly impact churn.
"Only track data points that directly inform action."
- Jared Cook, Founder, Crush Churn Consulting [8]
Start with the most dependable data source and expand as needed. If your CRM, support platform, and billing system each provide different versions of "customer health", rely on the one that has historically been the best predictor of churn.
It’s also critical to focus on trends rather than isolated data points. For example, a customer submitting 50 tickets this month might seem concerning at first glance. However, if they submitted 200 tickets the previous month, the trend indicates improvement. Use 30-, 60-, and 90-day windows to monitor changes over time and gain a clearer picture of customer health.
Once you’ve identified your top metrics, address any inconsistencies in the data to ensure the health score remains accurate and meaningful.
Overcoming Data Quality Challenges
Even the most insightful metrics lose their value if the data behind them is incomplete or inconsistent. Common issues include missing fields, inconsistent tagging by support agents, or timestamp errors that skew resolution time calculations.
To tackle these challenges, the first step is to automate data collection wherever possible. Manual data entry is prone to errors, so leverage APIs, native integrations, or webhooks to pull real-time data directly from your systems. For example, subscribing to webhook events for ticket updates ensures health scores are updated immediately when ticket statuses change, rather than relying on periodic batch processes.
Regular audits are another critical step. Schedule quarterly reviews to detect anomalies early. A sudden drop in ticket volume might signal disengagement – or simply a tracking failure due to a broken integration. Validate these trends by cross-referencing support data with other sources like customer feedback or product usage data. For instance, if your support platform shows low engagement but a recent survey indicates high satisfaction, dig deeper to uncover the root cause of the discrepancy.
Lastly, use historical data to refine your model by comparing health scores with actual outcomes, such as renewals and cancellations. If accounts labeled as "unhealthy" are not churning, it might be time to adjust your metrics or their weighting. Interestingly, AI-driven health score models have demonstrated a 78% accuracy rate for predicting churn 60 days in advance, compared to just 45% for traditional weighted scoring [9]. However, this level of precision is only possible when the underlying data is clean and relevant.
Step 3: Build a Weighted Scoring Model
Now that you’ve honed your metrics and cleaned your data in Step 2, it’s time to combine everything into a single, actionable score. A well-designed scoring model converts raw support metrics into clear signals, enabling your team to act quickly on accounts that might be at risk. This process involves assigning weights to metrics based on their predictive strength, setting thresholds for action, and validating the model with real-world outcomes.
Creating a Simple Weighting System
Start by assigning weights to each metric based on its historical connection to churn. For example, if escalations are a stronger predictor of cancellations than slow resolution times, give escalations a higher weight [13][3].
Behavioral signals often carry more weight than static data when predicting churn. A common approach is to use an 85/15 split: 85% of the score comes from behavioral trends (like ticket sentiment, resolution time patterns, or escalation frequency), while 15% is based on static factors like account age or contract value [13]. Within the behavioral category, you might allocate weights like this: 40% to ticket sentiment, 30% to resolution time, and 30% to escalation count. Ensure all weights add up to 1.0 to maintain a consistent 0–100 scale [13].
Normalize each metric to a 0–100 scale. For instance, if the average resolution time is two hours, an account resolved in one hour might score around 90, while one taking four hours could score closer to 40. This ensures that metrics with higher volumes don’t overshadow those with greater impact. Metrics like "days since last support interaction" can use exponential decay, where scores drop sharply after a set period (e.g., seven days without contact) [13].
To highlight urgent risks, consider adding penalty rules. For example, deduct 15 points if sentiment is negative across three consecutive tickets. This helps capture critical issues that might be hidden by generally positive trends [3].
Setting Score Thresholds for Actionable Insights
Once your composite score is ready, map it to specific action tiers. Many teams use a 0–100 scale divided into Red, Amber, Green (RAG) categories to streamline prioritization [15][1]. Here’s an example breakdown:
| Tier | Score Range | Recommended Action |
|---|---|---|
| Healthy | 70–100 | Provide light engagement like tips, beta feature invites, or gentle nudges. |
| Monitor | 50–69 | Conduct personalized outreach and investigate declining signals. |
| At Risk | 20–49 | Use direct human outreach (phone or video) and provide detailed risk summaries. |
| Critical | 0–19 | Offer win-back incentives or address the situation directly with the customer. |
Set a threshold of 40 for critical cases, where immediate human intervention is required [13]. Keep in mind that what qualifies as "healthy" behavior may vary by lifecycle stage. For example, an onboarding customer might score well by simply logging in regularly, while a mature account would need to show clear ROI to achieve the same score [14][15][1].
If a metric like NPS is missing for an account, assign it a neutral default (e.g., 7 out of 10) instead of zero to avoid unfair penalties [6]. Reevaluate these thresholds every quarter to ensure they align with current churn and renewal patterns [15][6].
Validating Your Model with Real-World Data
To confirm your model’s effectiveness, test it against historical data. Look at accounts that churned over the past six to twelve months and calculate what their health scores would have been 60 to 90 days before cancellation. If the model consistently identifies these accounts as "at risk", it’s working well. If not, adjust the weights and thresholds as needed [13][3].
Track three key metrics during validation:
- Prediction accuracy: Aim for an 80%+ correlation between low scores and actual churn.
- Early warning capability: The model should provide a lead time of 3–6 months before churn.
- Intervention success rate: Check if actions triggered by score drops improve retention [16].
AI-enhanced scoring models can predict churn 3–6 months in advance with over 85% accuracy when built on clean data and validated weights [16]. Watch for false positives (flagging healthy accounts as at risk) and false negatives (missing accounts that still churn). Discrepancies often point to missing metrics or conflicting data sources. For instance, if your support system shows low ticket volume but product analytics reveal no logins, the model might overlook a key engagement signal. Cross-referencing data sources can help address these gaps [5].
AI-powered health scoring can cut false positives by 60%, but regular validation and refinement are crucial [3]. Set a quarterly review schedule to compare predicted outcomes with actual results and adjust the model as your business evolves.
With a validated scoring model in place, the next step focuses on automating data collection to streamline the process.
Step 4: Automate Data Collection and Scoring
Manually calculating health scores can take a hefty 8–15 hours each month for every Customer Success Manager (CSM) [18]. Once your scoring model is ready, automation changes the game. Instead of treating health scoring as a periodic task, automation turns it into a continuous process that adapts as customer behavior shifts. This approach lays the groundwork for real-time insights in later stages.
Leveraging Platform and API Integrations
Streamlining your health scoring model starts with tapping into platform and API integrations. By linking your support platform’s API, you can automatically pull essential metrics like ticket volume, resolution times, escalation counts, and customer interaction histories. Most support systems provide these endpoints, making it easier to integrate data flows. To avoid fragmented data, map customer identifiers across platforms [18].
Automation tools can further simplify the process by running parallel API calls across support, CRM, and billing systems. For instance, you can schedule jobs to pull ticket data every two hours, cross-reference it, and update health scores. This continuous refresh cycle means your scores stay up-to-date. In fact, automating churn detection can make the process roughly 85% faster, cutting lead times down from weeks to just 2–3 days [3].
Start with fundamental signals like ticket volume, resolution times, and escalation counts. Once the system is running smoothly, you can add more metrics to refine the model. Be sure to configure the system to normalize data automatically so all metrics contribute equally to the overall score [18].
AI-Driven Automation for Efficiency
Automation doesn’t stop at data collection – it gets even smarter with AI. Tools like natural language processing can analyze ticket sentiment, picking up on frustration or sudden spikes in escalations that suggest churn risk [9][18].
AI-powered anomaly detection can also spot unusual behavior that might not meet traditional thresholds but still signals potential issues. For example, if a customer’s ticket volume increases by 40% in one week or their main point of contact changes roles, the system can alert the assigned CSM immediately instead of waiting for the next scoring update [18]. AI models can predict churn with 78% accuracy up to 60 days in advance, compared to the 45% accuracy of traditional scoring methods [9].
To take things further, you can set up automated intervention playbooks. For example, if a customer’s score drops below a certain threshold, the system could automatically draft a personalized email for the CSM, create a high-priority task in the CRM, and notify the team lead via Slack. This reduces unnecessary alerts and ensures that your team focuses on the most critical issues [18].
Step 5: Operationalize Health Scores for Business Impact
Turn health scores into actionable strategies to prevent churn. When integrated into daily operations, these scores help teams move from reacting to problems to proactively managing accounts.
"Health scores change how customer success works. Instead of reacting to problems, you catch them early."
Using Scores to Identify and Address At-Risk Accounts
Pay attention to trends in health scores, not just individual numbers. For example, a drop from 75 to 60 over two weeks is a red flag, even if the account is still technically "healthy." AI tools can predict churn with 78% accuracy up to 60 days in advance, compared to 45% accuracy using traditional scoring methods [9].
When a score drops, understanding the why is just as important as the number itself. AI-driven models provide context, such as: "Health declining due to 40% drop in feature adoption over 30 days combined with three escalated tickets" [9]. This level of detail informs the next steps – like scheduling targeted training or reaching out to an executive sponsor.
Set up tiered intervention playbooks to trigger specific responses based on score ranges:
| Health Score | Tier | Action/Workflow |
|---|---|---|
| 70–85 | Yellow (Watch) | Log change in CRM, add to CSM’s weekly priority list, and send a personalized check-in email [3]. |
| 50–70 | Orange (Intervene) | Send immediate Slack alert, auto-draft a targeted outreach message, and schedule a "value review" [3]. |
| Below 50 | Red (Escalate) | Notify CSM, Manager, and VP, create an executive summary of risks, and initiate executive-level outreach [3]. |
Focus on accounts with significant health score changes or those dropping below key thresholds. By automating data collection and analysis, customer success managers (CSMs) can handle portfolios of 150+ accounts, compared to 50–75 accounts using manual methods [5].
Integrating Scores into Team Workflows
Health scores are most effective when seamlessly integrated into the tools your team already uses. Real-time alerts based on score changes ensure immediate action rather than delayed responses.
For example, set up automated Slack or Microsoft Teams notifications when an account drops from Green to Yellow. Embed health scores directly into your support CRM as custom fields so they appear in daily workflows. Use these insights to prioritize "Red Accounts" by contract value, ensuring high-revenue risks are addressed first [6].
Automation can also streamline task creation. If a score falls below 50, your CRM can generate a task with a 48-hour deadline, assign it to the CSM, and include details about the metrics causing the drop [6]. Tools like Supportbench can handle these workflows without IT involvement, linking health scores to escalation management and case prioritization.
Track score velocity – the rate of change – alongside absolute values. For instance, an account dropping from 80 to 65 in one week needs immediate attention, even if 65 isn’t technically in the "at-risk" range yet. This approach flags deteriorating accounts before they hit crisis levels [3][6].
Tracking the Impact of Actions Driven by Health Scores
To measure the effectiveness of your health score interventions, start with cohort comparisons. Compare outcomes for at-risk customers who received early intervention against those addressed later. This helps pinpoint the best timing for action [19].
Monitor your model’s accuracy by tracking false positives (healthy accounts flagged as at-risk) and false negatives (at-risk accounts that weren’t flagged). AI-driven systems reduce false positives by 60% compared to manual methods [3]. If unexpected trends emerge – like "Yellow" accounts with high churn rates – adjust your thresholds.
Refine your model by recording health scores, reasons for cancellations, and intervention details at the time of churn. Compare these findings to successful renewals to ensure your thresholds remain effective [2][19].
Conduct quarterly reviews to evaluate your system. Look at churned accounts to see if their health scores accurately reflected risk 90 days before their exit. One global software company improved health scores by 15 points and boosted overall business value scores by 25 points through consistent investment in health scoring [1]. Teams using AI-powered insights often see a 5–8 point improvement in gross revenue retention [3].
"A customer health score is only as good as the sum of its parts. Measuring the effectiveness of your customer health scores is essential to maintain their accuracy."
Finally, track the operational efficiency gains. Effective health scoring identifies risks weeks earlier than manual methods. AI systems can shorten churn detection lead times by 85%, reducing the window from 2–4 weeks to just 2–3 days [3]. For a $2M ARR base, even a 5-point retention improvement equates to approximately $100,000 in saved revenue [3].
Step 6: Monitor, Refine, and Iterate
Once you’ve set up automated data collection and actionable scoring models, the next step is keeping them dynamic. Your customer health score isn’t a "set it and forget it" tool – it’s a system that needs regular updates. As customer behaviors shift and your product evolves, the factors that once predicted success may no longer apply. Think of your scoring model as a dashboard that requires quarterly updates, not just an annual review [20].
Establishing Feedback Loops
It’s essential to regularly compare your health scores with real customer outcomes. For example, if customers marked as "healthy" are unexpectedly churning, it’s time to reassess your thresholds [2][10].
Regular check-ins with your Customer Success Managers (CSMs) are equally important. If they’re disregarding the scores or calling them unreliable, that’s a red flag. One way to address this is by investigating divergence cases – instances where data-driven scores conflict with frontline assessments. For instance, if a customer shows high product usage but a CSM flags them as at-risk, dig deeper. These mismatches often highlight blind spots in your metrics [4].
Another critical step is auditing your data integrity on a quarterly basis. A sudden drop in usage, for instance, might not reflect customer behavior but could point to a broken API or tracking issue [8]. Cross-referencing sentiment data from support tickets with usage trends can also provide valuable insights. If Net Promoter Scores (NPS) are high but engagement is declining, it could signal the onset of "silent churn" [10].
"Customer health scoring is an iterative task by nature, so no matter how accurate a job you do for the first version, there will always be improvements, since your tool and your customers improve over time as well."
- Josh Levin, Manager, Customer Success, Honeycomb.io [21]
By establishing these feedback loops, you can fine-tune your scoring model and avoid common pitfalls.
Avoiding Common Pitfalls
One frequent mistake is relying on static weighting. Metrics that are critical for enterprise clients, such as executive engagement, might not matter for small businesses. Tailor your scoring by customer segment or use case, adjusting the weights to reflect what truly drives retention for each group [21].
Another trap is measure sprawl – tracking too many metrics can dilute the signals that matter most. If more than 25% of your metrics require manual updates, your system likely won’t scale effectively [21]. Instead, focus on a small set of metrics that have consistently proven to predict outcomes.
It’s also important to monitor trends, not just absolute values. For example, a customer with moderate support activity might seem fine on paper, but if their support tickets have doubled in the past month, it could indicate they’re struggling [9]. Pay attention to score trajectories to catch potential issues early.
Lastly, avoid over-relying on lagging indicators. If your scores only drop after a customer cancels, it’s too late. Use AI-powered models to predict churn earlier – these models can identify risks with 78% accuracy up to 60 days in advance, compared to 45% accuracy from traditional scoring methods [9]. Incorporating early signals like support sentiment or feature adoption can help you intervene before it’s too late.
Conclusion
This guide has shown that building a lightweight customer health score using support-only inputs doesn’t have to be a complex or costly endeavor. The most effective models rely on 4–6 straightforward and dependable metrics – such as ticket volume, resolution time, escalation frequency, and sentiment – rather than overwhelming your team with an excess of variables [1][17]. When Customer Success Managers (CSMs) clearly understand the meaning behind the score and the actions it prompts, they’re far more likely to trust and use it effectively.
Automation transforms health scoring from a periodic task into a real-time alert system. By linking your support platform to automated data collection and AI-driven sentiment analysis, you can identify churn risks within 2–3 days instead of waiting 2–4 weeks [3]. In fact, AI-powered models can predict churn with 78% accuracy up to 60 days in advance, significantly outperforming traditional manual scoring, which only achieves 45% accuracy [9].
Once implemented, your model will need regular fine-tuning based on actual outcomes – renewals and cancellations – to ensure accuracy as your business evolves [2][10]. Creating feedback loops with your CSMs, tracking the velocity of score changes instead of static figures, and recalibrating your model every quarter will help you adapt to shifting customer behavior. This is especially important for addressing challenges like silent churn.
Silent churn remains one of the most elusive threats. Only 30% of customers provide a reason for leaving [10], and a sudden decline in support activity from an account that was previously engaged could indicate they’re no longer finding value in resolving issues [2]. Your health score should prioritize flagging these quiet signals with urgency.
The data you already have from support interactions is enough to reduce churn and safeguard revenue. By starting with a focused set of metrics, automating data processes early, and continuously refining your approach, you can build a cost-effective, AI-driven system that fits seamlessly into modern B2B support workflows.
FAQs
What’s the fastest way to start a support-only health score?
The fastest approach is to collect essential support metrics – such as ticket volume, resolution time, escalations, and sentiment trends – and merge them into a straightforward scoring model. By setting up fields for these metrics in your CRM, you can calculate a score directly from the data you already have. This method relies on existing support information, eliminating the need for complicated integrations and allowing you to quickly implement a customer health score based on support performance.
How do I set weights and thresholds without overfitting?
When working to prevent overfitting in setting weights and thresholds, simplicity and relevance should guide your approach. Begin by assigning initial weights to critical support metrics, such as ticket volume or sentiment trends. These metrics provide a foundation for understanding patterns. Over time, tweak these weights based on how well they predict outcomes.
It’s important to avoid overloading your model with too many metrics or setting thresholds that are overly precise. This can lead to unnecessary complexity and reduced effectiveness. Instead, make it a habit to regularly review and recalibrate your model. Doing so ensures it remains practical and continues aligning with current support data.
How can I catch “silent churn” if ticket volume drops?
To spot "silent churn" when ticket volume drops, keep an eye on subtle warning signs. These might include slower response times, canceled meetings, or a noticeable shift in communication tone. Support data can also reveal dissatisfaction, such as declining sentiment in interactions, payment problems, or an uptick in escalations.
AI-powered tools can be incredibly helpful here. They can analyze patterns like negative sentiment or decreased engagement, flagging accounts that may be at risk. This allows teams to step in early with proactive outreach and address concerns before churn becomes a reality.