To build a customer health scoring model using support signals instead of relying on subjective CSM notes, focus on objective, real-time data from support interactions. Metrics like ticket resolution times, escalation rates, and AI-driven sentiment analysis provide a scalable, accurate, and proactive way to monitor account health. Here’s how you can do it:
- Use Key Support Metrics: Base health scores on measurable data such as ticket resolution times, escalation rates, sentiment analysis, CSAT (Customer Satisfaction), and CES (Customer Effort Scores).
- Normalize and Weight Metrics: Convert raw data into a 0–100 scale and assign weights based on their predictive value for churn or retention.
- Segment Customers: Tailor scoring models for different customer groups (e.g., enterprise vs. SMB) by adjusting metrics and lookback periods to match their specific behaviors.
- Automate with AI: Use AI tools for real-time sentiment analysis, predictive insights, and automated health score updates. AI can identify risks faster and flag subtle dissatisfaction patterns.
- Monitor and Refine: Continuously validate the model against actual churn and renewal data, adjust weights as customer behaviors change, and ensure human oversight for nuanced cases.
Why it works: Support signals eliminate bias, provide continuous monitoring, and allow teams to manage more accounts efficiently. Companies using these models report up to 2x higher retention rates and identify churn risks 25–40% faster.
Quick Tip: Pair automated health scoring with dashboards and alerts to act immediately when scores drop or sentiment shifts.
How to Create a Customer Health Score With 4 Metrics
Why Support Signals Beat CSM Notes Alone
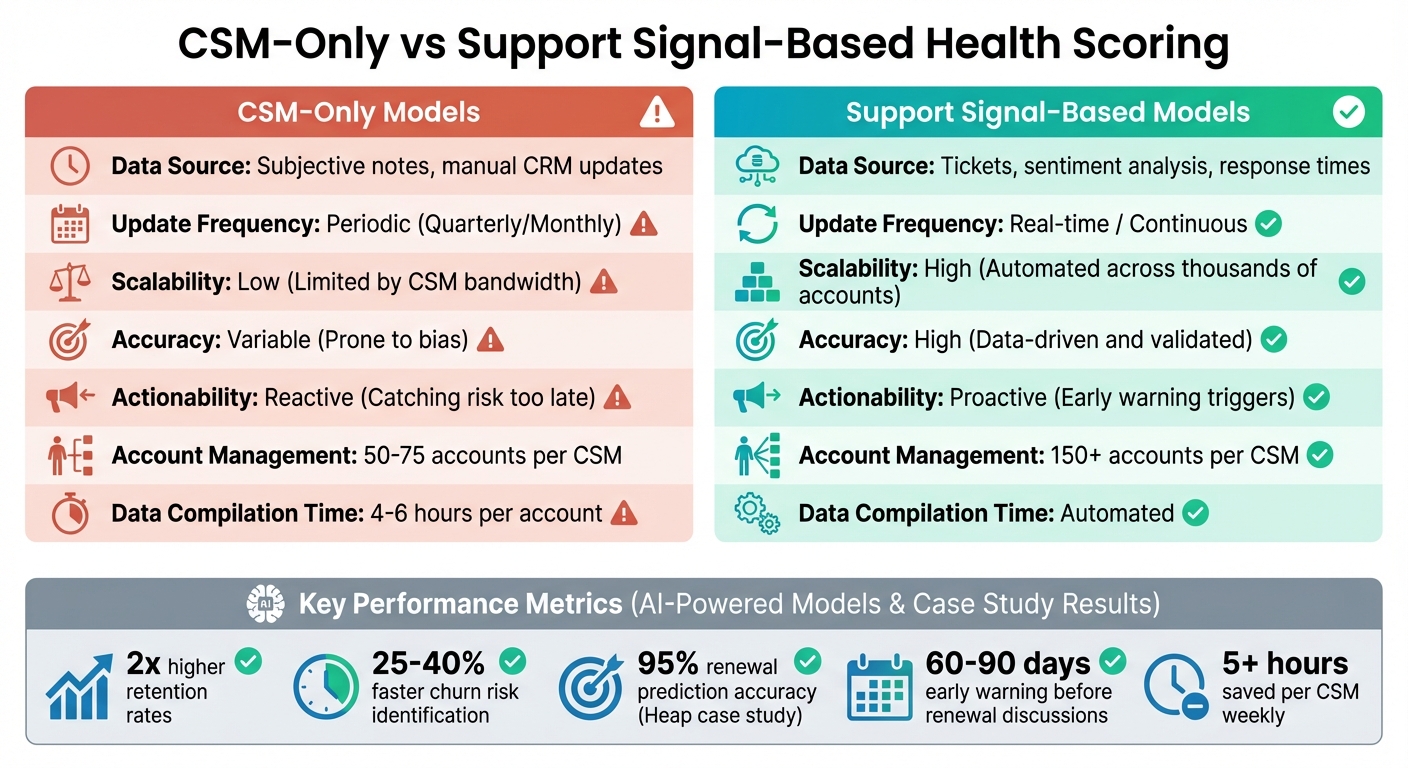
CSM-Only vs Support Signal-Based Customer Health Scoring Models Comparison
Problems with CSM-Only Models
Relying solely on CSM notes introduces a layer of subjectivity that can lead to inconsistent and unreliable assessments. For instance, one manager might consider an account "stable", while another could flag the same account as high-risk. This inconsistency becomes even more problematic as the number of accounts grows from 20 to over 200.
Timing is another major issue. By the time a CSM records a champion’s departure or dissatisfaction, the damage may already be done – customer disengagement could be well underway. Manual notes often miss subtle warning signs, like a 40% drop in product usage or a surge in support tickets, which can occur between scheduled touchpoints. Without objective metrics, leadership faces challenges in conducting accurate pipeline reviews or prioritizing team efforts effectively.
"Without a systematic process, health assessments are inconsistent, subjective, and reactive rather than proactive." – Mikko Mäntylä, Co-founder & CEO, Realm
These challenges highlight the need for a more standardized, data-driven solution.
Advantages of Support Signal-Based Models
Support signals offer a real-time, objective alternative that eliminates human bias and provides continuous monitoring across all accounts. Unlike manual reviews, which can take 4–6 hours per account to gather data from disconnected systems, automated support signals enable CSMs to manage over 150 accounts by focusing on exceptions instead of routine updates.
The predictive capabilities of support signals are also far superior. Data-driven health scores can identify at-risk customers 60–90 days before renewal discussions, while AI models can detect churn risks 25–40% faster than traditional methods. A great example is Heap, which revamped its health scoring model in 2020. By replacing subjective CSM insights with automated data from Snowflake – tracking product query frequency and communication patterns – they achieved over 95% renewal prediction accuracy and saved each CSM more than 5 hours of manual analysis weekly.
| Feature | CSM-Only Models | Support Signal-Based Models |
|---|---|---|
| Data Source | Subjective notes, manual CRM updates | Tickets, sentiment analysis, response times |
| Update Frequency | Periodic (Quarterly/Monthly) | Real-time / Continuous |
| Scalability | Low (Limited by CSM bandwidth) | High (Automated across thousands of accounts) |
| Accuracy | Variable (Prone to bias) | High (Data-driven and validated) |
| Actionability | Reactive (Catching risk too late) | Proactive (Early warning triggers) |
Metrics like ticket resolution times, escalation rates, and sentiment analysis create a standardized baseline that manual notes can’t achieve. AI models even incorporate time-decay algorithms, ensuring that recent negative interactions weigh more heavily than older positive ones. This approach provides a much clearer and up-to-date view of customer health.
Core Support Metrics for Health Scoring
Ticket Resolution Times and First-Contact Resolution (FCR)
How quickly you resolve tickets can make or break customer trust. Long delays leave customers frustrated, which can lead to churn. First-contact resolution (FCR) is a key metric here – it measures whether issues are resolved during the first interaction. Solving problems upfront eliminates the need for follow-ups, saving time for both your team and the customer.
Modern tools take this further by analyzing bidirectional response times. For example, if a customer takes three days to reply to your team, it could hint at disengagement. On the flip side, quick and frequent exchanges often signal a stronger, more engaged relationship. These patterns offer insights into communication efficiency that traditional customer success manager (CSM) notes might miss.
But resolution speed and FCR are just the start. Escalation rates and sentiment analysis provide even deeper insights into customer health.
Escalation Rates and Sentiment Analysis
Escalation rates are a red flag when it comes to customer satisfaction. Frequent escalations – especially when customers request manager involvement – should weigh heavily in your health scoring model. For instance, a single escalation might be an anomaly, but three medium-priority tickets in two weeks point to a trend that demands attention. These patterns are often overlooked in manual reviews, but they can be critical indicators of dissatisfaction.
Sentiment analysis adds another layer of insight. AI tools can classify customer communications into Green (positive), Yellow (neutral), and Red (negative) categories. The context is key – a message like "We love the product, but we’re not renewing" might sound positive but carries a serious business risk. In such cases, sentiment analysis labels it Red due to its potential impact.
Together, escalation rates and sentiment trends provide a detailed view of customer satisfaction and potential risks. But to complete the picture, you also need to consider customer effort and satisfaction scores.
CSAT and CES Scores from Support Interactions
Customer Satisfaction (CSAT) scores offer direct feedback after a support interaction, while Customer Effort Scores (CES) measure how much effort customers need to resolve their issues. These metrics are more than just numbers – 71% of companies use CSAT to evaluate support team performance, and 48% tie these scores to employee bonuses or compensation. This creates a direct link between customer happiness and team behavior.
A high CSAT score is a positive sign, but declining trends should prompt a deeper dive into the root causes. Pairing CSAT data with ticket volume and sentiment analysis gives you a much clearer picture of customer health. For example, a drop in CSAT alongside an increase in unresolved tickets could point to systemic issues. AI tools can help analyze these metrics in real time, making it easier to act before problems escalate.
Here’s how some key support metrics influence health scoring and retention:
| Support Metric | Impact on Health Score | Relationship to Retention/Satisfaction |
|---|---|---|
| CSAT Score | Positive (if high) | Reflects immediate satisfaction with support quality |
| Ticket Volume | Negative (if high) | Indicates potential product friction or onboarding gaps |
| Resolution Time | Negative (if long) | Increases customer effort and frustration |
| Sentiment Tone | Variable | Red sentiment signals churn risk, even with high usage |
| Open Items | Negative (if high) | Unresolved issues can jeopardize renewals |
How to Build a Scalable Health Scoring Framework
Create a Weighted Composite Scoring Model
To start, transform all support metrics into a standardized 0–100 composite score. This means taking raw data – like 15 open tickets, a 4-hour resolution time, or a "Red" sentiment label – and normalizing it into a 0–100 scale. For example, a customer with no open tickets would score 100, while a customer with a high ticket volume for their tier would score lower.
After normalizing, assign weights to each metric based on how strongly it predicts churn. For instance, sentiment analysis might account for 30% of the total score, resolution time 25%, open tickets 25%, and engagement 20%. These weights should align with the factors that most impact retention in your customer base. Companies leveraging predictive, AI-powered health models have reported retention rates up to twice as high as those using traditional methods.
Not all signals carry the same urgency, so it’s crucial to prioritize recent interactions. Use time-decay algorithms to ensure that a support escalation from yesterday influences the score more than one from a month ago. Additionally, consider the customer’s size when evaluating ticket volume to avoid unfairly penalizing larger accounts.
Once you’ve established a unified score, refine your approach by segmenting customers to account for their unique usage patterns.
Segment Customers for Tailored Scoring
A one-size-fits-all scoring model rarely works. Instead, customize your scores by segmenting customers based on their specific needs. For example, enterprise accounts with dedicated customer success managers (CSMs) will require different metrics than self-service SMB customers. Group your customers by factors like account size, product usage, or lifecycle stage, and adjust scoring criteria accordingly.
For SMB or tech-touch tiers, where engagement tends to be lower, reduce the weighting on engagement metrics and place more emphasis on sentiment, open tickets, and response times. Onboarding accounts, on the other hand, should prioritize milestone completions and login activations over ROI metrics, which are more relevant for mature accounts. High-touch accounts might focus on executive engagement and quarterly business reviews (QBRs), while digital-only segments should emphasize in-app activity and knowledge base usage.
Also, adapt your lookback periods based on the customer segment. For Enterprise accounts, consider a 14–30 day window to allow for quicker interventions. For Mid-market accounts, a 30–60 day window works well, while SMB accounts benefit from a broader 90-day window. Shorter windows help you act quickly with high-value accounts, while longer windows reveal meaningful patterns in lower-touch segments.
Track Health Scores with Dashboards
Once your scoring model is fine-tuned and segmented, use real-time dashboards to translate data into actionable insights. Dashboards allow you to quickly identify accounts that require immediate attention. Set up alerts for key indicators, such as scores dropping below 60 or sudden negative sentiment shifts.
"Health scores only work when you can actually pull all that information together… Compiling this manually? That’s where the real work begins, and where most teams get stuck."
- Datagrid Team
Your dashboard should display both absolute scores (to monitor a customer’s progress over time) and relative scores (to compare them to peers). This dual perspective helps you identify individual account issues as well as broader trends across segments. Keep the interface user-friendly by focusing on 4–6 critical metrics instead of overwhelming your team with excessive data points.
sbb-itb-e60d259
Using AI to Automate Health Scoring
Collecting data from tickets, CRM records, billing systems, and product analytics can take 4–6 hours per account. By the time you’ve finished, the customer’s situation might already have shifted. AI removes this hurdle by automating data collection, scoring, and real-time monitoring across all systems. This creates the foundation for AI-driven sentiment analysis and predictive insights.
AI-Based Sentiment Detection and Predictive Analytics
AI leverages Natural Language Processing (NLP) to evaluate the tone and content of every support ticket, email, chat, and meeting transcript. Instead of depending on agents to manually flag issues, AI categorizes sentiment into clear labels like Green (Positive), Yellow (Neutral), or Red (Negative). It also tracks critical events, such as a customer saying, "we’re not renewing" or escalating concerns to leadership, and adjusts the health score immediately.
Take Qlik as an example: In 2021, they used AI-driven sentiment analysis to prioritize cases based on urgency and tone. This approach reduced customer escalations by 30% in just three months. Similarly, Fivetran used NLP predictions to identify customers needing attention, cutting churn by 25%.
Beyond analyzing sentiment, predictive analytics helps forecast outcomes like CSAT and CES scores before customers even provide feedback. By examining historical patterns such as ticket volume, resolution times, and communication frequency, AI calculates "Attention Scores" to predict which cases might escalate. Teams using these predictive models report up to double the retention rates and can identify churn risks 25–40% faster than manual methods.
These insights feed directly into automated health score updates, keeping everything current and actionable.
Automated Scoring and Real-Time Monitoring
AI recalculates health scores continuously in real time. Tools like Supportbench connect with support systems to track live metrics – such as open ticket counts, resolution times, and sentiment changes. Time-decay algorithms prioritize recent interactions over older data, ensuring the most relevant details are front and center. AI also fine-tunes the weighting of health components, such as sentiment or engagement, based on which factors have historically predicted churn or renewals most accurately.
Automated workflows add another layer by triggering alerts and playbooks when health scores drop below a set threshold or when sudden sentiment shifts are detected. The system can notify account managers, assign follow-up tasks, or escalate cases automatically.
Refining Models with AI-Driven Insights
AI doesn’t just automate scoring – it improves over time. Anomaly detection pinpoints subtle changes in customer behavior, like reduced product usage, shifts in communication frequency, or changes in tone during support interactions. These early signals often provide more lead time than traditional metrics, allowing teams to act faster.
"AI gives us the ability to move from static, manual interpretation to predictive, data-driven action. Instead of waiting for a red score or a missed milestone, we can now see subtle behavioural shifts."
- Iliyana Stareva, Thought Leader in Customer Success and AI
To maintain accuracy, human oversight is essential. Customer Success Managers (CSMs) and support leads should validate or adjust AI-generated sentiment predictions, especially when industry-specific jargon or unique customer dynamics come into play. Cross-referencing data across systems is also crucial – if support tickets show frustration but product usage is high, AI can flag this inconsistency for deeper review.
Lastly, segment AI models by customer type. For SMB or tech-touch accounts, reduce the emphasis on engagement metrics (since interaction levels are naturally lower) and focus more on sentiment and ticket volume. For enterprise accounts, prioritize metrics like executive engagement and response times. Tailoring AI weights to each segment ensures fairness and prevents penalizing customers for normal behavior within their tier.
How to Monitor and Improve Health Scoring Models
A health scoring model’s true potential lies in its ability to adapt and stay relevant over time. While automation provides real-time insights, consistent monitoring ensures these insights reflect actual customer behavior. Without this upkeep, even the most advanced model can lose its edge. Regular validation and updates not only preserve accuracy but also enable proactive customer engagement.
Regularly Validate Scoring Accuracy
To keep your health scoring model reliable, compare its outputs with real-world data on retention, renewals, and churn. For example, if customers marked as "healthy" are churning or those labeled "at-risk" are renewing, the model needs immediate adjustments. In 2020, Heap collaborated with its Data Science team to test 18 metrics against historical renewal data. By incorporating a "consumption" category to account for plan size and usage gaps, they developed a model with over 95% accuracy in predicting renewals. This improvement also saved Customer Success Managers (CSMs) more than five hours per week on manual analysis.
Discrepancies in data – like high sentiment scores paired with high product usage – warrant deeper investigation. To reduce bias, replace subjective inputs like CSM sentiment with automated signals, such as tracking the last communication from key decision-makers. While AI can automate much of the process, CSMs should still review and adjust predictions to account for nuances that raw data might overlook.
Set Thresholds and Alerts for Early Intervention
Once you’ve validated your scoring model, use thresholds to act quickly when customer health declines. For instance, set alerts to trigger before a score drops into the "Critical" range. Pay attention to trends, like a 15-point drop over 30 days, which may indicate an urgent issue.
Segment customers into groups – Healthy (71–100), At Risk (31–70), and Critical (0–30) – and create targeted alerts and playbooks for each category. Companies using AI-enhanced predictive models have reported up to double the retention rates and the ability to identify churn risks 25–40% faster compared to manual processes.
Update Models as Customer Needs Change
As your customers evolve, so should your health scoring model. Adjust metric weights to reflect shifting priorities and behaviors. Test new scoring formulas against historical data to evaluate whether they could have better predicted past churn events. When dissatisfaction is flagged, conduct root-cause analyses, such as reviewing support tickets, to identify underlying issues. Regularly audit your training data to ensure the model performs fairly across all customer segments.
"AI health scoring doesn’t replace your health model – it enhances it. Instead of a fixed formula, AI looks for patterns, correlations, and anomalies across your entire customer base."
- Iliyana Stareva, Author and CX Leader
Share insights from health trends across teams like Support, Success, and Sales. This ensures the scoring model aligns with broader business goals, such as driving expansion and increasing net recurring revenue (NRR).
Conclusion
Creating a customer health scoring model based on support signals transforms how businesses approach customer retention. Unlike relying on manual Customer Success Manager (CSM) notes, real-time support data offers a precise and scalable way to monitor customer health. By using a weighted composite model, segmenting customers effectively, and tracking scores through dashboards, companies can move from reactive problem-solving to proactive risk management.
AI takes these benefits to the next level. Companies leveraging predictive, AI-driven health models have reported up to 2x higher retention rates and can identify churn risks 25–40% faster than traditional manual methods. AI-powered sentiment analysis can detect subtle dissatisfaction in support tickets that humans might overlook, while automated alerts enable immediate action when a health score dips below a set threshold. These insights not only improve customer satisfaction but also boost operational efficiency.
On the operational side, automated health scoring enables CSMs to manage 150+ accounts, a significant jump from the typical 50–75 accounts managed manually. This allows CSMs to focus on addressing high-priority issues rather than spending their time compiling data.
"Seeing risk before it becomes visible is one of the biggest competitive advantages a SaaS company can build."
- Iliyana Stareva, Thought Leader in Customer Success and AI
To ensure your model remains effective, it’s essential to validate, fine-tune, and maintain human oversight. Regularly compare your model’s predictions with actual churn and renewal data, adjust metric weights as customer behaviors shift over time, and involve CSMs to review and refine AI outputs when needed. By grounding your health scoring in support signals, you replace guesswork with certainty and shift from reacting to preventing.
FAQs
How can support signals make customer health scoring more accurate than relying on CSM notes?
Support signals improve customer health scoring by incorporating real-time, measurable data such as ticket resolution times, escalation rates, sentiment analysis, and patterns in support interactions. These data points offer a clear and up-to-date view of customer behavior, unlike CSM notes, which may rely on subjective or retrospective observations.
Using support signals allows you to build a flexible, forward-looking model that detects potential problems early, uncovers opportunities for improvement, and provides a more accurate picture of customer health. This method empowers teams to make better decisions, enhance customer satisfaction, and tackle risks before they escalate.
How does AI improve customer health scoring using support data?
AI is transforming customer health scoring by processing massive amounts of support data – like ticket resolution times, escalation patterns, and customer sentiment – to generate real-time, dynamic health scores. Unlike outdated manual approaches, AI can handle unstructured data, such as emails and chat logs, and adapt to changing patterns, offering a clearer picture of customer health.
By spotting early warning signs – like shifts in sentiment, rising escalations, or declining engagement – AI allows teams to tackle risks and uncover growth opportunities before they become critical. It also automates score updates, ensuring support teams always have the latest insights at their fingertips. This approach makes health scoring more efficient and predictive, giving organizations the tools to prioritize retention and upselling while cutting down on manual work.
How can businesses adapt customer health scoring models for different customer segments?
To fine-tune customer health scoring models for various segments, businesses should adjust metrics, weights, and thresholds to match the unique characteristics and needs of each group. Start by identifying specific goals for each segment. For example, you might focus on boosting retention for enterprise clients or increasing upsell opportunities for small and mid-sized businesses (SMBs). From there, integrate relevant data points such as product usage, support interactions, and financial performance to build a scoring system that fits.
For enterprise customers, metrics like escalation rates and sentiment analysis might take priority. On the other hand, SMBs could benefit from focusing on product adoption and engagement metrics. Regularly revisiting and updating these models is key to staying in sync with evolving customer behaviors and business priorities. By doing so, support teams can allocate resources more efficiently and address potential risks early, leading to better results across all customer segments.