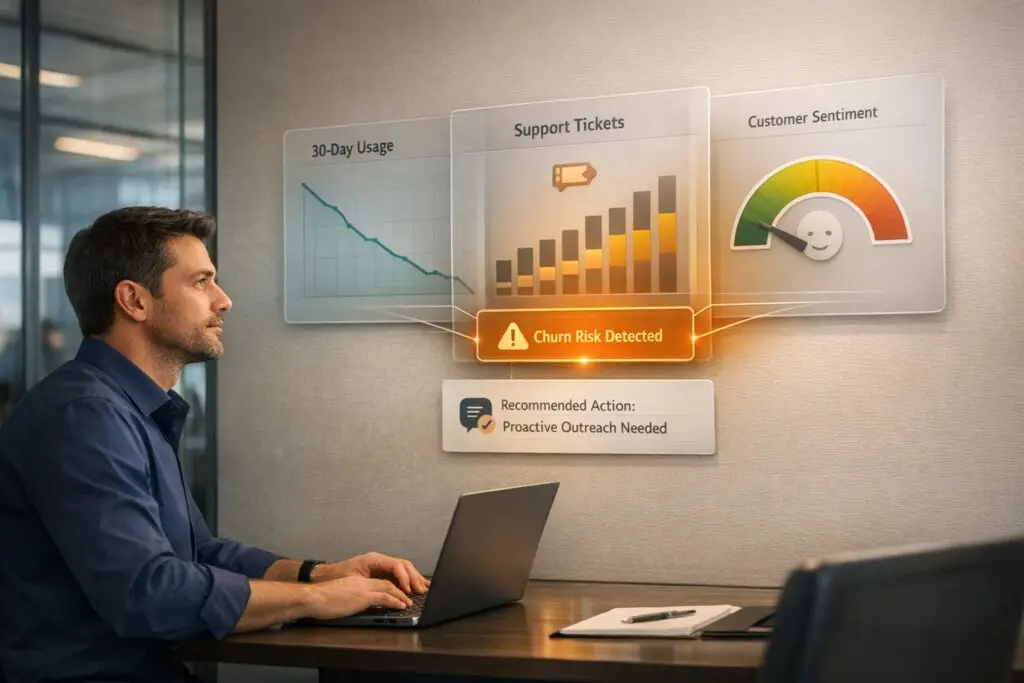
Silent churn happens when customers disengage quietly – fewer logins, less feature use, or unresolved frustrations – without outright complaints. These subtle patterns often go unnoticed until it’s too late, risking revenue loss.
Key points:
- Reduced product usage: Drops in logins, feature engagement, or session duration signal disengagement.
- Increased ticket friction: Surges in support tickets, unresolved issues, or changes in tone (e.g., curt or formal language) indicate dissatisfaction.
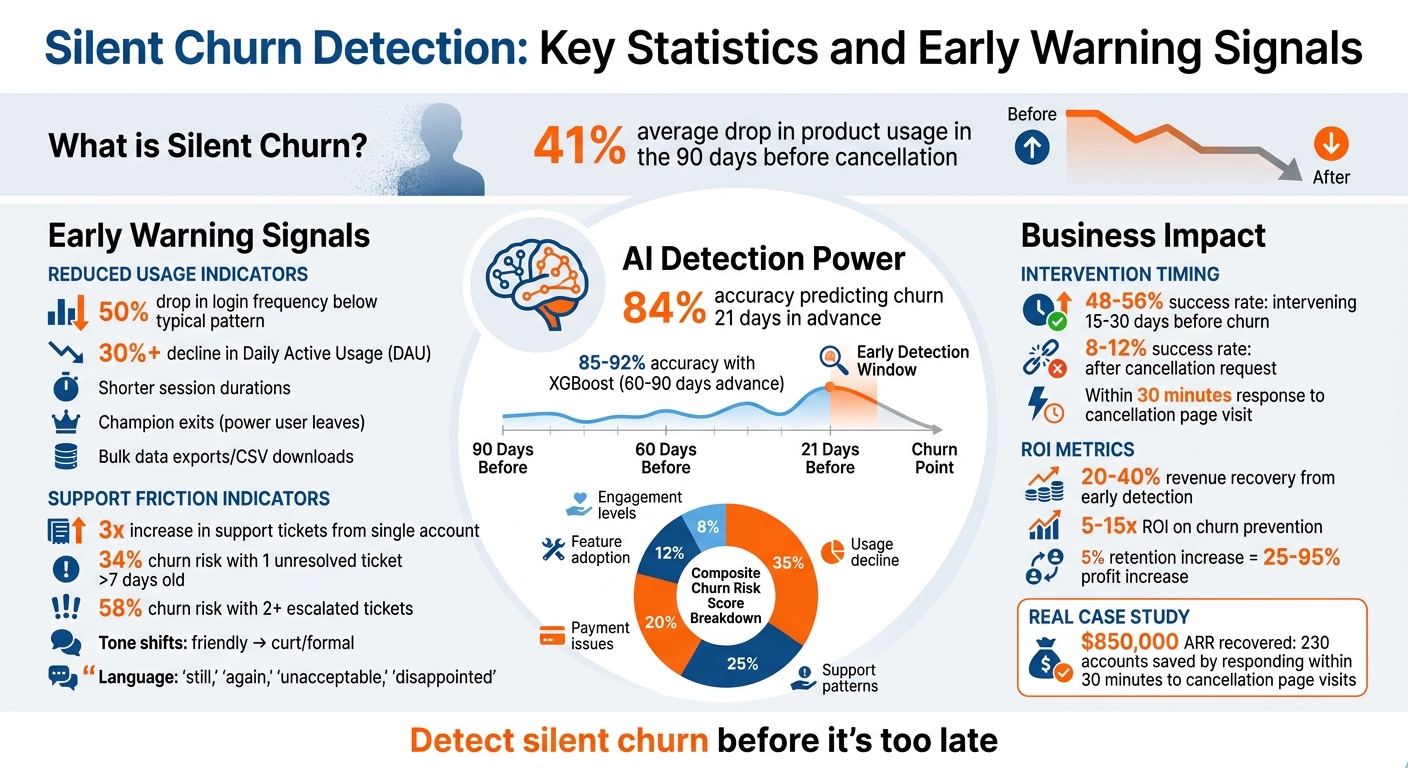
- AI detection: Predict churn up to 21 days in advance with 84% accuracy by analyzing usage, sentiment, and support trends.
- Actionable strategies: Personalized outreach, AI-driven B2B customer support, and dynamic SLAs can help re-engage customers before they cancel.
Catch silent churn early to retain existing customers – saving them is far cheaper than acquiring new ones.
Silent Churn Detection: Key Statistics and Early Warning Signals
How to Spot Silent Churn Signals
Silent churn doesn’t come with obvious signs like angry cancellation emails. Instead, it hides in subtle patterns of behavior that hint at disengagement long before a customer decides to leave. Recognizing these signals early – while distinguishing them from normal fluctuations – can help you retain customers before it’s too late. Let’s break down two key indicators: reduced product usage and increased ticket friction.
Reduced Product Usage
A clear warning sign of silent churn is a consistent drop in how often customers engage with your product. Occasional dips might be normal, but a sustained drop – like login frequency falling 50% below a user’s typical pattern – should raise concerns. For instance, if a user who logs in daily suddenly shifts to just twice a week, it’s a red flag. Similarly, a 30% or greater decline in Daily Active Usage (DAU) suggests disengagement and calls for proactive action [2].
Another critical sign is when customers stop using core features that deliver the most value. These might include tools like automated reporting, advanced integrations, or collaborative workflows. Research indicates product usage often drops by an average of 41% in the 90 days leading up to a cancellation [3]. Other patterns to watch for include shorter session durations, a shift from deep engagement to surface-level use, or reduced interaction with key features overall [2][5][7].
Bulk data exports or frequent CSV downloads could indicate that a customer is preparing to migrate to another platform [5]. Additionally, pay attention to "champion exits", where a key power user leaves the company or their email is deactivated – this significantly increases the risk of churn for that account [5].
Increased Ticket Friction
While product usage metrics highlight disengagement, key support metrics often provide the first clear signs of customer frustration. A sudden surge in support queries – like a 3x increase from a single account – can indicate recurring technical issues or dissatisfaction [2]. Repeated tickets for unresolved problems suggest growing frustration and a breakdown in trust [4].
Changes in tone and language in customer interactions are another red flag. If communication shifts from friendly and cooperative to curt and formal – or includes words like "still", "again", "unacceptable", or "disappointed" – it’s a sign that frustration is escalating [8]. Escalation behaviors, such as involving managers, CC’ing leadership on emails, or demanding written documentation, may indicate that the customer is planning their exit [5][4].
Even a single unresolved support ticket older than seven days can increase the likelihood of churn to 34%, while two or more escalated tickets push that risk to 58% [4]. These insights can help trigger automated retention efforts through AI-driven support systems. Interestingly, silence from a previously active support user can be just as concerning as an uptick in tickets – it often means they’ve given up rather than resolved their issues [7].
"Support is a gold mine of early customer churn signals for one simple reason: it’s where customers tell the truth first."
- Josh Solomon, Mosaic AI [8]
The trick to identifying silent churn is to focus on changes in behavior rather than absolute numbers. For example, logging in twice a week isn’t necessarily bad – unless the user used to log in daily [7]. Businesses that track these early warning signs can recover 20% to 40% of the revenue they might otherwise lose [5].
sbb-itb-e60d259
Setting Up Systems to Monitor and Detect Silent Churn
Once you’ve identified what silent churn looks like, the next step is to create systems that catch it early. Relying on spreadsheets or instincts rather than integrated analytics and AI tools can leave a dangerous gap between spotting an issue and losing a customer.
Using Integrated Analytics for Monitoring
The first step is to bring together your product usage data, support ticket history, and billing information into a single, unified view. Focus on leading indicators instead of lagging metrics. For instance, track Usage Velocity, which measures changes in Daily Active Usage (DAU) and feature adoption instead of just counting logins. A sharp drop in activity – like weekly logins falling from 15 to 7 in two weeks (a 53% decline) – should immediately raise a red flag [10].
To quantify risks, implement a weighted health score. Assign points to behaviors that signal trouble, such as no logins in 14 days, a 50% drop in Weekly Active Usage (WAU), unresolved tickets older than seven days, or failed payments [11][12]. This scoring system allows for automated responses:
- Moderate risk: Trigger educational email sequences.
- High risk: Prompt Customer Success Manager (CSM) outreach.
- Critical accounts: Escalate to executives within 48 hours [4][10].
Another key tactic is to monitor "Golden Signals" – actions that suggest a customer is disengaging. These include visits to pages like /billing/cancel or legal terms, bulk data exports, frequent CSV downloads, or sudden silence from previously active users [2]. These signals demand immediate attention. Tools like Supportbench can send real-time alerts to Slack or Teams, enabling your team to respond within minutes rather than days.
Integrated analytics lay the groundwork for the next level: AI-driven detection systems that refine these early warnings even further.
Using AI to Detect Warning Signs
AI takes monitoring to the next level by analyzing historical data to predict churn up to 21 days in advance with 84% accuracy [4]. Machine learning models like XGBoost can push this accuracy to 85%-92%, identifying at-risk accounts 60 to 90 days before they cancel [10]. These models generate a Composite Churn Risk Score based on weighted factors such as:
- Usage decline: 35%
- Support patterns: 25%
- Payment issues: 20%
- Feature adoption: 12%
- Engagement levels: 8% [4]
One of the most valuable AI capabilities is detecting Sentiment Drift – a subtle shift from warm, collaborative communication to colder, more formal tones. This change often occurs months before usage drops [1]. AI tools analyze messages using Conversation Graphs, which track sentiment polarity, intent signals (e.g., comparing features versus expressing frustration), and tone shifts over time. For example, if a customer who used to sign off emails with "Thanks so much!" starts using "Regards", that shift could be an early warning [1].
"The cancellation email isn’t the signal – it’s the outcome."
- Bala, Applied AI Studio [10]
Modern AI systems also offer transparency through tools like SHAP (SHapley Additive exPlanations), which explain why an account was flagged. For instance, it might highlight that "usage dropped 40%" or "sentiment turned negative in the last three interactions" [10]. This insight helps CSMs address specific issues and create tailored outreach strategies. Intervening 15 to 30 days before churn increases the chance of success to 48%-56%, compared to just 8%-12% after a cancellation request is made [4].
Practical Strategies to Address Silent Churn
Detecting silent churn through AI is just the first step. The real challenge lies in acting quickly and effectively to re-engage customers before they cancel. Success hinges on personalized, timely outreach led by individuals with authority, rather than generic messages that fail to resonate.
Personalized Outreach Protocols
Generic emails don’t cut it when a customer shows signs of leaving. A better approach? Reference specific observations in your outreach. For instance: “I noticed you’ve encountered a few issues recently. Let’s connect to ensure everything is running smoothly. Do you have 15 minutes for a quick call?” [9]. This shows attentiveness without making the customer feel scrutinized.
Authority makes a difference. Customers are more likely to respond positively when the outreach comes from a manager, Customer Success Manager, or even a founder, rather than a frontline support agent [9]. This signals that their account is important and their concerns are being taken seriously.
Timing is everything. For critical signals like visiting a cancellation page, reach out within 30 minutes – not days [2]. For example, a mid-sized e-commerce SaaS company implemented real-time notifications for such visits. By contacting customers within 30 minutes, they saved 230 accounts in one quarter, recovering $850,000 in ARR [2].
A tiered approach to communication ensures the right level of attention. Use in-app nudges for quick fixes, email for detailed issues like billing, and human calls for high-value accounts [13]. While AI can draft personalized messages, high-priority cases should always involve a human review [13].
Another effective tactic is monitoring for unusual silence. If a customer who typically contacts support every few weeks suddenly goes quiet for over six weeks – especially if their product usage drops – investigate immediately [9]. A churn risk score can help prioritize outreach. For example:
| Signal | Risk Weight | Recommended Action |
|---|---|---|
| 3+ Support Contacts (30 days) | High (+2) | Proactive call from Manager/CSM |
| Declining CSAT Trend | High (+2) | Immediate outreach to resolve friction |
| Silence (Sudden stop in usage) | Medium (+1) | Check-in email with helpful resources |
| Cancellation Page Visit | Critical | Human outreach within 30 minutes |
"Proactive support is not interruption – it’s a guided hand offered when a customer is most likely to benefit."
- Ravi Menon, Senior Venue Strategist, Recurrent [13]
Once outreach protocols are in place, it’s essential to equip customers with easy self-service options to resolve their concerns independently.
Knowledge Base Optimization and AI Support
Personalized calls are vital for urgent issues, but AI-powered self-service tools can handle the repetitive, common questions that account for 40% to 60% of support tickets in many SaaS companies [17]. Keeping your knowledge base up to date is key to reducing friction and speeding up resolutions.
Modern AI systems, like those using Retrieval-Augmented Generation (RAG), can deliver precise, contextual answers by synthesizing information from multiple sources like help centers and changelogs [17]. For example, SeatGeek used an AI model in 2025 to address repetitive queries like “Where are my tickets?” During busy periods, this system increased automated resolution rates to 51.5% and improved AI CSAT scores from 34% to 70% in just four months [16].
AI also streamlines ticket management by tagging cases based on product, location, or topic, highlighting areas where self-service content can be improved [15]. High-performing systems use an "Analyze, Train, Test, Deploy" (ATTD) loop to refine knowledge bases without needing engineering involvement [14].
Deploy contextual triggers to assist users in real time. For example, if customers frequently abandon a billing page, an AI-powered prompt can offer immediate help or link to a guide [17]. Supportbench even uses AI to create knowledge base articles from resolved cases, generating summaries and keywords automatically.
AI-driven tools can significantly cut response times. Companies leveraging these systems have reduced first response times from 11 hours to 5.5 hours and slashed median resolution times from 18 hours to 2.4 minutes [16]. Generative AI tools also boost productivity for customer success managers by automating tasks like summarizing cases and updating statuses, delivering efficiency gains of 15% or more [18].
"The zero-training model has been amazing… it feels very personalized."
- Whitney Thomas, SeatGeek [16]
Dynamic SLAs and Prioritization
Static Service Level Agreements (SLAs) treat all support tickets the same, but dynamic SLAs adapt to real-time context, ensuring at-risk customers receive faster, more attentive service. This approach prioritizes cases based on factors like upcoming renewals or high churn risk scores.
Start by establishing a data baseline. Combine data from CRMs, ticketing systems, and call logs to create a unified view of the case lifecycle [19]. Then, define business-aligned rules to set resolution targets based on case type, urgency, and account value [19].
Use AI to analyze historical data and identify patterns that lead to SLA breaches. Generate dynamic risk scores for active cases – such as a "70% chance to breach in 12 hours" – to allow proactive intervention [19]. Connect these signals to a priority matrix, which aligns technical issues, usage drops, and intent signals with the potential revenue at risk [13]. For instance:
| Volume Pattern | CS Action | Timeline |
|---|---|---|
| 3x spike in 7 days | Immediate executive sponsor check-in | Within 24 hours |
| 50% increase for 30 days | Schedule deep-dive meeting to identify root causes | Within 1 week |
| Persistent volume exceeding twice the baseline | Assess product adoption and schedule training | Within 2 weeks |
| Zero tickets for 60+ days | Proactive engagement campaign to check health | Within 1 week |
| Same issue >3 times | Escalate to product team for a permanent fix | Within 48 hours |
Dynamic SLAs also help mitigate involuntary churn caused by payment failures. Intelligent retries and automated dunning campaigns can address these issues effectively. In 2024, 44.1% of businesses reported lower voluntary churn rates after focusing on subscriber experience [20]. For subscription-based companies, a monthly churn rate of 4% is a strong benchmark, though averages typically range from 1% to 5% [20].
"Closure isn’t just a metric, it’s a competitive advantage."
Measuring Success and Improving Retention Efforts
To ensure churn mitigation strategies work, you need to measure their effectiveness using the right metrics.
Key Retention Metrics to Track
Once you’ve implemented proactive retention strategies, it’s critical to track specific metrics to see if they’re working. Pay close attention to usage metrics like daily active users (DAU) and login frequency. A 30% or more drop in DAU or a 50% decline in login frequency often signals early warning signs of churn [2]. Similarly, if customers stop using key "sticky" features, it can indicate potential churn months in advance [2].
Another important area to monitor is support friction metrics. For example, the "Repeat Contact Rate" is a strong churn predictor – customers who contact support three or more times within 30 days churn at 2x to 3x the rate of others [9]. Escalation rates and response times are also worth tracking, particularly for high-value customers, to ensure they aren’t encountering unnecessary friction [9].
Customer satisfaction (CSAT), CES, and NPS trends are another early indicator of churn. Don’t just look at isolated scores – track CSAT changes over time and analyze sentiment in customer communications. Predictive models based on sentiment trends can achieve churn prediction accuracy rates exceeding 80% [1].
For example, between October 2025 and March 2026, a B2B SaaS project management company with $2.4M ARR used an AI-powered churn prediction framework to save 17 of 38 high-risk accounts. This effort reduced their monthly churn rate from 6.8% to 4.2%, recovering $280,000 in ARR within just 90 days [4].
When evaluating success, define a "save" carefully. A customer should only count as saved if they remain in a healthy state for at least 90 days after an intervention [12]. Use metrics like the Revenue Recovery Rate – calculated as (Recovered MRR ÷ Total MRR at risk) – to assess the financial impact. This metric is more meaningful than logo retention since retaining high-value accounts has a much larger impact on revenue [3].
"Data without action is just expensive storage. The companies getting value from analytics are the ones who’ve built decision-making processes around their insights."
- DJ Patil, Former US Chief Data Scientist [4]
Refining Strategies with AI-Powered Dashboards
Once your metrics confirm your strategies are working, AI-powered dashboards can help you fine-tune them further. These dashboards bring together qualitative signals like customer sentiment and intent with quantitative data like login frequency and support ticket volume, all in one place [1][12]. This unified view helps identify "silent churn" before it leads to cancellations.
AI systems can monitor sentiment drift and assign real-time risk scores by weighing signals – such as a 50% drop in login frequency or three or more support tickets within 30 days – to trigger targeted intervention workflows [9][12]. They also summarize the reasons behind an account’s risk, allowing Customer Success Managers to shift from reactive responses to proactive, tailored engagement [1].
To continuously improve, analyze both successful and unsuccessful retention efforts [12]. Effective churn prevention can deliver 5–15x ROI [12]. For instance, a business with $10M ARR and a 7% annual churn rate loses $700,000 in revenue annually [1].
It’s also essential to segment support metrics by customer tier or revenue to ensure high-value accounts receive the attention they need [9]. Use a weighted scoring system to assign points to risk factors (e.g., +2 for declining CSAT, +1 for response time above SLA), updating scores daily [9][12]. Dashboards can then route low-risk accounts to automated email workflows while escalating high-risk, high-value accounts to executive-led interventions [12].
These tools and strategies allow for constant refinement of outreach and support processes, fostering a proactive approach to customer retention.
"Your customer did not churn yesterday. They started churning three months ago – you just were not watching the right signals."
- KISSmetrics Editorial [12]
Conclusion: Turning Silent Churn into Retention Opportunities
Silent churn doesn’t announce itself with loud complaints or direct cancellation requests. Instead, it reveals itself quietly – fewer logins, shorter responses to support outreach, or a complete lack of curiosity about new features. These subtle signals often show up 60 to 90 days before a customer cancels [12][21]. If you’re paying attention to the right metrics, this window gives you a chance to act.
The challenge? Traditional manual monitoring methods often miss these early warning signs [2]. That’s where AI-native tools come in. By analyzing over 50 behavioral signals at once, these tools can identify risks like declining sentiment or reduced engagement before they escalate into cancellations [2]. This kind of proactive insight allows for timely, targeted interventions.
Here’s why it matters: A modest 5% increase in retention can drive profits up by an impressive 25% to 95% [21]. And with churn prevention delivering a return on investment of 5–15x [12], leveraging AI for early detection becomes not just practical, but essential.
Supportbench is designed to help you stay ahead of churn. Its AI-powered platform provides AI-driven sentiment analysis, automated routing for high-value accounts, and health scoring that flags dissatisfaction as early as 90 days in advance [21]. This shifts your approach from reacting to problems to preventing them. The platform also includes features like AI case summaries, predictive customer satisfaction (CSAT) scoring, and dynamic service-level agreements (SLAs) – all bundled into one comprehensive solution without hidden fees or per-seat pricing.
"The winning companies at retention aren’t those who pursue churn after the fact – they’re those who avoid it by treating silence as a sign, not a void."
FAQs
What’s the fastest way to confirm a usage drop is real churn risk, not seasonality?
To figure out if a drop in usage is tied to churn risk or just seasonal changes, start by examining behavioral patterns. Look for steady week-over-week declines and compare them to historical trends. Automated tools can be a big help here – they track things like login frequency and feature usage, highlighting unusual activity compared to expected seasonal shifts. This approach makes it easier to determine if the drop is a real churn warning or just part of normal ups and downs, allowing for quicker, informed decisions.
Which support-ticket signals are the strongest early warnings of silent churn?
The clearest early signs of silent churn are a drop in product usage, a period of behavioral silence leading up to cancellation, and changes in support interactions – such as a spike in customer contact or multiple support tickets within a short timeframe. These patterns often signal growing frustration or disengagement, allowing teams to spot and address at-risk customers before it’s too late.
How do I turn a churn risk score into clear, automated next steps for my team?
To make the most of a churn risk score, think of it as a prioritization tool rather than a simple yes-or-no indicator. Start by defining thresholds for different risk levels – like low, medium, and high – and use these to trigger automated actions such as alerts, escalations, or tailored outreach. Regularly review and adjust your workflows and thresholds to stay aligned with your retention objectives. This approach helps your team tackle silent churn more effectively and proactively.