
Want to reduce customer churn? Start by building a data-driven Customer Health Score (CHS).
A CHS combines key metrics – like usage patterns, support tickets, and payment activity – into a single score that predicts whether customers will renew, expand, or churn. Instead of reacting to problems too late, CHS helps you identify at-risk accounts early.
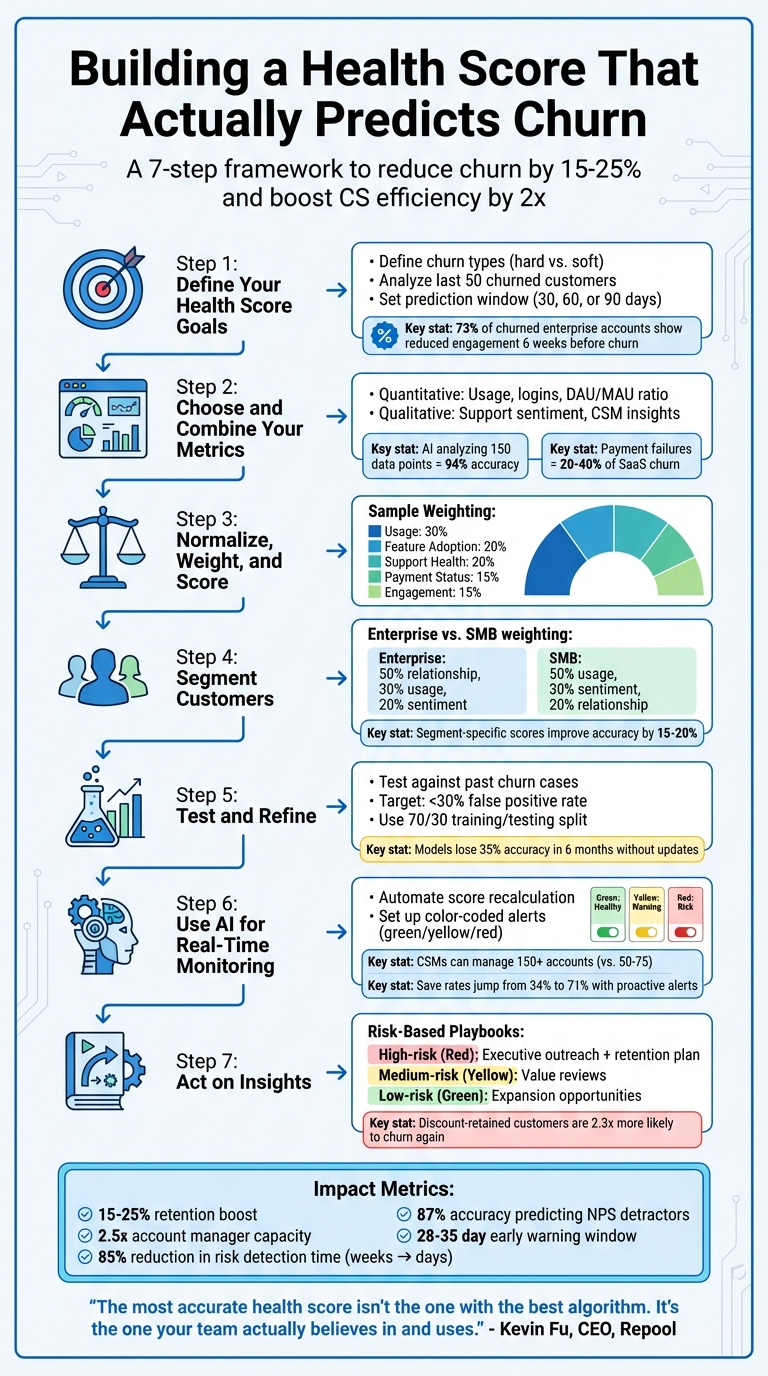
Here’s what you’ll learn:
- How to define churn for your business (hard vs. soft churn).
- Selecting and combining metrics (usage, sentiment, and financial data).
- Setting prediction windows (e.g., 30, 60, or 90 days).
- Segmenting customers for better accuracy through advanced customer management (SMBs vs. enterprises).
- Using AI for real-time monitoring and automated alerts.
- Turning insights into action with tailored playbooks.
Key takeaway: A well-designed CHS is not just a score – it’s a tool for taking action before churn happens. Done right, it can boost retention by 15–25% and increase customer success efficiency by over 2x.
Let’s dive into the steps to build a system that works.
7-Step Process to Build a Customer Health Score That Predicts Churn
How to Create a Customer Health Score With 4 Metrics
sbb-itb-e60d259
Step 1: Define Your Health Score Goals
Start by clarifying what you want your health score to achieve. This isn’t about generating a random number – it’s about creating a system that prompts your team to take action. As ChurnWard explains:
"The point of a health score isn’t to generate a number. It’s to trigger action" [5].
If your goals aren’t clear, you risk creating a score that looks good on paper but fails to actually help your team prevent churn.
Define What Churn Means for Your Business
Churn can mean different things depending on your business. For some, it’s a canceled contract (hard churn). For others, it might be a drop in engagement or a downgrade to a lower-tier plan (soft churn) [3].
To get a better picture, analyze the behavior of your last 50 churned customers over the past 12 months. Pay attention to key changes at 30, 60, and 90 days before they left. For enterprise customers, a common early warning sign is reduced engagement from key stakeholders about six weeks before churn – 73% of churned enterprise accounts follow this pattern. Meanwhile, SMB customers often show signs like fewer logins or a halt in feature usage [7]. Recognizing these patterns helps you design a health score that reflects the unique needs of each customer segment.
Once you’ve defined churn for your business, the next step is figuring out how much time your team needs to act on these insights.
Set Your Prediction Window and Baseline
Your prediction window determines how far in advance you can identify at-risk accounts. A 30-day window is useful for spotting immediate risks, but different signals emerge at different times [6]. For example, shifts in sentiment often appear 6–8 weeks before noticeable behavior changes [3], while relationship-based metrics may signal churn even earlier.
Choose a prediction window that aligns with your team’s ability to act. If scheduling a value review takes three weeks, a 14-day window won’t give you enough time. AI tools, for instance, can flag potential churn an average of 47 days before it happens [5]. For enterprise accounts, a 90-day window focusing on relationship depth and renewal timelines might be ideal. For SMBs, a shorter 14-day rolling window that tracks logins and feature use often works better [3][7].
Finally, establish baselines by comparing current scores to historical churn data. These baselines should vary based on customer type, team size, and lifecycle stage. For instance, a score of 70 might indicate a healthy enterprise account but could be a red flag for a new SMB customer still in onboarding. Tailoring these baselines ensures your health score is meaningful and actionable.
Step 2: Choose and Combine Your Metrics
Creating a reliable health score means pulling insights from various sources. Quantitative metrics tell you what’s happening, while qualitative signals help explain why it’s happening [2]. If you rely on just one type, you risk "single-signal blindness." For example, high product usage might look great on paper, but without examining support tickets, you could miss signs of frustration – like customers only sticking around because they feel trapped [3].
To make accurate churn predictions, you need a mix of data points. An AI model analyzing 150 data points from six sources can achieve 94% accuracy in predicting churn [5][9]. While you don’t need to start with that level of complexity, incorporating both quantitative and qualitative inputs from the beginning is crucial.
Quantitative Metrics: Usage and Engagement Data
Start with usage patterns to get a clear picture of customer engagement. Track login frequency over a 14-day period – this gives a faster read on disengagement compared to monthly metrics. The DAU/MAU ratio (daily active users divided by monthly active users) measures how "sticky" your product is, while feature adoption data reveals both breadth (how many features are used) and depth (whether key features are being utilized) [2].
In B2B settings, the ratio of active users to total purchased seats is a key indicator. For instance, if a customer has 50 licenses but only 12 users log in regularly, that’s a red flag. Financial data also plays a role – late payments, failed credit card charges, and upcoming renewal dates (especially within 90 days) are all churn predictors. Interestingly, involuntary churn from payment failures makes up 20% to 40% of overall SaaS churn [5].
While this kind of usage data is a strong starting point, it needs to be paired with insights into the customer experience for a full picture.
Qualitative Signals: Support and Success Data
Numbers alone don’t tell the whole story. Support ticket sentiment, escalation trends, and resolution times provide critical emotional context that usage data misses. These qualitative insights help uncover the "why" behind the numbers. AI tools can process thousands of support tickets, spotting frustration patterns and tone changes that are hard to catch manually [2][3].
Customer Success Managers (CSMs) also bring valuable insights that dashboards often overlook. Standardizing their intuition – say, by rating customer health on a 1–10 scale – allows you to blend human judgment with data [8]. As Kevin Fu, Founder & CEO of Repool, explains:
"The most advanced health score isn’t the one with the best algorithm. It’s the one your team actually believes in and uses" [8].
Metrics like NPS (Net Promoter Score) and CSAT (Customer Satisfaction Score) are helpful but tend to lag behind real-time issues, making predictive CSAT analysis a more proactive alternative. A more immediate red flag is the departure of a key contact, such as a client’s main champion – this should instantly impact the health score [3].
Why You Need Both Types of Metrics
Churn is rarely caused by a single factor. Combining quantitative and qualitative data ensures you get a complete picture. For example, high usage paired with negative support sentiment might indicate a customer feels stuck with your product rather than happy with it. If you’re managing 200 accounts with 10–15 tickets per account each month, that adds up to 2,000–3,000 tickets – far too many for manual review [2]. Automating the collection of both data types is essential, enabling CSMs to scale from managing 50–80 accounts to 150–200 accounts [3].
Step 3: Normalize, Weight, and Score Your Metrics
Now that you’ve defined and combined your metrics, it’s time to standardize and calibrate them for meaningful analysis.
Metrics, in their raw form, often operate on different scales. For example, a login count of 50 and a sentiment score of 3.2 measure entirely different things. Without aligning these scales, comparing or combining them is nearly impossible. Standardizing your metrics ensures they work together seamlessly, creating a unified health score model. Typically, this involves transforming metrics to a consistent scale, such as 0–10 or 0–100, so that all data points contribute equally and no single metric dominates due to its volume or range differences [5][4].
Convert Metrics to a Common Scale
The first step is to transform each metric to a 0–100 scale. This ensures that every factor contributes proportionally to the final health score. For instance, you could scale login counts to a 0–1 range and then multiply by 100. At the same time, clean your data by removing duplicates, filling in missing values, and standardizing timestamps. Even the most sophisticated models will produce flawed results if the underlying data is messy [4].
Once all metrics are on the same scale, the next step is to assign weights that reflect their importance in predicting churn.
Weight Metrics Based on Historical Data
Not all metrics carry the same predictive power. For example, product usage often has a stronger correlation with churn than metrics like NPS scores or billing patterns. To reflect this, assign weights based on historical data. Here’s an example of how weights might be distributed:
- Usage (30%)
- Feature Adoption (20%)
- Support Health (20%)
- Payment Status (15%)
- Engagement (15%) [2]
To determine these weights, compare your health scores with actual churn outcomes over a specific period, such as a quarter [5]. Techniques like logistic regression or random forest algorithms can help identify which metrics are most predictive [4]. Start with a simple model using 3–4 key metrics weighted equally, then refine it based on your findings [5]. Instead of relying on a single static score, track trends over time to identify patterns [3].
| Signal Category | Example Metrics | Suggested Weighting |
|---|---|---|
| High-Weight | Login frequency, feature adoption depth, champion departure | 20% – 40% |
| Medium-Weight | Support sentiment, meeting attendance, billing patterns | 15% – 20% |
| Low-Weight | NPS/CSAT scores, company news, competitor activity | 5% – 10% |
Document and Review Your Scoring Model
Keep your scoring model transparent and easy to understand. Document the logic in plain language, such as: "If no login in 7+ days, cap score at 40" [3]. This clarity allows team members to update the model without needing advanced coding skills.
To validate the model, split your data into training (70%) and testing (30%) sets. Evaluate its accuracy (correct predictions), precision (accuracy in identifying at-risk customers), and recall (the percentage of churned customers flagged by the model) [4]. Since customer behavior evolves, schedule monthly retraining sessions to incorporate new patterns [4].
Finally, cross-check your health scores with real-world outcomes like NPS responses or churn events. This ensures that low scores align with actual negative results, reinforcing the reliability of your model [6].
Step 4: Segment Customers for Better Accuracy
A one-size-fits-all health score model often misses the nuances of diverse customer behaviors. What’s considered healthy for a small startup can look entirely different for a large enterprise. For instance, a 10-person startup might show its engagement through daily logins and rapid feature adoption. Meanwhile, a 5,000-employee enterprise might log in less often but focus on strategic integrations across multiple departments.
Using segment-specific health scores can improve prediction accuracy by 15–20% [13]. Tailoring your scoring criteria to match how different types of customers interact with your product helps reduce false positives and spot early churn signals more effectively. By segmenting customers, you align your model with their unique usage patterns.
Segment by Industry and Company Profile
Once you’ve established aligned metrics, take it a step further by segmenting your customer base. This allows you to refine your predictions even more. For example, enterprise and SMB customers often require different scoring models.
For enterprise accounts, the depth of the relationship typically outweighs raw usage metrics. In these cases, you might assign 50% weight to relationship and engagement metrics, 30% to product usage, and 20% to customer sentiment [7]. Enterprises often thrive on cross-team collaboration, executive buy-in, and structured business reviews rather than frequent logins.
On the other hand, SMB customers tend to value immediate results and a self-service experience. For this group, you might reverse the weighting: 50% for product usage, 30% for sentiment, and 20% for relationship metrics [7]. Here, it’s more useful to track in-app activity, knowledge base visits, and feature adoption trends rather than focusing on things like quarterly reviews or roadmap alignment [11][12].
Customer Analytics Research Group: "Optimal metric weightings vary by 40–60% across customer segments and lifecycle phases." [7]
Adjust Scores Based on Lifecycle Stage
Customer health scores should evolve as customers move through different stages of their journey. During onboarding, focus on milestones like completing initial setup, activating logins, and reducing support tickets rather than measuring deep product usage [11][14][15]. For instance, a missed login during the first week could indicate a problem, but the same behavior six months later might simply mean the customer has automated processes effectively.
For more established accounts, shift your attention to metrics like ROI delivery, product depth, CSAT and NPS scores, and upsell activity [11]. Pay close attention to whether usage is expanding or stagnating. For example, a drop in a high score from 9.0 to 7.8 is often a stronger churn warning than a consistently average score [15].
It’s a good idea to review and update your segment-specific models at least quarterly to ensure they still align with actual churn and renewal trends [10][7]. As customer behaviors change, your health score model should adapt as well. This segmentation approach allows you to implement targeted intervention strategies that work seamlessly with your AI-driven monitoring systems.
Step 5: Test and Refine Your Model
This step connects the metrics you’ve designed with actionable customer insights, ensuring your Customer Health Score (CHS) stays reliable as customer behavior changes. Once your scoring model is designed, it’s crucial to test it rigorously and refine it as needed. Validation is key to ensuring your health score accurately predicts churn. A proven method is to reverse-engineer outcomes. Start by examining customers who churned in the past 6–12 months and compare them to those who renewed or expanded during the same timeframe [16]. Analyze their data at intervals like 90, 180, and 270 days before the event to identify which signals were present. Then, apply your model to these historical cases to evaluate its predictive accuracy.
"The most accurate CHS systems don’t start with a list of ‘best practices’ or copy-pasted templates. They start by reverse-engineering outcomes." – Union Square Consulting [16]
Test Against Past Churn Cases
Run your scoring model against historical data to see how well it performs. Focus on three key areas:
- Prediction accuracy: How often do low scores align with actual churn?
- Early warning capability: How far in advance does the model flag risks?
- False positive analysis: How many healthy accounts are incorrectly flagged as at-risk?
AI-enhanced health scores can predict churn 3–6 months in advance with over 85% accuracy. Companies using predictive models identify churn risks 25–40% faster than those relying on static methods [17][18].
If your false positive rate is higher than 30%, your Customer Success team could waste time chasing accounts that aren’t actually at risk [7]. On the other hand, if you’re failing to catch actual churners, your model may not be sensitive enough. A 70/30 split for training and testing data is a good practice to validate metric weights [4]. Use the results to fine-tune your model, adjusting it to better capture the true signals of churn.
Refine Based on Results
Once testing is complete, refine your model based on the findings. For example, if low login frequency doesn’t consistently signal churn in your historical data, reduce its weight in your scoring formula. Interestingly, companies using fewer than five high-quality metrics achieve 23% higher prediction accuracy compared to those using more than ten metrics [7]. Simpler models often outperform complex ones by focusing on the most predictive signals.
Static scoring models can lose up to 35% of their accuracy within six months due to shifting customer behaviors [7]. To stay ahead, recalibrate your model regularly – review metric performance every month and conduct a full validation at least once a year. Also, track how well your proactive interventions work. Are they improving customer outcomes and preventing churn? AI-powered systems can significantly lower false positive rates, reducing them from 40–50% to 15–20%, allowing your team to focus on accounts that genuinely need attention [3].
Step 6: Use AI for Real-Time Monitoring
Once your health score model is validated, the next step is automating its updates. Relying on manual reviews every quarter can cause you to miss subtle, gradual declines that may lead to churn. AI-driven systems, on the other hand, automatically recalculate health scores as new data streams in – whether it’s a login event, a support ticket, or a payment update. This ensures your team gets immediate alerts when risks arise [2].
The benefit? Automation eliminates the time-consuming task of manual data collection. For example, gathering data for a single account review can take 4 to 6 hours [2]. AI systems integrate seamlessly with CRMs, support platforms, billing tools, and communication logs, removing this bottleneck. This efficiency allows Customer Success Managers (CSMs) to manage over 150 accounts – more than double the typical 50–75 accounts – by focusing only on exceptions [2].
Set Up Automated Monitoring
Implement AI-powered dashboards that continuously track health scores and flag any changes in real-time. By running predictive models nightly on machine learning platforms, your team can start each day equipped with fresh, accurate risk insights [4].
AI also excels at analyzing large volumes of support tickets – often ranging from 2,000 to 3,000 per month – to identify sentiment shifts or recurring technical issues that manual reviews might miss [2]. For instance, if a customer submits multiple tickets about the same problem within a short period, AI can flag this as a sign of growing frustration. To make this data actionable, use color-coded dashboards: green for healthy accounts, yellow for warning signs, and red for at-risk customers [4]. This visual prioritization ensures your team can act quickly and effectively.
Automate Alerts and Escalations
With continuous monitoring in place, the next step is setting up automated alerts. Configure your system to notify the team when a health score drops below a critical threshold – say, 40 out of 100. These alerts can trigger immediate actions. For example, one SaaS company reduced its churn rate from 22% to 14% in just two months by implementing predictive health scoring with automated outreach [4].
Take it further by automating re-engagement efforts. If a score dips into the risk zone, the system can send a personalized email encouraging the customer to explore underused features. If this email doesn’t lead to a response or login, the system can escalate the issue by sending a follow-up or scheduling a call with a CSM [4]. This tiered approach ensures no account falls through the cracks, boosting "save rates" from 34% (reactive) to 71% (proactive) [6].
To avoid false alarms, cross-check data across systems. For instance, if a customer has logged numerous support tickets but CRM notes indicate a positive relationship, AI can flag this inconsistency for review [2]. Regularly retrain your models – ideally every month – to adapt to evolving customer behaviors and maintain accuracy [4].
With real-time alerts and automated processes in place, your team will be ready to turn these insights into proactive strategies in the next step.
Step 7: Act on Health Score Insights
With your predictive model and automated alerts set up, the next step is turning those insights into meaningful action. A health score only becomes valuable when it leads to action. As UserIntuition aptly put it, "The disconnect isn’t in the scoring itself – it’s in what happens after the score is calculated" [19]. To make sure no at-risk customer slips through the cracks, your team needs structured playbooks that translate risk levels into clear, actionable steps.
By combining your data-driven model with these playbooks, you can effectively turn risk scores into customer retention strategies.
Create Playbooks for Different Risk Levels
Develop specific response strategies for each risk category:
- High-risk accounts: These require immediate attention, such as executive outreach and formal retention plans, to prevent churn.
- Medium-risk accounts: Personalized value reviews can help uncover and address issues before they escalate.
- Low-risk accounts: Focus on nurturing the relationship and exploring opportunities for growth and expansion [1][19].
Each intervention should address the root cause of the risk. For example:
- If a customer’s score drops due to low engagement or negative sentiment about product capabilities, share your roadmap and offer workarounds.
- If the issue is a perceived lack of value, implement usage activation programs or explore contract restructuring.
- If the customer’s priorities have shifted internally, reposition your product to align with the needs of new stakeholders [19].
Avoid relying on discounts as a quick fix. Research shows that customers retained through discounts are 2.3 times more likely to churn again within 18 months compared to those retained through other means [19].
Another challenge: 67% of customers ignore outreach that feels like automated noise [19]. Make sure your playbooks focus on personalized, diagnostic messaging to spark real conversations and uncover specific pain points.
Track Intervention Results
Implementing playbooks is just the start – you also need to monitor their impact. Pay close attention to how well your interventions work by tracking:
- Retention improvements: Measure the percentage of at-risk customers who stay.
- Behavioral changes: Look for signs like increased login frequency or higher feature adoption.
- Long-term retention quality: Analyze whether retained customers remain engaged over time [19].
Use these metrics to refine your approach. For example, if certain interventions consistently succeed with specific risk profiles, update your health score thresholds and playbooks to reflect what works best. This feedback loop ensures your retention strategies stay effective and aligned with customer needs.
Measure Your Health Score’s Impact
Once your health score model is up and running, it’s time to ensure it’s delivering results. To prove its effectiveness, you need to measure two things: technical performance (how accurately it predicts churn) and business outcomes (its impact on revenue and efficiency). Without solid metrics, it’s hard to show value to leadership or fine-tune your approach.
Track Key Performance Metrics
Start by evaluating your model’s prediction accuracy. For churn predictions, aim for an accuracy rate above 70% for high-risk customers (those scoring below 40 on a 100-point scale). For expansion opportunities, target a prediction accuracy of over 60% for customers with scores above 80 [7]. A strong model should identify 90% of actual churn cases within the top 25% of risk scores [7].
Keep an eye on the false positive rate. If it’s too high – say, over 30% – your team may be wasting resources on unnecessary interventions [7]. The goal is to bring this rate down to around 15–20% [3].
Another critical metric is early warning lead time. AI-powered systems can significantly reduce the time it takes to detect churn risks, from the traditional 2–4 weeks to just 2–3 days – a reduction of up to 85% [3]. Health scores below 60 can predict Net Promoter Score (NPS) detractors with 87% accuracy, giving you a 28–35 day window to act before a customer leaves negative feedback [6].
Also, monitor the effectiveness of interventions. How successful is your proactive outreach?
"Our save rate went from 34% (reactive) to 71% (proactive). The early warning is everything." – Lisa Park, VP Customer Success at SuccessFlow [6].
Make sure your team contacts at least 80% of at-risk customers within 48 hours of a score drop [7].
Lastly, track operational efficiency gains. Automated health scoring can increase account manager capacity by up to 2.5x [3]. It can also save 4–6 hours of manual work each week [3]. These operational improvements lay the groundwork for showing the financial impact of your model.
Show ROI to Leadership
Operational metrics are important, but what really gets leadership’s attention is financial results. Tie your health score system’s performance to outcomes that matter to executives. For example, companies with effective health scoring often see a 15–25% boost in retention within six months [7]. AI-driven systems can raise Gross Revenue Retention (GRR) from 85–90% to 93–97% [3]. And remember, even a 5% increase in customer retention can drive profits up by 25% to 95% [1].
To quantify the financial impact, calculate the revenue saved by multiplying the number of retained customers by their average contract value. Effective health scoring can also increase Customer Lifetime Value (CLV) by 25% [7].
Create a monthly executive dashboard that highlights key metrics like retention lift, expansion revenue from high-opportunity accounts, and cost savings from improved Customer Success Manager (CSM) efficiency. This will help you tell a compelling story about how your health score model drives real business growth – and why it’s worth continued investment in AI-powered support systems.
Conclusion
Creating an effective health score is not a one-and-done task – it’s an evolving process that requires a strong foundation and ongoing adjustments. By following the seven steps outlined earlier, you’ve explored how to set clear objectives, balance quantitative and qualitative metrics, normalize and weight data, segment customers, test with real churn cases, implement AI-driven monitoring, and develop actionable playbooks. Each step is designed to build a system that doesn’t just react to problems but anticipates them.
Automation and timely action are at the heart of a dynamic health score. Interestingly, over 70% of business leaders lack confidence in their customer health scores when they rely on manual, rules-based systems [20]. Traditional quarterly assessments often fail to catch the slow, incremental signs of churn. In contrast, AI-powered tools update data hourly, cutting the detection time for churn risks from weeks to just a few days [3].
"A score tells you a fire has started, but it doesn’t put it out." – Stevia Putri, Marketing Generalist, eesel AI [20]
For a health score to truly make an impact, it must trigger immediate workflows – like automated alerts, tailored outreach, or leadership involvement – when risks are identified. Without these interventions, even the most accurate scoring system becomes just another static report. These automated actions align naturally with the proactive strategies discussed earlier.
As customer behavior shifts, your model must keep up. Regular updates – whether through retraining algorithms, testing against new churn scenarios, or tweaking weightings to reduce errors – are essential. Organizations that embrace this cycle of refinement see tangible improvements in retention and ROI. By embedding these practices into AI-driven support systems, you can ensure your strategy remains proactive and delivers real results.
FAQs
What’s the fastest way to start a churn-predicting health score with limited data?
When evaluating support performance, focus on key metrics like ticket resolution times, escalation rates, and sentiment scores. These provide a clear picture of how effectively your team is addressing customer needs.
To make these metrics actionable, normalize and weight them appropriately. This creates a balanced initial score that reflects overall performance. Leveraging AI tools can simplify the process by automating data collection and analysis, ensuring you get real-time updates and even predictive insights.
If you’re just starting, don’t worry about having a wealth of historical data. Begin with a small set of meaningful metrics. This allows for quick implementation and helps you build a foundation for more advanced analysis over time.
How do I pick the right prediction window for my support team’s response time?
To choose the right prediction window, focus on how your customers behave and what your business aims to achieve. Start by examining customer lifecycles and how often they interact with your brand. In many cases, a window of 30 to 90 days strikes a good balance – it’s long enough to reveal useful trends but short enough to let you act quickly. As you collect more data and notice shifts in customer engagement, adjust the window to stay aligned with their patterns.
How can I use AI alerts without flooding my team with false positives?
To avoid burdening your team with excessive false positives from AI alerts, prioritize precise and meaningful data such as ticket resolution times, escalation rates, sentiment analysis, and satisfaction scores. Make it a habit to regularly review and fine-tune your health score model to ensure alerts are tied to actual outcomes. Additionally, leverage real-time AI automation to adapt to ongoing behavior changes, steering clear of static thresholds that often lead to redundant notifications.