
In B2B support, agents often waste time switching between tools to gather basic account details. This inefficiency, known as the "swivel chair" problem, leads to slower service, higher costs, and frustrated customers. On average, agents spend 23 minutes per ticket retrieving data, costing teams 192 hours per week – equivalent to five full-time employees. Disconnected systems also hinder AI tools, resulting in incomplete insights and errors.
To solve this, centralize account data into a single, unified view. Start with a data audit to identify gaps, map systems, and assign a single source of truth for each data type. Focus on key fields agents need upfront, such as billing status, product usage, and interaction history. Use AI tools to surface relevant context instantly, reducing time spent searching.
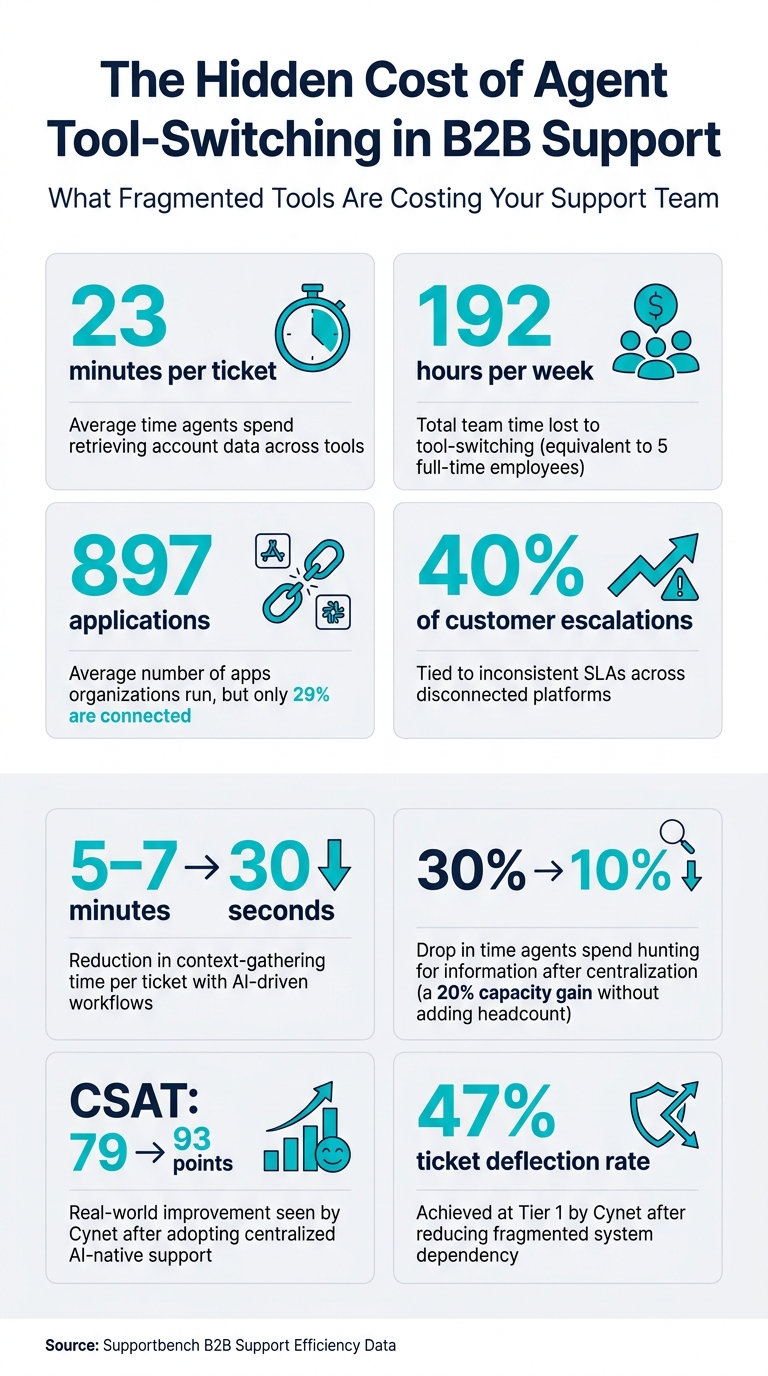
The Hidden Cost of Agent Tool-Switching in B2B Support
Mapping Your Data to Find the Gaps
Mapping your data is a critical first step in centralizing account information and cutting down the time agents waste switching between tools. Many support teams assume their tools are well integrated, but a detailed mapping often uncovers major gaps. On average, organizations run 897 applications, but only 29% of them are connected [2]. These gaps directly impact agent productivity.
Run a Tool and Data Audit
Start by cataloging every system that interacts with customer accounts. This includes your CRM, billing software, ticketing system, product analytics tools, and even internal resources like Slack threads or shared spreadsheets. For each system, document the type of data it holds, who owns it, and how often it syncs. The difference between real-time API syncs and nightly batch updates can be huge – especially when an agent needs accurate information in the middle of a conversation.
Using a simple mapping worksheet can make this process easier. Organize your data into four key tiers:
| Integration Tier | System Types | Primary Data Stored |
|---|---|---|
| Tier 1: Identity | CRM (Salesforce, HubSpot) | Account owner, lifecycle stage, renewal date |
| Tier 2: Commercial | Billing (Stripe, Chargebee) | Invoices, refunds, payment failures, plan tier |
| Tier 3: Performance | Analytics (Snowflake, GA4) | Cross-channel trends, SLA attainment |
| Tier 4: Diagnostic | Product/ERP (Jira, Segment) | Usage logs, feature flags, shipment tracking |
Assign a single source of truth for each data field. For instance, your billing platform should manage "Payment Status" rather than your CRM or helpdesk. Overlapping ownership can lead to conflicting data, especially during audits. Also, flag systems with API rate limits or sync delays – outdated information can cause costly mistakes, like offering refunds for invoices that have already been adjusted [4]. Once your audit is complete, focus on identifying where agents face the most friction.
Find the Biggest Points of Fragmentation
With your data map in hand, zero in on the areas where agents encounter the most challenges. Start by analyzing your top ticket categories and asking: how many systems does an agent need to check to resolve this issue? Common trouble spots in B2B environments include billing status, strategically managed support levels, and renewal dates.
"The best support integrations begin by mapping the questions agents ask in the first 30 seconds of a conversation." – Daniel Mercer, Senior SEO Content Strategist [3]
Pay special attention to handoffs between teams like Support, Sales, and Engineering. These transitions are often where context gets lost, creating frustration for both agents and customers. A clear warning sign is when agents start using unofficial tools like shadow spreadsheets or Notion pages to track customer details. While it may seem resourceful, it actually highlights gaps in your primary systems. Disconnected tools are a leading cause of fragmentation, with roughly 40% of customer escalations tied to inconsistent SLAs across platforms [5]. Fixing these handoff points should be a top priority.
sbb-itb-e60d259
Building a Single Source of Truth for Account Data
After identifying your data gaps through a thorough audit, the next step is to consolidate all that information into a single, unified view. This isn’t about adding more tools to your stack – it’s about ensuring the right data is instantly accessible with every customer case.
Define What Belongs in the Account View
Focus on simplicity. Include only the 6–10 key fields agents actually use in the first 30 seconds of a case. Overloading dashboards with unnecessary data points only slows things down.
"The fastest support teams do not try to give agents every possible data point. They give the right 6–10 fields, always current, always in the same place, and always tied to a clear action." – Daniel Mercer, Senior SEO Content Strategist [3]
A well-structured account view typically covers six essential areas:
- Identity and ownership: Key details like account name, contact roles, lifecycle stage, and renewal date.
- Commercial status: Information on subscription plans, invoice statuses, and payment issues.
- Product usage: Insights into feature adoption, entitlement logs, and error traces.
- Interaction history: A timeline of past tickets, emails, and calls.
- Health indicators: Metrics like NPS scores, customer health scores, and predicting churn risk.
- AI-generated context: Automated summaries and proactive alerts (e.g., "This customer has contacted support 3 times in the past 7 days").
Each section is designed to answer specific, time-sensitive questions agents face during their interactions.
Connect Your Data into One Dashboard
Start by enriching your support platform with one-way data feeds. This approach pulls in data without writing back to upstream systems, making it a low-risk and fast way to centralize information. Once this setup is reliable, you can add selective bi-directional syncing for specific actions like processing refunds or updating subscription plans.
The key to a successful integration lies in stable identifiers. Shared keys like Customer ID, Account ID, or Invoice ID ensure records across systems align correctly, avoiding duplication or mismatches. Assign clear ownership for each type of data: for example, your CRM handles identity data, your billing platform manages commercial details, and your product system tracks usage metrics. This avoids conflicts and ensures a single, reliable source for each piece of information.
Supportbench simplifies this process with its Salesforce synchronization feature. It allows teams to map Salesforce data directly into the agent view, including account-level fields and licensing details. The Datatables feature extends this further, enabling teams to attach custom structured data – like infrastructure details or training completion status – without requiring IT support. This creates a tailored account view that aligns perfectly with your support needs, rather than relying on generic templates.
Once all your data is in one place, the next step is using AI to make it work smarter for your team.
Use AI to Pull Up Account Data Faster
Even with a unified dashboard, agents still need to sift through and interpret the data. AI bridges this gap by automating the retrieval and synthesis of information. For example:
- AI case summaries: These provide a structured overview as soon as a ticket opens, eliminating the need to scroll through weeks of history.
- Customer activity summaries: These condense recent interactions into a quick snapshot, highlighting trends like repeated contacts or unresolved billing issues.
Supportbench’s AI Agent-Copilot takes this a step further. It searches through past cases and the knowledge base in real time, surfacing relevant context and suggesting responses as agents work [1]. This transforms a unified data layer from a simple storage solution into a true productivity tool, reducing the mental workload on agents and enabling them to focus on delivering better support.
Organizing Agent Workflows Around Centralized Data
Centralizing data is just the starting point. The real advantage comes when this data seamlessly integrates into agent workflows, ensuring the right information surfaces at the exact moment it’s needed.
Attach Account Context Directly to Cases
Agents shouldn’t waste time hunting for account details when a case comes in. A well-designed workflow engine can automatically gather and display account-specific information – like SLA tier, health score, renewal date, open bugs, and billing status – right within the ticket view. This concept, often called an agent context bundle, provides a snapshot of everything relevant to the account, eliminating the need for tab switching or manual searches.
Research shows that AI-driven workflows can cut the time spent gathering account context from 5–7 minutes per ticket down to just 30 seconds [8]. For example, Supportbench’s workflow engine enables teams to set up automated rules, like tightening SLA timers when a renewal is near or flagging high-priority cases when a health score dips below a certain threshold. Dynamic SLAs can adjust in real time based on account activity, ensuring agents respond with the urgency each situation demands.
Another key factor is translating raw data into clear, human-readable labels. A field labeled "status": "mql" doesn’t help an agent during a live conversation. Converting it to something like "Trial User" or "Trial Expired" removes unnecessary friction, making the agent’s job easier and faster [3].
This streamlined access to context also lays the foundation for smarter case routing.
Route Cases Smarter with Account Data
Traditional routing systems often rely on basic factors like ticket volume or keyword matching, overlooking the bigger picture of account priorities. Centralized data changes the game by allowing routing engines to consider factors like renewal dates, MRR, health scores, and billing status. For instance, an enterprise account with a renewal in two weeks and multiple open tickets demands a different level of attention than a trial user’s first inquiry. Routing cases based on commercial context – not just arrival order – can significantly improve outcomes [3][7].
Supportbench’s AI Predictive CSAT takes this a step further by forecasting customer satisfaction based on past interactions and case history. This predictive insight helps flag cases at risk of churn or with low satisfaction scores, allowing them to be escalated or assigned to senior agents before issues escalate.
Of course, effective routing depends on having consistent, well-structured data. Once account context is centralized and normalized, routing becomes a strategic tool – not just for managing workloads but for protecting revenue and strengthening customer relationships.
Keeping Data Accurate and Tracking Results
Centralizing account data only works if that data stays reliable over time. If your unified dashboard relies on outdated or mismatched records, agents may lose trust in the system, falling back into the inefficient habit of switching between tools to verify information.
Set Rules for Data Quality and Access
Once you’ve established a unified account view, keeping the data accurate becomes essential to maintaining agent productivity.
Start by clearly assigning responsibility for each data field. For instance, let your CRM handle identity-related fields while your billing system manages payment statuses and invoice details. This clarity avoids confusion and prevents conflicting updates.
Add a "last updated" timestamp to show agents when data was refreshed. To further support accuracy, implement fallback rules that display warnings if an API is temporarily unavailable, instead of showing outdated information without notice [3]. Limit data access by enforcing the principle of least privilege, allowing agents to see only the fields necessary for their tasks, while masking sensitive details by default [6].
Regular quality checks are also key. Conduct weekly QA audits by manually reviewing a sample of tickets to ensure the displayed account data matches the source records. This helps catch and address integration issues before they escalate [3].
Accurate data is the foundation for smart tools like AI-driven case summaries and intelligent routing, ensuring agents always have dependable insights at their fingertips.
Track How Much Tool Switching Has Dropped
Measuring the success of centralized account data doesn’t require overly complex metrics. Focus on straightforward indicators like Average Handle Time (AHT) and First Contact Resolution (FCR) to see if agents are getting the context they need upfront. Another useful metric is the number of internal comments or Slack messages per case – these tend to increase when agents have to dig for missing information [1][3].
Another key metric is context completeness, which measures the percentage of tickets with all necessary fields automatically filled. For example, reducing the time agents spend searching for information from 30% to 10% of their day can significantly boost overall capacity [1].
Compile these metrics into a simple KPI scorecard that’s reviewed monthly. Pair this with periodic agent surveys to uncover integration issues that numbers alone might not reveal [1].
Conclusion: Moving to Context-Driven, AI-Native Support
Centralizing account data requires a few key steps: auditing fragmented data, consolidating it into a single view, leveraging AI to surface relevant context instantly, and embedding that context into every case. Throughout this process, maintaining data quality and tracking improvements is critical.
Delays in accessing information can lead to noticeable productivity losses each week [1].
"If agents were spending 30% of their time hunting for information, and that drops to 10%, you’ve effectively increased your team’s capacity by 20% without adding headcount." – Tina Grubisa, Mosaic AI [1]
This boost in efficiency not only optimizes internal workflows but also improves customer satisfaction. For instance, when cybersecurity company Cynet adopted a centralized, AI-native support model, they saw their CSAT jump from 79 to 93 points and achieved a 47% ticket deflection rate at Tier 1. These results came from reducing their dependence on fragmented systems for routine information [1].
Supportbench builds on these strategies by combining case history, account context, Salesforce data, a knowledge base, and AI-powered summaries into a single, streamlined interface. This approach allows agents to work from one screen instead of juggling multiple tools, addressing inefficiencies and enabling more agile support operations. For B2B teams handling complex accounts and long-term issues, this clarity is key to providing consistent, high-quality support.
FAQs
Which account fields should agents see first?
Agents should focus on fields that offer a comprehensive view of the customer and account status to deliver quicker, more informed support. Here are the key areas to prioritize:
- Account identity details: Include the customer’s name, organization, and primary contacts to establish a clear profile.
- Account health and status: Track risk levels, recent issues, and support trends to gauge the overall condition of the account.
- Recent interactions: Access records of tickets, emails, calls, and chats to stay updated on the latest touchpoints.
- Key contacts and structure: Understand the organizational hierarchy and main contacts to streamline communication and manage escalations effectively.
How do we choose a single source of truth per field?
Start by conducting a thorough audit of your data. This helps pinpoint where each piece of information is stored and who is responsible for it. Once you have that clarity, create a unified data model with clear, standard definitions for each field.
Next, assign one system – whether it’s your CRM, billing platform, or support tool – as the go-to source for each specific field. To maintain consistency, set up governance policies that prevent conflicting information. This ensures your team always has access to accurate, reliable data from a single, trusted source.
How can we measure if tool-switching actually dropped?
To assess a reduction in tool-switching, dive into session data to spot trends like fewer retries, less repetitive looping, and more streamlined tool usage. Focus on metrics such as how often tools are called per session, the success rate of interactions, and a drop in unnecessary switching between tools. Comparing these numbers before and after implementing process changes can clearly highlight improvements. Incorporating structured behavioral analysis frameworks can further validate these findings.