
Support tickets are more than just user complaints – they’re a goldmine of insights into why users might struggle with your product. By analyzing recurring issues and patterns in these tickets, you can identify blockers that prevent users from fully adopting features. Here’s how to turn ticket data into actionable insights:
- Categorize tickets by feature and issue type (e.g., bugs, usability problems, or knowledge gaps). This helps direct the right problems to the right teams.
- Spot patterns and trends by grouping similar tickets. Recurring issues often highlight systemic problems, like confusing onboarding or missing documentation.
- Prioritize critical blockers using metrics like ticket volume, user sentiment, and business impact (e.g., revenue risk or churn probability). Focus on the issues causing the most frustration or affecting high-value accounts.
- Leverage AI tools for faster analysis. AI can automatically tag tickets, detect sentiment, and identify trends, saving time and ensuring no key insights are missed.
How to Analyze Support Tickets for Feature Adoption Blockers
Automate Support Ticket Analysis using ChatGPT
sbb-itb-e60d259
Why Support Tickets Help You Spot Feature Adoption Blockers
Usage analytics can tell you what users are doing, but they don’t explain why they’re doing it – or why they might be struggling. That’s where support tickets come in. They capture the raw frustration, confusion, and friction that analytics dashboards just can’t show.
"Support conversations provide immediate, unfiltered feedback and complement what behavioral analytics already suggest." – Carmen DeCouto, Director of Product Marketing, Amplitude [1]
The Hidden Value in Support Interactions
Support tickets are like a window into your users’ experiences. They highlight the real obstacles – whether it’s a technical bug, a missing feature, or an onboarding problem – that might be holding them back. Properly categorizing these tickets is key. If you only address the surface-level complaints, you risk missing the deeper issues causing them. By focusing on the root causes, you can uncover trends that help shape better long-term solutions.
"Support tickets can be thought of as a repository of customer issues that need to be addressed in your product development roadmap." – Typewise [2]
How Tickets Reveal Adoption Trends Over Time
The value of support tickets grows when you zoom out. While a single ticket might highlight an isolated issue, analyzing many tickets over time reveals patterns. For example, recurring complaints can indicate persistent blockers, while sudden spikes in tickets – especially from new users – might point to onboarding or documentation problems. These trends provide actionable insights, giving your team the tools to address systemic issues and improve feature adoption.
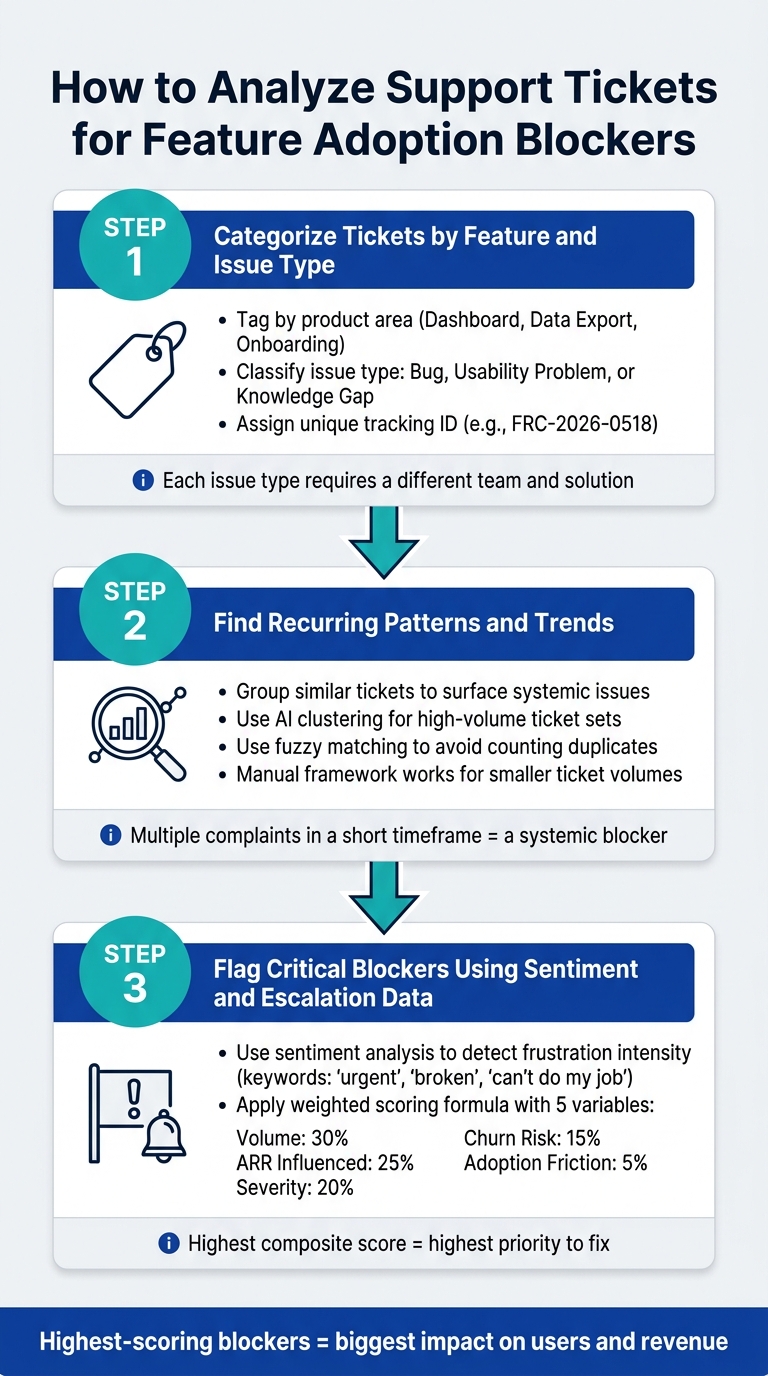
How to Analyze Support Tickets for Feature Blockers: A Step-by-Step Process
If you’re looking to remove obstacles that slow down feature adoption, this step-by-step process will help you analyze support tickets and uncover actionable insights. By following a structured approach, you’ll ensure no critical detail is missed.
Step 1: Categorize Tickets by Feature and Issue Type
Start by tagging each ticket based on its product area (e.g., Dashboard, Data Export, Onboarding) and the type of issue it represents – whether it’s a technical bug, usability challenge, or knowledge gap.
Why does this matter? Because each type of issue requires a different solution. A bug might need an engineering fix, a usability problem could call for a UI redesign, and a knowledge gap might be resolved with better in-app instructions or documentation. Without this categorization, you risk sending the wrong problem to the wrong team.
"This is gold. It’s real user pain, expressed in their own words. But it’s also unstructured noise until it’s processed." – Pathmode Playbook [4]
To keep things organized, assign each ticket a unique tracking ID (e.g., FRC-2026-0518). This ensures traceability from the initial complaint to its resolution [4].
Once categorized, group similar tickets to identify patterns and trends.
Step 2: Find Recurring Patterns and Trends
Look for recurring themes by grouping similar tickets. One complaint about a confusing export process might be an isolated incident, but multiple complaints over a short time frame signal a broader issue that needs attention.
If you’re dealing with a high volume of tickets, AI-driven clustering can help. AI tools can group tickets by themes, intent, and components, while also using fuzzy matching to consolidate near-duplicate entries. This ensures you’re counting distinct problems, not duplicates [2]. For teams with fewer tickets, a manual review using a consistent framework can work just as effectively.
A great example comes from Replit. In May 2026, Amol Jain, their Head of Product Engineering, used AI-powered feedback synthesis to streamline the process of collecting and prioritizing user complaints from multiple sources. The outcome? A clear, ranked list of top user issues – without the manual hassle. As Jain described it:
"In the past, it was so much work to pull data, look through each source, and manually combine them – the fact that AI Feedback just did it with a few clicks? That was fairly magical." – Amol Jain, Head of Product Engineering, Replit [1]
Once patterns are identified, it’s time to prioritize the most critical issues using sentiment and escalation data.
Step 3: Flag Critical Blockers Using Sentiment and Escalation Data
Not all issues are created equal. To focus on the most urgent blockers, you need to assess their impact and urgency.
Sentiment analysis can help by highlighting the intensity of user frustration. Tickets that use words like "urgent", "broken", or "can’t do my job" often indicate higher levels of pain. Combine this with escalation data – especially from high-value accounts or customers nearing renewal – and you’ll get a clearer sense of business risk.
To make prioritization objective, use a weighted scoring formula. Here’s a breakdown of the variables and their weights [2]:
| Variable | Weight | What It Captures |
|---|---|---|
| Volume | 30% | Number of unique tickets referencing the issue |
| ARR Influenced | 25% | Revenue tied to affected accounts |
| Severity | 20% | How badly the issue blocks feature use (rated 1–5) |
| Churn Risk | 15% | Accounts near renewal reporting the issue |
| Adoption Friction | 5% | Issues hindering new users from seeing value |
The blockers with the highest scores across these factors are the ones your team should tackle first. These aren’t just the most reported issues – they’re the ones with the biggest impact on your users and your business.
Common Mistakes in Ticket Analysis and How to Avoid Them
When analyzing ticket data, even small missteps can cloud your insights. Let’s look at some frequent mistakes and how to sidestep them.
Confusing severity with priority is a common error. Severity refers to the technical depth of an issue – like a system outage versus a minor bug – while priority includes business factors like customer value, renewal timing, and revenue risk. Alex Yumashev of Jitbit explains it well: "Priority describes how urgently it needs to be handled, which factors in severity plus business impact, customer tier, and deadlines." [6] For instance, a low-severity bug affecting a high-value account (e.g., $200,000 ARR at month-end) should still be treated as high priority. To avoid confusion, keep separate fields for severity and priority.
Over-relying on AI can also lead to problems. While AI excels at organizing and categorizing tickets at scale, it can misinterpret trends when it auto-generates new categories. To prevent this, lock AI tools to a stable taxonomy and funnel outliers into a "new theme" bucket for manual review. Additionally, always require human oversight for AI-created escalation summaries or tickets. [7]
Weak categorization is another pitfall. Using vague or generic tags makes it hard to spot specific feature issues. Ensure your tags are detailed and tied to particular features. Without this step, teams may focus on metrics like the number of tickets resolved rather than meaningful outcomes, such as improved feature adoption. This can create a false sense of progress. [3]
Analyzing tickets in isolation can strip away important context. For example, a minor usability complaint might hint at a larger issue when paired with customer history. To get the full picture, combine ticket data with CRM and product analytics to understand user behavior more comprehensively. [5][1]
"If your knowledge base is stale, AI QA will punish your best agents for following it." – Mark Sherwood, CX Strategist and Support Operations Leader [7]
Pay attention to "feature discovery" tickets – those moments when customers say, "I didn’t know you could do that." These aren’t just isolated comments; they often signal a gap in user awareness, not a technical limitation. Ignoring these insights could mean overlooking a retention risk. [3]
Using AI in Supportbench to Automate Ticket Analysis
Manually reviewing hundreds of support tickets can be both time-consuming and prone to mistakes. Supportbench’s built-in AI takes over these repetitive tasks, handling organization, scoring, and pattern detection. This allows your team to focus on extracting meaningful insights without getting bogged down in the details. It also complements the manual categorization process described earlier.
AI-Powered Auto-Tagging and Categorization
Supportbench leverages Natural Language Processing (NLP) and Machine Learning (ML) to scan incoming tickets and assign accurate tags. These tags are based on issue type, product features, and complexity level[9][10]. Unlike manual systems that rely on broad categories, Supportbench’s AI provides granular, feature-specific tagging. For example, a ticket about a reporting dashboard won’t just fall under a generic "UI issue" category but will be tagged specifically for that feature.
This automated triage system has a measurable impact: resolution times are reduced by 28%, and ticket management efficiency improves by up to 50%[8][16]. For more complex Level 2 (L2) and Level 3 (L3) issues, tickets are routed directly to senior agents or technical teams. Meanwhile, repetitive Level 1 (L1) queries are either resolved automatically or deflected, saving skilled agents for higher-priority tasks[10].
"Manual ticket sorting is a repetitively monotonous task… AI agents eliminate these outcomes and handle all the categorization processes in seconds, freeing your team to handle core tasks." – Plivo[10]
Sentiment Analysis and Predictive CSAT
Customer frustration often builds gradually, but Supportbench’s sentiment analysis catches these shifts in real time. By analyzing the tone and language in tickets, the AI identifies early signs of dissatisfaction[11]. This is especially helpful for detecting issues tied to specific product features. Using aspect-based sentiment analysis, the system links negative emotions to particular features, helping teams quickly address the root cause[12][13].
Supportbench goes a step further with Predictive CSAT and CES scores, which estimate customer satisfaction before surveys are even sent. This feature provides early warnings for potential satisfaction risks tied to specific feature interactions. By addressing these risks early, support teams can reduce escalations by up to 40%[11].
In addition to individual ticket analysis, Supportbench aggregates sentiment data to reveal broader trends, offering a more comprehensive view of customer experience.
Trend Detection and Case History Analysis
Spotting recurring issues across multiple tickets is no small feat. Supportbench simplifies this with KPI scorecards, which visualize escalation trends and group tickets by issue type. This makes it easier to determine whether a problem is isolated or a recurring feature blocker[14].
The AI Copilot further streamlines this process by generating instant summaries of case histories. Instead of combing through long ticket threads, managers receive concise, AI-generated overviews[14][15]. This speeds up the identification of features that consistently cause problems, enabling quicker resolutions.
| AI Feature | What It Does | Adoption Blocker Benefit |
|---|---|---|
| Auto-Tagging | Tags tickets by product feature and issue type | Identifies which features generate the most friction |
| Sentiment Analysis | Detects frustration and emotional intensity | Pinpoints features causing the highest user distress |
| Predictive CSAT/CES | Scores satisfaction before a survey is sent | Flags adoption failure and churn risk early |
| KPI Scorecards | Visualizes escalation and issue trends over time | Surfaces recurring feature-related patterns |
| AI Copilot | Summarizes case history and suggests resolutions | Speeds up analysis of complex, repeat technical issues |
Examples of Insights Drawn from Support Ticket Analysis
Support ticket analysis isn’t just about solving problems – it’s about uncovering opportunities for improvement. Let’s look at a few examples where companies turned ticket patterns into meaningful changes, boosting feature adoption and improving user experiences.
Atlassian discovered through their analysis of Confluence support tickets that users were struggling with certain areas of their knowledge base. By pinpointing these gaps, they refined their documentation and resources, which led to a 25% reduction in support ticket volume[9]. In this case, tickets acted as a guide, showing exactly where users were encountering confusion.
Shopify used clustering techniques to group tickets around common themes raised by merchants. This approach helped them create targeted self-service resources that resolved nearly 40% of merchant inquiries[9]. By identifying workflows that needed clearer documentation, Shopify empowered users to find answers independently.
At Replit, AI tools aggregated unstructured user feedback from multiple sources into a prioritized list of issues. Amol Jain, Head of Product Engineering, described the impact:
"The fact that AI Feedback was able to collect all of this, really analyze it, gather it, and turn it into a prioritized stack of problems that our users were complaining about."[1]
Tagging tickets by intent – such as confusion, bugs, or missing features – and by specific product areas can reveal patterns that are impossible to ignore. For instance, a spike in "I didn’t know you could do that" tickets signals a problem with feature discovery, often tied to onboarding rather than the product itself[2]. Insights like these can even lead to reshaping product roadmaps to better align with user needs.
These examples highlight how analyzing ticket data can transform reactive problem-solving into proactive product improvement, ultimately driving better feature adoption and user satisfaction.
Conclusion: Turning Ticket Data into Action
Support tickets are more than just tasks to complete – they’re a window into where your product might be falling short. Each repeated complaint, question rooted in confusion, or request for a workaround highlights a specific point in the user journey where things aren’t clicking.
The best way to address these issues is through an ongoing cycle: support teams flag the obstacles, product teams implement solutions, and over time, ticket volume for those problems decreases. As Carmen DeCouto, Director of Product Marketing at Amplitude, explains:
"Support doesn’t just resolve tactical problems; it can also reveal where the product strategy needs to evolve." [1]
This cycle, however, requires speed and efficiency. With ticket volumes rising, relying on manual analysis just won’t cut it. Tools powered by AI, like Supportbench, simplify the process by automating tagging, sentiment analysis, escalation alerts, and trend detection – helping teams identify churn risks before they escalate. For B2B companies looking for enterprise-level functionality at a reasonable cost, Supportbench offers solutions starting at just $32 per agent/month, ensuring scalability without breaking the bank.
The organizations that see the most success treat their support queues as a treasure trove of product insights. Take Atlassian, for example: they reduced support ticket volume by 25% by using ticket data to create a thorough, searchable knowledge base [9]. This kind of success doesn’t come from simply speeding up ticket resolutions – it stems from solving the root causes of user frustrations. It’s a proactive approach, as highlighted earlier.
To get started, begin with a manageable focus: pick a feature with a high volume of tickets, analyze the data, and pinpoint the root cause of the friction. The information is already there; the key is building a system that transforms those insights into meaningful action.
FAQs
Which ticket tags should we standardize first?
Using standardized ticket tags is a game-changer for handling recurring issues, customer objections, and product-related needs. These tags play a crucial role in spotting patterns, cutting through unnecessary clutter, and making trend analysis more effective.
Start by creating tags that focus on the most common problems, frequent objections, or popular feature requests. This approach simplifies ticket analysis and helps your support team work smarter, not harder. Plus, it sets the stage for smoother operations and better insights into customer needs.
How do we tie ticket themes to churn or revenue risk?
To link ticket themes to churn or revenue risks, start by examining recurring patterns and customer signals in support tickets. AI tools can help pinpoint frequent complaints or issues that suggest dissatisfaction. Group these themes by customer segments to better understand and prioritize risks tied to retention and revenue. Support ticket data often highlights early warning signs of dissatisfaction, giving you the chance to address feature blockers and take action to minimize churn.
What’s the minimum ticket volume needed to spot real trends?
A ticket volume that addresses 70–80% of recurring issues is typically sufficient to spot meaningful trends. Since most support tickets stem from a handful of common problems, this concentration makes it easier to identify patterns and carry out effective root cause analysis.