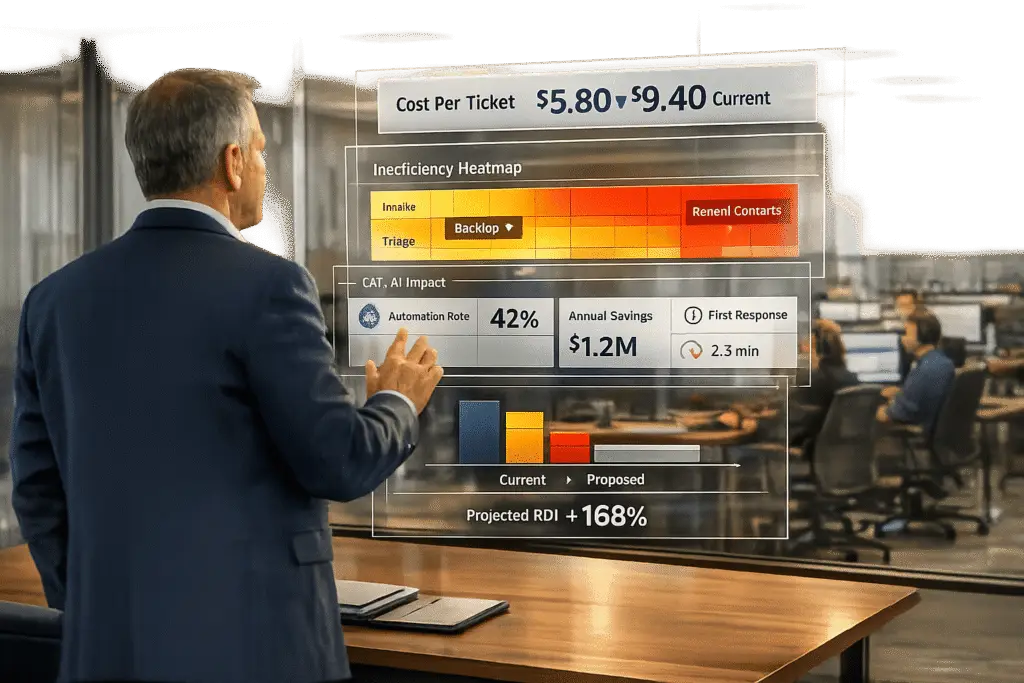
Switching your helpdesk system can save time, reduce costs, and improve customer satisfaction – if you build a solid case. By analyzing ticket data, you can identify inefficiencies, calculate costs, and demonstrate how AI-powered platforms can address these issues. Here’s how to make your case:
- Analyze ticket data: Look for patterns in resolution times, first-contact resolution rates, and misroutes to find inefficiencies.
- Calculate costs: Use metrics like cost per ticket to quantify the financial impact of inefficiencies.
- Compare to benchmarks: Measure your performance against industry standards to highlight gaps.
- Model ROI: Show how AI features like automation and smart triage can cut costs and improve efficiency.
- Present evidence: Use clear metrics, cost comparisons, and ROI projections to convince stakeholders.
For example, automating 70% of Tier 1 tickets at $1.50 per resolution (vs. $15 for human-handled tickets) can save over $250,000 annually for a mid-sized team. Focus on data-backed results and align your proposal with company goals to secure approval.
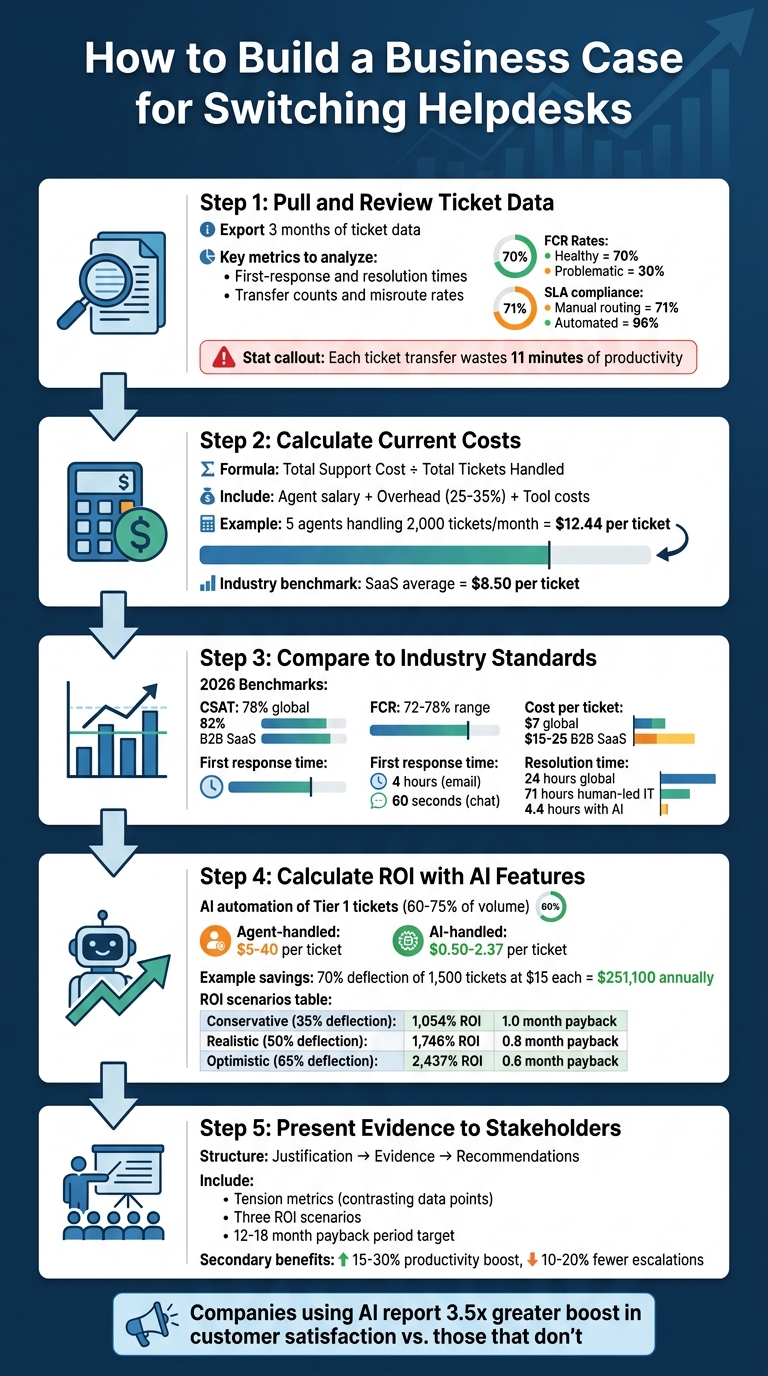
5-Step Process to Build a Data-Driven Business Case for Switching Helpdesks
Step 1: Pull and Review Ticket Data to Find Inefficiencies
Start by exporting one quarter’s worth of ticket data from your helpdesk. You don’t need years of data to spot patterns – three months is usually enough to uncover inefficiencies and quantify problem areas [4].
Focus on key data points that reveal where time and resources are being wasted. Look at ticket type and category hierarchies to identify recurring issues, first-response and resolution times to measure speed, and transfer counts and misroute rates to uncover routing problems [3][4]. Additionally, track metrics like first-contact resolution (FCR) rates, reopen rates, and SLA violation counts to assess the quality of support [2][4]. Remember, each ticket transfer eats up an average of 11 minutes of productivity across agents, and misrouted tickets can triple the likelihood of customer churn within 90 days [5].
Which Metrics to Review
Zero in on metrics that directly affect costs and customer satisfaction. First-response time reveals how quickly your team acknowledges new tickets. Long response times often point to a system that’s failing to prioritize incoming requests. Resolution time measures overall efficiency; if it’s too high, agents might be dealing with clunky interfaces or missing context. First-contact resolution rate is another critical indicator – a healthy rate hovers around 70%, but anything closer to 30% signals deeper issues [11].
Keep an eye on transfer and escalation rates. High transfer rates often mean poor routing or skill gaps, while frequent escalations suggest frontline agents lack the tools to resolve issues [10][11]. SLA compliance rates are another vital metric. Manual routing often achieves about 71% compliance, but automated systems can push this number above 96% [5]. Lastly, track your cost per ticket – the SaaS industry average is about $8.50, but inefficiencies can drive this cost significantly higher [5].
"The most common mistake I see in help desk operations isn’t a bad tool or an undertrained team but the absence of a shared definition of urgency. When ‘critical’ means something different to every agent, priority becomes whoever shouts loudest, and the queue reflects politics rather than risk."
- Radu Dumitrescu, Head of Presale & Digital Transformation, BlueTweak [2]
These metrics lay the groundwork for integrating AI tools to streamline and enhance your analysis.
How AI Tools Speed Up Data Analysis
Manually analyzing ticket data can take weeks and often misses critical patterns hidden in the details. AI-powered tools, on the other hand, use natural language processing (NLP) to analyze ticket content, capturing intent and sentiment [7]. They automatically group similar tickets – such as billing issues or login problems – into clusters, revealing trends instead of treating each ticket as an isolated case [8].
For example, in July 2025, Fundrise VP of IT Phillip Rickett introduced AI-driven ticket analysis, automating nearly 60% of IT support requests by synthesizing data from multiple sources to provide context-aware responses [9]. Similarly, Retool‘s IT Manager Charlie Verrey used an AI orchestration layer to manage the ticket lifecycle, cutting average SLA resolution times from two days to under one [9].
Modern AI tools can even analyze screenshots attached to tickets, identifying error messages and suggesting fixes without human help [9]. They also highlight knowledge gaps by comparing ticket volume against existing documentation, pinpointing exactly where your help center needs improvement [8].
Once these tools identify ticket clusters and trends, you can dive deeper to locate specific problem areas.
Finding Patterns and Problem Areas
Use the insights from your analysis to connect inefficiencies with their real costs. Look for recurring issues that drain resources. For instance, high reopen rates often mean agents are providing incomplete solutions, forcing customers to submit follow-up tickets. A growing ticket backlog, where new tickets outpace resolved ones, can signal staffing shortages or technical problems your platform isn’t handling well [10][11].
Investigate tickets with the longest mean time to resolution (MTTR) and review the reasons for delays. Delays could stem from vendor dependencies, missing information, inadequate tools, or poor routing [6][10]. Don’t overlook informal, undocumented requests – those off-the-record conversations that lead to duplicated work and lost context. As the saying goes, "If it isn’t in the ticket, it never happened" [3].
Leverage sentiment analysis and risk tags to identify high-stakes inefficiencies, such as security breaches or payment failures, that could jeopardize revenue or reputation [2]. Turning vague complaints into concrete data makes it easier to convince stakeholders that change is necessary.
sbb-itb-e60d259
Step 2: Calculate Current Costs from Ticket Metrics
After spotting inefficiencies in your ticket data, the next step is to translate those inefficiencies into concrete cost figures. Why? Because numbers speak louder than words, especially when convincing finance teams to approve a platform change. Showing the financial impact of inefficiencies builds a solid case.
How to Calculate Cost Per Ticket
Here’s the formula: Total Support Cost / Total Tickets Handled [12].
Your total support cost includes three main components: agent salary, overhead, and tool costs. Overhead typically accounts for benefits, office space, and management expenses, often estimated at 25-35% of the base salary [12]. Tool costs should reflect your monthly per-agent or suite subscription fees.
Let’s break it down with an example. Suppose you have a five-agent team with annual salaries of $45,000 each, plus 30% overhead, and each agent’s software costs $100 per month. This results in a monthly support cost of $4,975 per agent. Multiply that by five agents, and your total monthly support costs come to $24,875. If your team handles 2,000 tickets each month, your cost per ticket is $12.44 [12].
Now, compare your cost per ticket to your industry’s benchmark. For instance, if the average is $15.56 [12], and your costs are higher, you’ve identified inefficiency. These numbers provide a baseline for evaluating the broader financial impact.
Measuring the Financial Impact of Inefficiencies
Once you’ve calculated the cost per ticket, take it a step further by identifying additional losses caused by escalations and recurring issues. For example, how much time do senior engineers spend addressing tickets that should have been resolved at the first level? If a senior engineer with an $80,000 annual salary spends 4-6 hours weekly on escalations, that equates to an annual opportunity cost of $25,000 to $56,000 per engineer [13].
Recurring issues are another costly problem. When speed is prioritized over quality, unresolved issues resurface, forcing agents to re-handle tickets. To calculate this, multiply your cost per ticket by the number of recurrences. System failures add even more strain. Imagine an outage affecting 200 employees for two hours. With a fully-loaded cost of $50 per hour, that’s a $20,000 loss in productive capacity [13]. Over the course of a year, recurring major incidents in enterprise environments can lead to productivity losses of $960,000 to $1,440,000 [13].
"Support inefficiency does not generate a single cost. It generates a cascade of costs across the business system."
- Diego Cervera, Technical Lead [13]
Lastly, don’t forget to calculate revenue exposure from downtime. Lost productive revenue is a stark reminder that inefficiencies aren’t just operational nuisances – they’re financial risks. These figures make a strong argument for investing in a platform that can eliminate such inefficiencies.
Step 3: Compare Your Metrics to Industry Standards
Once you’ve calculated your current costs, the next step is to measure them against industry standards. This comparison helps you figure out whether your inefficiencies are just typical operational challenges or more serious issues that might justify switching platforms. Essentially, it turns raw data into a story that resonates with stakeholders.
Where to Find Industry Benchmarks
To get accurate benchmarks, rely on trusted sources that share up-to-date data. Reports like the Fixify IT Help Desk Benchmark Report, Converge Customer Support Benchmarks, and the Softabase Help Desk KPIs Guide offer comprehensive 2026 benchmarks across key metrics [14][15][16]. These resources provide breakdowns by industry, company size, and support channel, giving you relevant targets instead of generic averages.
Here are some key 2026 benchmarks to keep in mind:
- Customer Satisfaction (CSAT): The global average is 78%, but B2B SaaS companies generally achieve 82% [14][16].
- First Contact Resolution (FCR): Benchmarks vary between 72% and 78%, though SaaS companies average closer to 68% due to the complexity of technical issues [16].
- Cost per Ticket: This varies widely. The global average is $7, but B2B SaaS ranges from $15 to $25, while enterprise IT can climb to $20–$35 [16].
- First Response Time (FRT): Benchmarks are 4 hours for email, 60 seconds for live chat, and 30 seconds for phone [16].
Another critical metric is resolution time. Globally, the average is 24 hours, but human-led IT support has a median of 71 hours. With AI automation, that drops to just 4.4 hours – a massive improvement [15].
"Benchmarks are averages… Context matters more than raw numbers."
- Softabase Editorial Team [16]
It’s crucial to compare your results within the right context. For example, a healthcare organization with 35% productivity-blocking tickets might be operating within acceptable limits, but the same percentage for a cybersecurity firm would likely indicate a bigger problem [15]. Always align benchmarks with your industry, company size, and growth stage.
Finding Performance Gaps
With benchmark data in hand, you can now identify areas where your support operations are falling short. For example, if your cost per ticket is 20% higher than the industry standard – say, $30 compared to a $20 benchmark – that’s a clear sign of inefficiency [17].
First Response Time is another area to assess. High-performing teams (top 25%) achieve an FRT of 1.8 hours for email, while the industry median sits at 6.3 hours [16]. If your team is closer to the median, you might be missing opportunities to boost customer satisfaction. Similarly, if your self-service rate is below the global average of 25% – and far from the 40–60% target for more advanced help desks – you could be losing out on significant cost savings [14][16].
Pay close attention to productivity-blocking tickets, which prevent employees from working until resolved. These make up an average of 22% of all help desk tickets [15]. If your rate is higher, especially for hardware or connectivity issues (which tend to generate three times the negative sentiment), you’ve identified a key area for improvement [15].
To get a clearer picture, focus on median metrics rather than averages. A single ticket that drags on for 30 days can skew your average resolution time by 20–40% [16][18]. Another useful measure is your backlog ratio, calculated by dividing the number of open tickets by your average daily resolution volume. If this ratio exceeds 7.0, it signals major staffing or process issues [16].
These gaps aren’t just numbers – they’re the foundation of your business case. By showing where your key performance indicators fall short of industry standards and demonstrating how AI-driven platforms can address these challenges, you create a compelling, data-backed argument for stakeholders.
Step 4: Calculate ROI with AI-Native Helpdesk Features
Turn inefficiencies into measurable savings. This step demonstrates to stakeholders how an AI-native helpdesk can improve your bottom line with clear, data-backed projections. By addressing performance gaps, we can model the potential savings AI can deliver.
AI Features That Streamline Operations
AI-native platforms generate ROI by automating repetitive Tier 1 tasks and reducing the time agents spend on routine discovery work. Key features include:
- AI agents that autonomously handle repetitive Tier 1 queries.
- Agent copilots that summarize tickets and suggest replies.
- Smart triage and routing to classify tickets by intent and urgency.
- Knowledge AI that powers self-service portals.
For instance, Eneco achieved a 70% increase in customer inquiry resolutions without human intervention, thanks to AI automation[20]. Similarly, Desire2Learn saw a 30% boost in cases closed using AI-driven workflows[19].
Another major cost advantage comes from multilingual support. AI-powered real-time translation allows one team to handle global markets without hiring specialized language staff[22][23]. Additionally, tools like predictive First Contact Resolution (FCR) detection help measure whether issues are resolved on the first try – something that’s historically been hard to track[1].
Modeling Expected Improvements with Data
Start by using your baseline cost per ticket and analyzing 90 days of ticket data to categorize your volume by complexity. Tier 1 tickets, which are repetitive and well-documented, often make up 60–75% of total volume and are ideal for AI automation[21]. Industry benchmarks suggest:
- Order tracking and password resets can achieve 85–95% automation.
- Billing inquiries typically reach 60–75%[21].
Compare your current costs to those for AI-resolved tickets. While agent-handled support costs $5–$40 per interaction depending on complexity, AI-driven self-service costs between $0.50 and $2.37 per resolution[22][1]. For example, if you process 1,500 Tier 1 tickets monthly at $15 each (totaling $22,500), and AI deflects 70% of those tickets at $1.50 per resolution, the deflected portion costs just $1,575 – saving approximately $251,100 annually.
AI also improves efficiency for tickets that still require human input. By providing agents with ticket context, AI can save 3–5 minutes of discovery time per ticket. If agents handle 500 tickets monthly and save 4 minutes per ticket, that’s 33 hours reclaimed – worth around $1,650 at $50 per hour.
Presenting ROI to Stakeholders
Build credibility by presenting three scenarios: Conservative (35% deflection), Realistic (50% deflection), and Optimistic (65% deflection). Use slightly reduced deflection rates (e.g., 80% of the calculated rate) to account for real-world adoption challenges[1].
For a mid-market company with $600,000 in annual support costs and a $24 cost per ticket, here’s how the ROI breaks down:
| Scenario | Deflection Rate | Annual Savings | Total Investment | ROI | Payback Period |
|---|---|---|---|---|---|
| Conservative | 35% | $724,500 | $68,700 | 1,054% | 1.0 month |
| Realistic | 50% | $1,035,000 | $68,700 | 1,746% | 0.8 month |
| Optimistic | 65% | $1,345,500 | $68,700 | 2,437% | 0.6 month |
The total investment includes platform licensing ($24,000–$48,000 annually), initial content development (80–120 hours at $50 per hour), and setup support ($10,000)[1][21]. Many mid-market companies recover their investment within 7–9 months with a deflection rate of 40–60%[1].
Using the ROI formula – (Annual Deflection Savings + Efficiency Gains – Annual Costs) / Annual Costs × 100 – the realistic scenario delivers an ROI of roughly 1,746%.
When presenting your case, highlight that AI chatbot deployments can recoup their cost in just 30–60 days by reducing agent workloads[21]. Companies using AI report a 3.5x greater boost in customer satisfaction rates compared to those that don’t[20].
"Cost decreases when waste is removed at the start, speed improves in the middle, and control is maintained at the end." – Radu Dumitrescu, Head of Presale & Digital Transformation, BlueTweak[23]
To ensure deflection leads to true resolution – not just ticket avoidance – track performance metrics like First Contact Resolution (FCR) and CSAT. Aim for FCR rates of 75% or higher on AI-resolved tickets[21]. Start small by automating the top three high-volume Tier 1 categories on chat, capturing 30–40% of the volume, before expanding to email and voice channels[21].
Step 5: Present Your Evidence to Stakeholders
When presenting your case to decision-makers, structure your evidence in a way that directly addresses their priorities. A solid presentation typically includes three key phases: Justification, Evidence, and Recommendations [4]. This approach walks stakeholders through the problem, builds a logical case for change, and concludes with actionable solutions. By the end, your audience should clearly see the ROI potential and the steps needed to achieve it.
Start by defining clear objectives that align with your company’s broader goals. Research from Info-Tech Research Group shows that 36% of organizations currently focus on improving ticket handling in IT, while 12% prioritize service desk enhancements [4]. Frame your proposal around one of three main objectives: improving customer service, enhancing operational efficiency, or reducing recurring issues. This alignment ensures your presentation resonates with stakeholders’ strategic concerns.
How to Structure Your Presentation
Your presentation should tell a cohesive story. A four-section framework works well to guide stakeholders through your analysis:
| Presentation Section | Key Content to Include | Stakeholder Value |
|---|---|---|
| Justification | Highlight challenges like missing data, outdated tools, or high costs | Establishes urgency for change |
| Key Observations | Share metrics such as ticket trends, resolution times, and SLA breaches | Offers data-driven insights into the current state |
| ROI Projections | Show potential cost reductions and customer satisfaction gains | Demonstrates financial and operational benefits |
| Recommendations | Outline proposed features (e.g., AI, automation) and timelines | Provides a clear path forward |
Make sure to emphasize "tension metrics" – contrasting data points that reveal underlying problems. For instance, if resolution times are fast but reopen rates are high, it suggests tickets are being closed without proper resolution. This kind of analysis gives stakeholders a balanced view of the service desk’s performance [4].
Additionally, address any concerns about data accuracy. Be upfront about gaps or inconsistencies in your current system and explain how the proposed solution will improve data quality and enforce better ticket management practices.
Calculating ROI and Highlighting Savings
Use a straightforward ROI formula to present potential savings: (Tickets Deflected × Cost Per Human Ticket) – Total AI Cost [24]. Ensure you include the fully loaded cost per ticket, factoring in expenses like benefits, taxes, tools, management, training, and facilities [24].
Don’t stop at primary savings. Highlight secondary benefits, such as:
- A 15–30% boost in agent productivity for remaining tickets
- A 10–20% reduction in escalation rates
- Lower agent attrition costs, which can range from $4,000 to $12,000 per replacement [24]
These additional savings often sway undecided stakeholders.
To build confidence, present three scenarios – Conservative, Realistic, and Optimistic – showing you’ve accounted for potential implementation challenges. Aim for a 12–18 month payback period for organizations handling over 2,000 monthly tickets [24]. As Twig advises:
"If the ROI is below 50% in Year 1, push back on pricing or scope. If payback is beyond 12 months, you are either paying too much or your volume is too low" [24].
Handling Stakeholder Questions
Be ready to address common concerns, such as implementation risks or cost transparency. For example, explain how automation can free up staff for more strategic tasks, countering concerns about time constraints [4]. If stakeholders worry about AI impacting customer satisfaction, share data showing projected CSAT changes (from -2% to +5%) and improvements in First Response Time (from 4–12 hours to under 60 seconds) [24].
Cost concerns are another sticking point. Use your Cost Per Ticket analysis to highlight the hidden costs of maintaining an inefficient system [24]. If stakeholders doubt your deflection rates, explain how you tagged the last 1,000 tickets by complexity to calculate a guaranteed baseline for AI deflection [24].
Misclassified resolutions can also raise red flags. Reassure stakeholders by showing how the new system will monitor resolution quality to prevent tickets from being prematurely closed. Metrics like a First Contact Resolution (FCR) rate of 75% or higher demonstrate that AI-resolved tickets truly solve issues.
For implementation risks, present a clear timeline and show that analyzing just one business cycle (about three months) of data is typically enough to build a compelling case [4]. A pre-purchase checklist that includes monthly ticket volume, fully loaded costs, and projected ROI can further ease concerns [24].
"Ticket data won’t give you a silver bullet, but it can help point you in the right direction." – Info-Tech Research Group [4]
Finally, be prepared to discuss pricing models. Explain the benefits of usage-based pricing (around $5 per ticket), which scales with actual deflection rates, versus flat-rate contracts. For example, a $95,000/year flat-rate contract requires about 1,900 tickets per month just to break even compared to usage-based pricing [24]. This level of detail can help stakeholders see the financial logic behind your proposal.
Common Mistakes and How to Avoid Them
A business case can quickly unravel if you miss essential details like data accuracy, gaps in implementation planning, or failing to tie your proposal to company priorities. Steering clear of these missteps increases the chances your proposal not only gets approved but also delivers results.
Not Validating Your Data
One of the quickest ways to undermine your business case is by relying on poor-quality data. For example, when technicians neglect to properly update or close tickets, you’re left with “dirty” data that doesn’t reflect actual performance. Stakeholders will spot this quickly, and it can tank your credibility. To avoid this, standardize ticket-handling processes and ensure everyone uses consistent fields and categories.
Another common issue is ignoring "shadow" intake channels like emails, Slack messages, or walk-ups. These untracked requests can skew workload calculations, leading to underestimations. Similarly, ineffective categorization – whether it’s overly broad (e.g., "Other") or overly detailed (with dozens of micro-categories) – can muddy your analysis. Conduct a workflow audit to capture all support requests and refine categories to better reflect actual workloads. If you’re estimating AI deflection, tag a sample of 1,000 tickets by complexity – Simple, Moderate, and Complex. The “Simple” group provides a realistic baseline for automation.
"Automation rate alone is a vanity metric. What matters is the net financial impact after you account for the cost of the AI tool itself, the implementation effort, the ongoing maintenance, and the quality tradeoff on customer satisfaction" – Twig [25]
Don’t forget to include human costs in your calculations. The average cost per human-handled ticket ranges from $15 to $25, but only when you account for fully loaded costs like benefits (25–35% of salary), tooling ($1,200–$3,600 annually), and management overhead (10–15%) [25]. Skipping these details can make your current system seem cheaper than it is, which diminishes the projected ROI of switching platforms.
Validating your data is the foundation for the next step: planning a smooth transition.
Not Planning for Change Management
Even with accurate data, a poorly executed transition can derail your efforts. A clear, actionable plan is key. Lay out an implementation timeline that includes onboarding, training, and a pilot phase. Without this, you risk low adoption, frustrated employees, and a system that fails to deliver its expected value.
One way to mitigate these risks is by running a 30-day pilot on a subset of traffic. This allows you to test vendor claims and measure resolution quality before making a full commitment. It also gives your team time to adjust workflows and address any gaps in documentation or knowledge base content.
Make sure to budget for training. Onboarding and training costs typically range from $2,000 to $5,000 per agent annually [25]. If you don’t factor these in from the start, stakeholders may view the project as over budget once implementation begins. Including these costs in your proposal upfront helps avoid unpleasant surprises.
Not Connecting to Company Goals
Beyond the numbers, your business case needs to align with the company’s broader objectives. Stakeholders want to see how operational metrics translate into unit economics, like cost per ticket or cost per resolved incident [26]. If your proposal doesn’t tie into priorities like reducing costs, improving customer retention, or driving revenue, it risks being seen as a budget drain rather than a strategic investment.
Use business-focused language to frame your updates. For instance, instead of saying, “We resolved 10% more tickets this quarter,” explain the financial impact: “We reduced handle time by 8%, but cost per ticket rose 6% due to contractor usage” [26]. This approach shows you’re managing support as a business function, not just a technical one.
"In inflationary periods, the best helpdesk dashboards do not just show ‘what happened.’ They show ‘what will become unaffordable if nothing changes.’ That forward-looking framing is what gets budget owners to act" – Jordan Blake, Senior SEO Content Strategist [26]
For every proposed change, present a low-cost option, a moderate-cost option, and a ‘do-nothing risk’ to highlight the cost of inaction. This helps stakeholders understand that sticking with the status quo often has a higher price tag than upgrading. Tie your proposal to macroeconomic factors like inflation, rising vendor fees, or increasing labor costs to illustrate how a modern, AI-driven helpdesk can address these challenges.
Conclusion: Building a Data-Driven Case for Helpdesk Modernization
Making a strong case for upgrading your helpdesk requires more than just a good idea – it demands solid evidence of financial impact. By diving into your ticket data, calculating fully loaded costs, comparing benchmarks, and projecting the benefits of AI-powered tools, you turn a simple suggestion into a compelling argument for investment.
The numbers speak for themselves. For businesses managing over 2,000 tickets each month, adopting modern solutions often results in measurable improvements: lower costs per ticket, faster response times, and a payback period of just 12–18 months. Beyond that, support teams typically see a 10%–20% drop in escalation rates, a 15%–30% boost in agent productivity, and reduced turnover costs, saving anywhere from $4,000 to $12,000 per agent. These results make a strong case for exploring AI-native helpdesk platforms.
Supportbench stands out by offering AI-driven features as part of its core package – no hidden fees or gated add-ons. With tools like AI-powered ticket summaries, agent copilots, automated knowledge base creation, and predictive CSAT scoring, Supportbench provides enterprise-level capabilities at a competitive price. Starting at $32 per agent per month, every customer gets access to these advanced tools along with live support.
The next steps are straightforward: validate your data, align outcomes with your company’s goals, and present the clear ROI of modernization. By anchoring your decisions in ticket data and measurable outcomes, you ensure that your support operations not only keep pace with change but also deliver tangible benefits.
FAQs
Which ticket metrics matter most for proving our helpdesk is slowing us down?
Certain metrics can shine a light on where your helpdesk might be slowing things down. For instance, resolution time points to delays that could be affecting customer satisfaction. Similarly, tracking the ratio of support tickets opened vs. solved helps you identify if unresolved issues are piling up.
Speaking of backlogs, the ticket backlog metric directly shows how many unresolved tickets are stacking up over time. Another critical measure is average handle time (AHT), which calculates how long agents spend resolving individual issues. Together, these metrics paint a clear picture of potential inefficiencies in your support system.
How do I calculate our fully loaded cost per ticket from payroll and tools?
To figure out your fully loaded cost per ticket, start by summing up all your support-related expenses. This includes things like agent salaries, overhead, and the costs of any tools you’re using. Then, divide that total by the number of tickets your team handles.
Here’s a breakdown of what to include:
- Agent salaries: In the U.S., base pay typically falls between $42,000 and $55,000 annually.
- Benefits and overhead: These usually add another 25-35% on top of the salary.
- Tool costs: Calculate the monthly cost of tools per agent.
Once you’ve got the total monthly support cost, divide it by the number of tickets handled that month. That’ll give you your cost per ticket.
How can I estimate realistic AI deflection rates from our past tickets?
To get a clear picture of realistic AI deflection rates, start by reviewing 3-6 months of historical support ticket data. Look for patterns in common request types, such as password resets or order tracking inquiries. Next, calculate your current deflection rate using this formula: self-service resolutions ÷ total support attempts. Once you have this figure, compare it to industry benchmarks, which typically fall between 30% and 70% for AI-driven solutions. This analysis will help you estimate how much AI can improve deflection rates, considering the complexity of your specific support requirements.