If you’re managing a B2B customer support team, planning staffing levels with incomplete or messy data can feel impossible. But here’s the truth: you don’t need perfect data to create a reliable capacity model. By using proxies, historical trends, and AI-powered tools, you can make informed decisions to avoid understaffing (which causes burnout) or overstaffing (which wastes budget).
Here’s a quick breakdown of how to approach this:
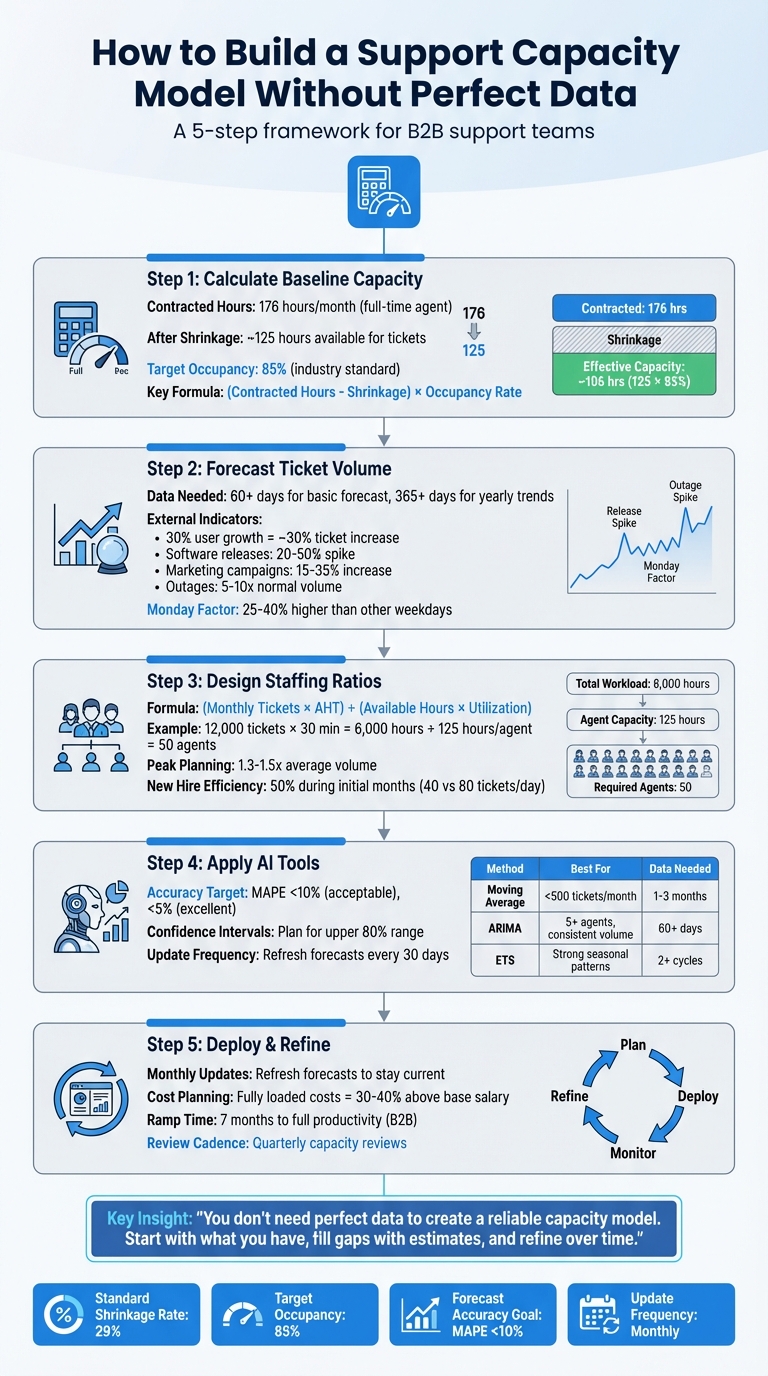
- Calculate Baseline Capacity: Factor in team hours, shrinkage (time unavailable for tickets), and occupancy (time spent actively resolving tickets).
- Forecast Demand: Analyze ticket trends, use external indicators (e.g., user growth), and account for seasonality or spikes (like product launches or outages).
- Design Staffing Ratios: Determine the number of agents required based on ticket volume and complexity. Plan for supervisor roles and adjust for peak times.
- Leverage AI Tools: Use AI to refine forecasts, identify patterns, and improve accuracy, even with limited data.
- Avoid Common Mistakes: Keep forecasts updated, avoid relying solely on spreadsheets, and separate backlog from new ticket demand.
The key is starting with what you have, filling gaps with estimates, and refining over time. This process helps you make smarter hiring and resource decisions while maintaining service levels.
5-Step Framework for Building a Support Capacity Model Without Perfect Data
What Is Support Capacity Modeling and Why It Matters
What a Support Capacity Model Does
A support capacity model helps you figure out how much work your team can handle while still meeting SLA commitments [5]. Essentially, it bridges the gap between ideal staffing levels and daily operations [5].
This model tackles three key questions: Are you understaffed? (which can lead to burnout and SLA violations), Are you overstaffed? (wasting resources), or Are you staffed just right? [1]. It also takes into account critical factors like shrinkage – the time agents are unavailable for tickets due to meetings, breaks, training, or vacation [5] – and occupancy, which measures how much time agents spend actively working on tickets versus waiting for new ones [3]. For B2B teams, the model also includes considerations like product complexity, specialized skill sets, and tiered support levels and escalation paths that influence how work flows through the team [2].
However, creating this model isn’t straightforward, especially when dealing with incomplete or messy data.
Why Perfect Data Is Rare in B2B Support
In B2B support, clean and complete data is almost impossible to find. Ticket data might be in one system, customer details in a CRM, and time-off information in a separate HR tool [1][4]. Pulling all this fragmented data together is a tedious process, and even then, it’s rarely perfect.
Adding to the challenge, human variability and unpredictable factors – like outages or complicated release cycles – make it hard to rely on historical data for accurate forecasting [1][5]. This is why so many workforce management teams still depend on spreadsheets and gut instincts for staffing decisions – they simply don’t have access to the "perfect" data they need [1].
Because of this, support leaders often have to rely on estimates and proxies to make decisions, which introduces its own set of challenges.
What Happens When Capacity Planning Fails
When capacity planning goes wrong, the fallout is immediate. Understaffing can lead to SLA breaches, longer wait times, and overworked agents stuck at unsustainable occupancy levels [1]. Matt Dale, a CX Consultant at Moxie CX, explains it well:
"Being understaffed by one or two agents meant burnout for the rest of the team because we couldn’t pull folks out of the queue to go through a typical hiring/onboarding process." [6]
On the flip side, overstaffing drains your budget, leaving agents idle when ticket costs can range anywhere from $5 to $60 each [1]. Mismanaged capacity planning can also create disconnects between departments like Finance, Sales, and Support, leading to missed revenue goals and unjustifiable headcount increases [7]. Without a proper model, hiring becomes a reactive process – only happening when the team is already overwhelmed. And since onboarding in B2B environments can take months, the problem lingers long after the hiring process begins [5].
A solid capacity model not only avoids these pitfalls but also opens the door to smarter, more strategic staffing decisions.
sbb-itb-e60d259
Step 1: Calculate Your Team’s Baseline Capacity
How to Calculate Available Team Hours
To establish a realistic baseline for your team’s capacity, you’ll need to factor in contracted hours, shrinkage, and occupancy. Start by looking at the total contracted hours for your team members. For a full-time agent, this is typically 40 hours per week or 176 hours per month. However, don’t confuse these numbers with the actual time available for handling tickets. Shrinkage will significantly reduce this figure.
Shrinkage refers to the time agents are paid but not actively handling tickets. It falls into two main categories: external shrinkage (like vacation, sick leave, or bereavement) and internal shrinkage (such as meetings, training, one-on-one sessions, professional development, and scheduled breaks). After accounting for shrinkage, you’ll find that out of the standard 176 hours in a work month, only about 125 hours are typically available for ticket-handling.
But even with shrinkage accounted for, you shouldn’t aim for 100% occupancy. Occupancy measures the percentage of available time that agents spend actively resolving tickets. The industry standard is around 85% [2][5]. Pushing beyond this level can lead to burnout and leave no room for the natural pauses between tasks. Charlotte Ward, Director of Support at Snowplow, highlights the risks:
"A poorly scaled team is unsustainable: individuals suffer from boredom or burnout. Under or over staffing are each a commercial risk to your organization, and both also deliver a poor customer experience in the long term." [2]
To calculate effective capacity, subtract shrinkage from contracted hours and then multiply by your occupancy rate (e.g., 85%). This gives you a clearer picture of the actual time your team can dedicate to resolving tickets. From there, adjust for factors like ticket complexity and context switching to refine your estimates even further.
Factor in Ticket Complexity and Context Switching
Ticket complexity can vary significantly, especially in B2B support. A simple password reset might take just five minutes, while a complicated multi-product integration could take hours. If you don’t have detailed data on ticket difficulty, use Average Handle Time (AHT) as a rough indicator. For example, if your target handle time is 30 minutes, you can estimate an agent’s monthly capacity by dividing their productive hours by this AHT [2].
Keep in mind that agents often juggle different types of tasks, from technical troubleshooting to administrative duties. This "switching cost" can increase AHT and should be accounted for in your calculations. Tracey Virtue, Chief Customer Success Officer at NEOGOV, underscores the importance of aligning metrics with company values:
"The factors you consider in your forecasting model need to reflect your company’s core values. For example, if customer-centricity is a core value, your Average Handle Time (AHT) needs to factor in time for nurturing relationships." [2]
Additionally, the support channel plays a role in capacity. Email typically involves handling one ticket at a time, while chat allows agents to manage multiple conversations simultaneously. This concurrency – where agents handle 2–3 chats at once [5] – can boost capacity but also adds mental strain. For phone support, lower occupancy rates are advisable to ensure agents have time to document calls properly after they end.
Fill Data Gaps with Proxies and Estimates
If you’re missing historical data, you can rely on proxies to fill in the gaps. For instance, if you don’t have detailed handling times, use the team’s average daily ticket resolution as a proxy. Say your team resolves 200 tickets per day with five agents – that’s roughly 40 tickets per agent, which aligns with common industry benchmarks [8].
For shrinkage, if precise tracking isn’t possible, apply a standard rate of 29% [5]. This serves as a starting point until you can refine your calculations with more detailed data.
When forecasting capacity for new hires, it’s wise to use a 50% efficiency proxy during their initial months [9]. For example, if an experienced agent resolves 80 tickets per day, a new hire might only handle 40. This approach helps avoid overly optimistic projections and ensures your team isn’t overwhelmed if onboarding takes longer than expected.
Step 2: Forecast Ticket Volume and Demand
Extract Patterns from Limited Historical Data
To uncover true customer demand, separate new requests, backlog, and reopened tickets [10]. If you rely solely on total tickets handled, you’re essentially measuring operational bottlenecks instead of genuine customer needs.
With 60+ days of data, you can perform a basic time-series forecast. If you have 365+ days, you’ll be able to identify yearly trends [1]. For datasets with fewer than 30 data points, stick to a simple moving average – it’s more reliable than complex models in such cases [1]. Seasonal decomposition is a useful technique to break data into trends, cycles, and random noise, helping you spot patterns that might not be obvious in spreadsheets [1].
Different communication channels often show distinct patterns. For example, chat volumes tend to surge during business hours, while email tickets accumulate overnight [1]. If your team handles fewer than 10 tickets daily, your data might be too sparse for accurate forecasting – consider using external benchmarks instead [1]. Always base your demand analysis on fixed events like created_at timestamps, as mutable fields (like ticket status) can change over time and skew results [10].
When internal data is insufficient, external indicators can help fill in the gaps.
Use External Indicators to Predict Demand
If your internal data doesn’t provide a clear picture, external signals can guide your forecasting efforts. For instance, a 30% increase in your user base often leads to a similar rise in ticket volume [11]. Look to your sales pipeline and customer growth predictions as early indicators of demand. Align ticket trends with major events like marketing campaigns or software updates to distinguish between organic growth and event-driven spikes [11].
Software releases can drive ticket spikes of 20%-50%, while marketing campaigns may lead to a 15%-35% increase in inquiries [11]. Service outages, on the other hand, can create ticket surges that are 5 to 10 times above normal levels [11]. Track these operational events – like outages, pricing changes, or policy updates – since they’re reliable predictors of ticket volume even when exact numbers are unavailable [11].
Be sure to tag one-off incidents separately so they don’t distort your baseline forecasts. While this data is valuable for incident planning, it shouldn’t be included in average demand calculations [11]. For long-term planning, focus on forecasting 6 to 12 months ahead. For short-term scheduling, stick to a 4-to-6-week window [11].
Adjust for Customer Segments and Seasonal Patterns
Ticket volume tends to spike on Mondays, often 25%-40% higher than other weekdays [11]. To account for these variations, apply weekday-specific multipliers – like 1.4x for Mondays – when using simple moving averages [11]. Additionally, forecast separately for different channels, as chat and email tickets often follow distinct seasonal trends [1].
If you have less than a year of historical data, combine a three-month moving average with customer growth projections to estimate demand [11]. For Q4 planning with limited data, use a "holiday jump" method: compare a stable month like September to a peak month like December from the previous year, then apply that ratio to current volumes [9]. This approach helps you estimate demand even without full seasonal cycles.
When planning staffing, aim for the upper range of the 80% confidence band to cover most scenarios without overstaffing [1]. A Mean Absolute Percentage Error (MAPE) under 10% is acceptable for support data, while under 5% is considered excellent [1]. Charlotte Ward, Director of Support at Snowplow, highlights the importance of structured forecasting:
"Whatever data you apply and how you choose to apply it – if you don’t have a forecasting model, then you’re shooting from the hip when it comes to scaling your team." [2]
Step 3: Design Team Structure and Staffing Ratios
Calculate Frontline Agent Requirements
Once you’ve estimated your ticket volume, you can determine staffing needs using this formula:
(Monthly Tickets × Average Handle Time) ÷ (Available Hours per Agent × Utilization Rate) [8].
Here’s an example: if you anticipate handling 12,000 tickets per month, and the average handle time is 30 minutes, that’s 6,000 hours of customer-handling time. If each agent provides about 125 productive hours per month, you’d need approximately 50 agents to meet demand. To avoid SLA breaches during peak times, plan for realistic spikes – typically 1.3 to 1.5 times your average ticket volume – without overstaffing [8].
Once you’ve nailed down your frontline staffing needs, it’s time to set up supervisory roles for proper support and management.
Set Supervisor and QA Ratios
Supervisors play a key role in managing internal shrinkage activities like coaching sessions, team meetings, and training. For B2B teams dealing with complex products, you’ll want lower supervisor-to-agent ratios to ensure effective support and smooth escalation processes [2]. Additionally, don’t forget to budget separately for management, training, and hiring costs outside of frontline headcount.
If you’re managing a large, global team across multiple time zones and languages, a dedicated workforce management team can help you monitor capacity daily [5]. Once you’ve determined your baseline ratios, adjust roles to match demand fluctuations as they arise.
Build Flexibility into Team Roles
Instead of spreading coverage evenly, align shifts with actual demand patterns. For example, if Mondays consistently see a 40% increase in ticket volume, you can reassign agents from less busy days, like Fridays, to cover the surge [1]. When scaling up quickly, outsourcing partners might be a faster solution than internal hiring, especially for teams operating across multiple time zones [2].
For seasonal peaks, start hiring in October and aim to have new agents onboarded by November 1 to handle December’s increased demand [9]. Keep in mind that new agents typically resolve about 40 tickets per day, compared to 80 tickets for more experienced team members [9]. Regional differences also matter – European employees, for instance, often have more vacation time than their North American counterparts, which can affect shrinkage rates [5].
Lastly, revisit your capacity model monthly to account for evolving products and shifting historical patterns [1].
Capacity Planning for CS Teams: Building Scalable Models That Work | Webinar 22
Step 4: Apply AI to Improve Forecasting Accuracy
Once you’ve established capacity estimates and demand forecasts, AI tools can take your staffing model to the next level by refining predictions and uncovering hidden insights.
Use AI to Find Patterns in Incomplete Data
AI is particularly good at identifying trends and patterns in datasets that might be incomplete or inconsistent. Tools like ARIMA and ETS algorithms excel at detecting trends, even when the data isn’t perfect [1][4]. They can break down seasonal data into components like trends, cycles, and noise, offering a clearer picture of demand [1].
One of AI’s strengths is its ability to separate genuine customer demand from operational noise, ensuring your forecasts are based on actionable data [10]. If you’re using modern spreadsheet tools, functions like FORECAST.ETS can automatically identify seasonal trends in your historical data, simplifying the process [4].
AI-Powered Demand Forecasting
AI doesn’t just give you a single forecast number – it provides confidence intervals, usually in the 80% or 95% range. These intervals help you prepare for realistic worst-case scenarios [1]. For staffing, it’s smart to base capacity on the upper limit of the 80% confidence interval. This ensures you’re prepared for most situations without overstaffing unnecessarily [1]. AI models with a MAPE (Mean Absolute Percentage Error) under 10% offer reliable guidance for balancing resources [1].
To get started, export your helpdesk data as a CSV file and use free AI tools to run forecasts [1]. For accurate predictions, AI models need at least 60 daily data points (roughly two months of data). However, having a full year of data is ideal for capturing seasonal trends [1]. As customer behaviors and product offerings change, it’s a good idea to refresh your forecasts every 30 days to stay aligned with evolving demand patterns [1][11].
Estimate Ticket Effort and Plan Scenarios with AI
AI can also classify support tickets by complexity and estimate resolution times, helping you prepare for different demand scenarios. To avoid inflating staffing needs, be sure to separate new ticket demand from backlog and reopened tickets [10]. For predictable events like product launches (which can increase demand by 20% to 50%) or marketing campaigns (which typically boost demand by 15% to 35%), you can use a four-week moving average combined with manual adjustments [11].
It’s also helpful to tag one-off incidents, such as outages or crises, in your helpdesk system. This prevents these anomalies from skewing your baseline demand models and ensures your regular staffing calculations remain accurate [10][11].
| Forecasting Method | Best Use Case | Data Requirement |
|---|---|---|
| Moving Average | Small teams (<500 tickets/month) | 1–3 months |
| ARIMA | Teams with 5+ agents and consistent volume | 60+ days (1 year preferred) [1] |
| ETS (Exponential Triple Smoothing) | Data with strong seasonal patterns | 2+ cycles of data [4] |
| Erlang Model | Complex call centers with specific SLA targets | Historical AHT and query rates [2] |
Mistakes to Avoid When Building Capacity Models
When creating a capacity model, it’s easy to fall into traps that can derail your efforts. One of the most common missteps is relying too heavily on manual spreadsheets, which can introduce errors and blind spots that better forecasting tools would avoid. Below are some frequent mistakes in capacity planning – and how to steer clear of them.
Why Spreadsheets Aren’t Enough for Complex Modeling
Manual spreadsheets might work in simple, low-volume scenarios, but they quickly become a liability as ticket volumes grow. They’re prone to errors and can overlook critical trends like seasonality. For example, relying on simple averages often misses these patterns, leading to inaccurate forecasts. Worse, using "tickets handled" as the primary metric focuses on clearing backlogs rather than addressing new customer inquiries, which can lead to inflated staffing plans [10].
Spreadsheets also fall short when calculations grow more intricate. For instance, they often fail to account for shrinkage – the time lost to breaks, vacations, meetings, and training – or to reflect realistic occupancy rates. In customer support, an occupancy rate of around 85% is standard, not 100% [2]. Ignoring these factors can leave your model underestimating staffing needs right from the start.
Beyond calculation errors, spreadsheets are also vulnerable to poor data integrity, which further undermines their reliability.
Tackle Data Quality Issues Early
Bad data can throw off your entire forecast and make it hard to identify the real drivers behind ticket volume. For instance, mixing reopened tickets and backlog carryovers with new inquiries can obscure whether spikes are caused by product issues, unclear policies, or broken workflows [10].
A better approach is to define demand using immutable events like created_at timestamps. Avoid relying on mutable fields like status names or agent-entered tags, as these can change over time [10]. Creating a "demand integrity" table can help separate backlog resolutions from new tickets and highlight trends like reopen rates. Additionally, documenting assumptions on dashboards ensures stakeholders can interpret the data accurately.
"Whatever data you apply and how you choose to apply it – if you don’t have a forecasting model, then you’re shooting from the hip when it comes to scaling your team." – Charlotte Ward, Director of Support, Snowplow [2]
Once you’ve addressed data quality, the next challenge is keeping your model relevant.
Keep Your Model Updated
Treating capacity planning as a one-and-done task is a recipe for outdated forecasts. As products change, customer needs evolve, and teams grow, historical patterns lose their predictive power [7][5]. A model that worked in January might no longer be reliable by April, especially if significant changes occur.
To stay on top of shifting demand, update your forecasts regularly – ideally monthly, but at least quarterly [1][5]. Frequent recalibration ensures your staffing decisions are based on current realities, not outdated assumptions.
Step 5: Deploy and Refine Your Capacity Model
Present Your Model to Leadership
When presenting your capacity model to executives, focus on turning subjective opinions into clear, data-supported business cases. For example, instead of simply stating, "We need two more agents", you could say: "Our model forecasts an 18% increase in tickets next quarter, requiring 1.8 additional FTEs to maintain our 4-hour SLA" [1]. This shifts the conversation from vague requests to actionable predictions.
Be sure to include the complete cost breakdown – not just base salaries. Fully burdened labor rates, which include payroll taxes, benefits, software licenses, and hardware, often exceed base pay by 30%–40% [12]. Additionally, consider the ramp-up period: new B2B support reps generally take around seven months to reach full productivity, meaning you’re paying their full salary before seeing their maximum output [12].
Use scenario-based modeling to illustrate different demand outcomes. Present base, stretch, and downside cases using combo charts, such as bar graphs for daily ticket forecasts with a line overlay for planned staffing levels. This highlights potential staffing gaps [4][7]. Aim to plan for the upper edge of an 80% confidence interval, which helps balance preparedness and cost efficiency without overstaffing for rare outliers [1].
By combining detailed calculations with clear visual tools, your presentation can stand up to executive-level scrutiny.
Create Feedback Loops for Continuous Improvement
Once leadership is on board, the next step is ensuring your model stays accurate over time. A capacity model isn’t a "set it and forget it" tool – it requires ongoing updates. Refresh forecasts monthly to adjust for changing product dynamics and team performance [1]. Regularly compare predictions with actual ticket volumes and agent productivity to pinpoint where your assumptions may need tweaking.
Keep an eye on early warning metrics like median first reply time, SLA performance, and backlog growth. These can signal when your team is nearing capacity limits [3][6]. If you roll out new self-service tools, such as chatbots or knowledge bases, reassess your forecast within 60 days to measure their actual impact on ticket deflection and adjust staffing plans accordingly [1].
Accuracy expectations can vary. For mature products, aim for a forecast variance of less than 5%, while emerging markets might allow for up to 20% [7]. As a general benchmark, a Mean Absolute Percentage Error (MAPE) under 10% is considered solid for support data, while anything below 5% is excellent [1].
Apply the Model to Hiring and Resource Decisions
With a tested and continuously updated model, you can directly apply your insights to hiring and resource allocation. Use your capacity model to pinpoint specific weeks where predicted ticket volumes will outpace current staffing, enabling you to take proactive steps to avoid SLA breaches [1]. Build headcount plans using 3- or 6-month forecasts to stay ahead of demand.
Set clear hiring triggers based on measurable benchmarks. For instance, you might decide to hire one Customer Success Manager for every $2 million in ARR managed [12]. When considering investments in automation, compare their costs to the equivalent human workload. For example, if a chatbot can handle 300 tickets per month and one agent manages 100 tickets, the chatbot’s value is equivalent to three agents’ fully loaded costs. This approach ties your capacity model directly to ROI calculations for new tools [5].
Schedule quarterly capacity reviews to adjust quotas and team territories before discrepancies escalate [7]. Ensure alignment across Sales Ops, Finance, and Support teams by using a shared capacity model and consistent assumptions [7]. Data-backed capacity planning can lead to revenue growth rates up to 15% faster than teams relying on manual methods [12].
Conclusion
Summing up the steps outlined earlier, the goal of building a support capacity model isn’t about achieving perfect accuracy – it’s about creating a framework that can grow and adapt. Even with limited historical data, you can start small, use proxies to fill in gaps, and improve your predictions over time. Structured data, even if incomplete, will always lead to better decisions than relying on intuition alone.
Think of capacity planning as a continuous process. Update your forecasts monthly to account for changes in ticket volumes and team performance [1][5]. Tools like ARIMA modeling or Excel’s FORECAST.ETS function can help uncover seasonality and trends that manual methods often overlook [1][4].
"Whatever data you apply and how you choose to apply it – if you don’t have a forecasting model, then you’re shooting from the hip when it comes to scaling your team." – Charlotte Ward, Director of Support, Snowplow [2]
To keep your model relevant, use proxies, integrate AI-driven insights, and refresh it regularly. Aim for a Mean Absolute Percentage Error (MAPE) below 10% – and if you can get it under 5%, even better [1]. With regular updates, scenario planning, and AI insights, your capacity model becomes a powerful tool for hiring, budgeting, and planning for the future.
FAQs
What should I do if I have less than 60 days of ticket data?
If you’re working with less than 60 days of ticket data, you can still make informed staffing decisions by using proxy methods. Start by analyzing recent ticket activity to spot patterns and trends. Factor in upcoming events like holidays or product launches that might influence demand. Use short-term trends, seasonal patterns, and average handle times to estimate your needs.
While these forecasts may not be perfect, they can still guide you in building practical staffing models, even with limited historical data.
How do I choose realistic shrinkage and occupancy assumptions for my team?
When setting base shrinkage and occupancy assumptions, it’s smart to rely on a mix of historical data, industry standards, and your team’s unique circumstances. Generally, occupancy rates fall between 70% and 85%, while shrinkage – which accounts for breaks, meetings, and absences – tends to hover around 15-25%. These figures are a good starting point.
From there, refine these benchmarks using your team’s specific data. Look for trends, such as peak activity periods or common absence patterns. To stay accurate, make it a habit to regularly review and update these assumptions as work dynamics and operational demands shift over time.
How can I separate true new ticket demand from backlog and reopened tickets?
To get a clear picture of actual demand, break your ticket volume into three distinct categories: new demand (brand-new tickets), backlog (tickets carried over from previous periods), and reopens (tickets reopened after being marked resolved). Leverage data labeling tools or scripts within your support platform to tag tickets accordingly. This approach ensures you can accurately forecast staffing needs based on genuine demand, without inflating numbers due to backlog or reopened tickets.
Related Blog Posts
- Call Center Workforce Management: A Beginner-Friendly Guide
- How do you forecast ticket volume and staffing without fancy tools?
- How do you build a support org chart that scales (roles, ratios, and when to hire ops)?
- How do you build a support forecasting model using arrival rate + handle time (simple math)?