In B2B support, tracking customer health is critical for reducing churn and driving renewals. Many teams assume this requires complex tools or large-scale data projects, but that’s not true. You can use existing systems and straightforward methods to create actionable customer health scores.
Here’s how you can start today:
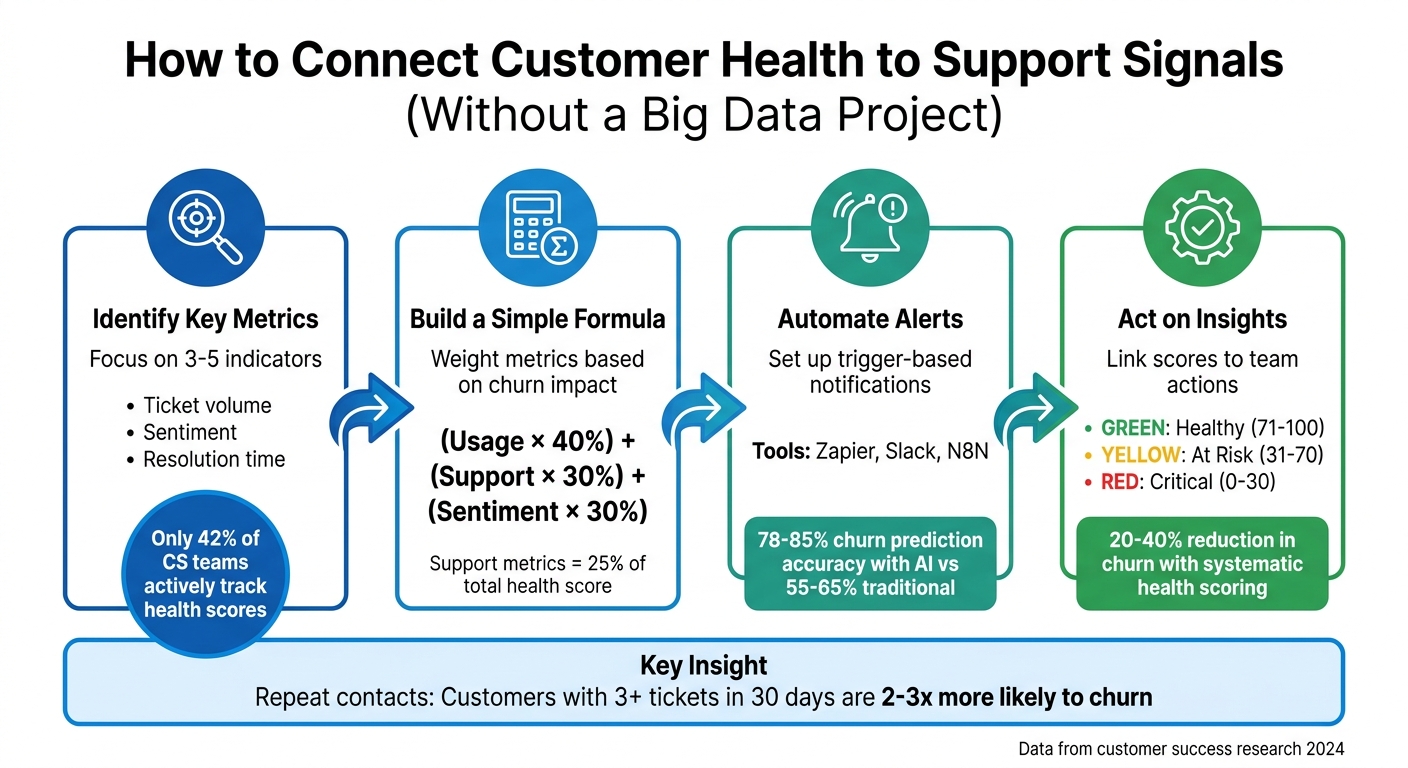
- Identify key metrics: Focus on 3–5 indicators like ticket volume, sentiment, and resolution time.
- Build a simple formula: Weight metrics based on their impact on churn, e.g.,
(Usage × 40%) + (Support × 30%) + (Sentiment × 30%). - Automate alerts: Use tools like Zapier or Slack to notify your team about at-risk customers.
- Act on insights: Link health scores to specific team actions, like proactive outreach strategies or escalation.
4-Step Framework for Building Customer Health Scores from Support Signals
Key Support Signals That Indicate Customer Health
How Support Metrics Connect to Health Outcomes
When it comes to understanding customer health, not all support metrics carry the same weight. One of the clearest indicators of potential churn is repeat contact. Customers who reach out to support three or more times within 30 days are 2 to 3 times more likely to churn compared to those who contact support just once – or not at all [8]. This pattern often points to unmet needs or product friction, with each additional interaction compounding the frustration.
Escalation trends also offer valuable clues. For example, if escalation rates spike by 40% following a product release, it could indicate a serious quality issue [8]. Similarly, a steady drop in satisfaction scores – like going from 5 to 2 over consecutive interactions – or a sudden lack of communication from previously engaged customers are red flags for churn risk [8].
Quick resolutions are generally a positive sign, but for high-value accounts, slow response times can sometimes hide underlying issues. Another early warning sign is a high Customer Effort Score during onboarding, which often signals a risk of losing new customers [6][8]. On average, support metrics contribute about 25% to a comprehensive customer health score [2].
These insights highlight the importance of identifying the most relevant signals for your business.
Choosing the Right Signals for Your Business
With these insights in mind, focus on metrics that reflect both customer interactions and broader behavior patterns. Aim to track 3–5 key metrics that align with your product’s complexity and customer journey. Avoid overwhelming yourself with data – currently, only 42% of customer success teams actively track customer health scores [6].
For onboarding customers, prioritize metrics like milestone completion, login activation, and support volume. For established customers, shift your focus to metrics such as ROI delivery, product usage depth, and upsell activity [2]. By tailoring your approach to these specific stages, you can better address customer needs and reduce churn risk.
sbb-itb-e60d259
How to Build a Simple Customer Health Score
Creating Your Scoring Formula
To craft a reliable customer health score, focus on four key areas: Product Usage, Support Interactions, Sentiment, and Business Outcomes [2][10][11]. Instead of overwhelming your team with dozens of metrics, stick to 4–6 impactful ones. Tracking too many variables can lead to unnecessary complexity and erode trust in the process [2][13].
Each metric should be weighted based on how strongly it correlates with churn risks. A common formula to start with might look like this:
(Usage Score × 0.4) + (Support Score × 0.3) + (Sentiment Score × 0.3) = Final Health Score [2]. Typically, product usage carries the most weight (30–40%), followed by support health (20–25%), sentiment (15–20%), relationship indicators (10–15%), and financial metrics (10%) [2].
To ensure consistency, normalize all metrics to a 0–100 scale [12][15]. For example, with support metrics, use inverse scoring: zero open tickets might score 20 points, while six or more tickets could result in 0 points [16]. A rolling 28-day window helps smooth out daily fluctuations, making trends easier to interpret [12].
"The best metrics are clarity metrics, not vanity metrics" [12].
Establish clear thresholds to interpret the scores:
- Healthy: 71–100
- At Risk: 31–70
- Critical: 0–30 [2]
Remember, a low score isn’t a final judgment – it’s more like a warning signal [2]. To keep your model accurate, review it quarterly. Compare the scores of customers who churned to see if the model flagged their decline at least 90 days in advance [16].
Once your formula is ready, the next step is putting it into action with tools you already use.
Using Existing Tools to Calculate Scores
You don’t need costly software to implement a health score. Start with tools you already have. For example, a spreadsheet can do the job. Export data from your CRM and support desk, then calculate scores by multiplying action counts by their respective weights and summing the results [14]. A simple approach like (Positive Action Count × Weight) – (Negative Action Count × Weight) works well for generating raw scores [14].
If certain data points – like NPS scores – are unavailable for some customers, assign a neutral score (e.g., 7 out of 10) to avoid penalizing them unfairly [16]. Update scores daily rather than in real-time. This cadence allows you to catch meaningful shifts in trends without overreacting to short-term changes [16].
For teams looking to integrate data more efficiently, tools like N8N or Zapier can automate the process. These platforms can pull data from support systems into a central dashboard without requiring custom-built integrations [5][11][12]. This method simplifies data handling while still providing actionable insights.
"The most advanced health score isn’t the one with the best algorithm. It’s the one your team actually believes in and uses" [13].
Setting Up Automated Alerts for At-Risk Customers
Setting Up Trigger-Based Alerts
Once you’ve calculated customer health scores, it’s time to put that data to work with proactive alerts. These alerts help you identify and address risks early by flagging unusual patterns or concerning trends.
Start by setting up score-based thresholds. For example, trigger an alert if a customer’s health score drops more than 15 points in a week or if a high-value account falls below a score of 40. Such sudden changes often indicate pressing issues that need immediate attention. You can also use anomaly detection to catch deviations from typical behavior, like a 40% drop in weekly usage compared to the customer’s 90-day average.
Don’t overlook sentiment shifts. Natural language processing (NLP) tools can analyze customer communications – emails, support tickets, etc. – to detect changes in tone. Signs of frustration, uncertainty, or abrupt, negative language can signal deeper problems. If sentiment moves from "Positive" to "Negative" over two or more interactions, it’s time to check in with the customer.
To avoid overwhelming your team with constant notifications, use tiered alerting to prioritize issues:
- Critical: Immediate Slack notification to the Customer Success Manager (CSM) and team lead.
- High: Included in a daily digest for high-value accounts.
- Medium: Logged in your CRM or project tool for weekly review.
- Low: Silently tracked for historical analysis.
This approach ensures your team focuses on the most urgent risks while still keeping a record of lower-priority issues.
"CSMs should treat AI health scores as decision-support signals rather than final conclusions. Human context remains essential when evaluating whether an account truly requires intervention." – Velaris Team
Here’s a quick guide to common support signals and how to configure alerts for them:
| Support Signal | Alert Trigger Example | Recommended Action |
|---|---|---|
| Ticket Volume Spike | More than 3 tickets on the same issue in 2 weeks | Trigger the "Technical Friction" playbook |
| Negative Sentiment | AI detects "frustration" in 2+ emails | Immediate Slack alert to the assigned CSM |
| Resolution Time | Average resolution time increases by 50% | Escalate to the Support Lead for review |
| Escalation Frequency | Any ticket escalated to "Level 3" | Notify the Account Executive and CSM |
| Sentiment Shift | Tone changes from "Positive" to "Negative" | Schedule a proactive check-in call |
Allow CSMs to review or override automated alerts. Their input fine-tunes the AI model, improving accuracy over time. Companies using predictive AI models report churn prediction rates of 78–85%, compared to 55–65% for traditional systems [17]. These alerts integrate seamlessly into your team’s workflow, ensuring a coordinated response.
Simple Automation Options
You don’t need an elaborate tech stack to set up automation. Start by leveraging the tools you already use. Many support platforms, like Supportbench, offer built-in features to automate much of this process. For instance, email-to-ticket automation ensures that high-priority messages and frequent requests are captured and categorized in real time, giving your team immediate insight into potential risks.
For teams working across multiple systems, low-code automation tools can bridge the gap between your support platform, CRM, and communication tools. These solutions are cost-effective, with pre-built templates available for as little as $199 for setup and monthly infrastructure costs ranging from $3 to $30 for handling 100–1,000 tickets [18].
For high-priority risks, consider using Slack Block Kit alerts. These can include a breakdown of the issue, recommended actions, and even a countdown to SLA deadlines. Medium-risk alerts can be routed to a daily digest or logged in a project management tool for review during weekly team meetings.
AI-driven workflows can significantly reduce administrative tasks. For example, automating data gathering can cut the time CSMs spend on scoring tasks by 55–70% [17]. Instead of manually compiling reports, your team gets actionable insights that highlight which accounts need attention and why. This frees up CSMs to focus on building relationships – a key factor in reducing churn.
"Health scores only work when you can actually pull all that information together… Compiling this manually? That’s where the real work begins, and where most teams get stuck." – Datagrid Team
Keep costs in check. AI-powered SLA risk analysis typically costs $0.016–$0.080 per ticket, averaging around $0.030 [18]. For most B2B teams, this translates to just a few hundred dollars per month – a small price compared to the cost of losing even one customer.
Continuous monitoring outperforms periodic reviews. Traditional health scoring relies on quarterly check-ins, which can quickly become outdated. In contrast, AI-driven systems recalculate scores in real time as new data comes in. Companies with automated health scoring systems report 21–38% lower churn rates [17], making this a smart investment for long-term success.
Connecting Support Signals to Team Actions
Building a Response Framework
After covering scoring and automated alerts, the next step is linking these signals to actionable steps for your team. Customer health signals are only useful if they drive specific actions; without a clear plan, even the best data won’t stop churn. The solution lies in creating structured response protocols that align health categories with targeted actions across your organization.
Start by defining health tiers with clear thresholds and assigning responsibilities. For example:
- A health score of 85–100: Flag for expansion opportunities and notify your sales team.
- A score of 50–69: Trigger immediate notification to the CSM (Customer Success Manager) and schedule an intervention call [21].
- A score of 0–49: Assign a senior CSM or retention specialist, initiate an executive business review, and begin daily monitoring [21].
Your framework should also address support volume trends that call for cross-functional collaboration. For recurring issues (three or more contacts), loop in your product team for a long-term solution. A threefold increase in tickets over seven days should prompt an executive review. Even a lack of tickets for 60+ days should lead to proactive outreach within one week to confirm the customer is genuinely satisfied, not just disengaged [21].
"Recurring revenue is a rhythm – not one note. It’s a commitment to continuous improvement and innovation, led by the customers you’ve got." – Jared Cook, Founder, Crush Churn Consulting [19]
Roll out your framework in stages to avoid overwhelming your team. A 30/60/90-day plan works well:
- First 30 days: Gather baseline data and finalize definitions.
- Next 30 days: Normalize metrics and refine processes.
- Final 30 days: Deploy closed-loop triggers that automatically route and resolve issues in real time [20].
This gradual approach allows teams to adjust while ensuring the framework becomes fully operational.
Once your response tiers are in place, the focus shifts to making sure every team has access to these signals – and acts on them.
Ensuring Cross-Team Visibility
With a solid response framework established, ensuring real-time visibility for all teams is crucial. This can be achieved by integrating tools and aligning customer health priorities across the organization.
Low-code automation platforms can connect your support system to tools your teams already use. For example:
- Route high-risk signals to Slack for immediate action.
- Log medium-risk issues in a shared Notion database for weekly reviews [18].
This tiered approach ensures urgent matters are addressed quickly without overwhelming communication channels. Tools like Slack Block Kit can display risk breakdowns, recommended actions, and SLA countdowns – providing teams with everything they need to act fast [18].
AI-powered ticket routing can also help by automatically categorizing customer intent and routing urgent or high-value tickets to the right teams. This process is cost-efficient, averaging $0.030 per ticket, with monthly infrastructure costs for 100–1,000 tickets ranging from just $3 to $30 [18].
Beyond tools, establish data relevance rules to guide your teams on how long specific signals remain actionable. For instance:
- Usage signals: Use a 7-day rolling average due to their volatility.
- Relationship signals: These, like executive sponsorship, may remain relevant for up to 90 days [21].
This ensures teams don’t overreact to short-term changes while also staying alert to long-term trends.
Finally, keep in mind that personalized outreach makes a difference – 78% of customers are more likely to repurchase when they receive tailored communication [2].
How To Spot Unhappy Customers Early
Common Mistakes to Avoid
Avoiding these common pitfalls is crucial to keeping your customer health metrics actionable and aligned with support insights.
Relying on Just One Metric
Relying on a single metric to measure customer health can lead to misleading conclusions. For example, low support ticket volume might seem like a good sign, suggesting a customer is doing well. But it could also mean they’ve stopped seeking help entirely – a potential red flag for churn[11]. Both scenarios show the same data point, but they tell completely different stories.
"Your doctor has all sorts of ways to understand, diagnose, and treat your health. But imagine if they only were taking your blood pressure? That’s the trap we get into – especially in SaaS." – Gainsight[4]
To get a clearer picture, you need to combine multiple signals. For instance, a customer logging in 50 times this month might seem engaged – until you compare it to last month’s 200 logins. The decline is what matters most[5]. AI-powered models that analyze diverse data streams can predict churn with 78% accuracy up to 60 days in advance, compared to just 45% accuracy with single-metric approaches[5]. By balancing product usage, support activity, financial data, and sentiment analysis, you can identify patterns that one-dimensional metrics often miss.
Adding qualitative feedback to the mix makes your health assessment even sharper.
Overlooking Qualitative Feedback
Numbers tell you what happened, but qualitative data can reveal why. For instance, frustrated language in support tickets often signals dissatisfaction that may lead to churn. Traditional scoring models, which rely heavily on quantitative data, only manage about 45% accuracy in predicting churn. In contrast, AI-powered models that include sentiment analysis achieve around 78% accuracy[5].
Natural language processing tools can help by detecting frustration or dissatisfaction in customer communications – sometimes weeks before usage metrics start to decline. Monitoring sentiment trends over a rolling 30-day period provides insights that raw numbers alone can’t[3]. Combining behavioral data with emotional cues gives you a more comprehensive understanding of customer health.
As your product and customer behaviors evolve, it’s equally important to keep your scoring model up to date.
Using the Same Scoring Model Forever
Customer health scoring models must adapt over time. Outdated models fail to capture new behaviors that drive value[2]. In fact, 88% of teams improved retention by tracking feature-level usage patterns[9].
"A common mistake: building a health score model and never validating it. Every quarter, look at accounts that churned and check what their health scores looked like 90 days prior." – Mark Rachapoom, DenchClaw[16]
Quarterly reviews are essential to ensure your model stays relevant. For example, if accounts marked as "Yellow" churn at the same rate as those marked "Red", it’s a sign your scoring thresholds need adjustment[16]. Tailor your scoring to different lifecycle stages, as onboarding customers will exhibit different behaviors compared to long-term users[2][9]. Regularly refine your metrics, eliminate false positives, and adjust weighting based on historical data. A dynamic model remains useful, while a static one quickly becomes irrelevant noise.
Getting Started with Customer Health Scoring
Now that you’ve sidestepped common mistakes, it’s time to build a customer health scoring system using the data you already have. Start small by focusing on just a few key signals – around 3 to 4 – that can provide meaningful insights. Examples include ticket volume trends, severity distribution (like P1 vs. P3 tickets), and sentiment in customer communications. You can gather this information from tools you’re likely already using, such as your help desk, CRM, or billing systems [3][15].
To calculate the health score, use a weighted formula like this: Activity (40%), Engagement (30%), Milestones (20%), and Recency (10%) [1]. Normalize each metric on a scale of 0–100 for consistency. Companies that adopt systematic health scoring often see a 20–40% reduction in churn [1], and the best part? You can get started in just a few hours instead of spending months on setup.
"A health score without a response playbook is just a number." – FirstDistro [1]
Set clear thresholds for action:
- Healthy: 80–100
- Monitor: 60–79
- At-Risk: 40–59
- Critical: Below 40 [1]
Each category should trigger a specific response. For instance, At-Risk accounts might need proactive outreach to resolve potential issues, while Critical accounts should be escalated to a customer success manager or even an executive for immediate attention. Automate alerts via Slack or your CRM to notify your team whenever scores drop. This way, you can act quickly to address problems before they lead to churn.
Every quarter, revisit and refine your model. Compare scores from 90 days ago with actual renewal and cancellation data to identify and eliminate false positives [1][7]. As your product and customer behaviors evolve, adapt your scoring approach accordingly. Start with the tools and data you have now, improve your process based on results, and scale your efforts as you uncover what works. By following this straightforward framework, you’ll be well on your way to creating a more effective and actionable health scoring system.
FAQs
Which 3–5 support signals should I start with?
Keeping an eye on specific support metrics can help you spot potential customer issues before they escalate. Here are the top signals to track:
- Repeat Contact Rate: If a customer submits multiple tickets (e.g., three or more within 30 days), it could signal underlying frustrations or a risk of churn.
- Ticket Volume Trends: A noticeable increase in the number of tickets from a customer often points to dissatisfaction or unresolved concerns.
- Resolution Time: Long resolution times can leave customers feeling ignored or frustrated, making this a crucial metric to monitor.
- Escalation Rates: A spike in escalated tickets often indicates that customers are dealing with complex or unresolved problems.
By keeping tabs on these signals, you can identify at-risk customers early and take steps to improve their experience, boosting retention in the process.
How do I set weights without historical churn data?
To determine weights for your customer health score when you lack historical churn data, prioritize the predictive value of different support signals. These might include activity levels, user engagement, milestone achievements, and recency of interaction. Assign greater weight to signals that are more closely tied to churn risk, such as product activity, while giving less weight to signals with weaker predictive links. Rely on industry standards and practical insights to craft a formula that accurately represents the importance of each signal, even in the absence of past data.
How do I prevent alert fatigue from health-score notifications?
To tackle alert fatigue, concentrate on cutting down low-priority notifications and ensuring alerts carry real value. Tailor and prioritize alerts based on their relevance, leveraging AI-powered tools to sift through the noise. Regularly revisit and adjust alert thresholds to stay aligned with current needs. Also, create a positive response culture by acknowledging team contributions. This approach helps deliver timely and actionable alerts, keeps support teams motivated, and reduces the risk of burnout.