Every support ticket contains valuable insights about your product and team performance. But without a structured system, these insights often go unnoticed. Tagging support tickets with clear categories transforms raw data into actionable information. Here’s how:
- Spot training needs: Inconsistent or incorrect tagging by agents highlights areas where additional training is required.
- Identify product gaps: Recurring tags, like "export issues", signal where your product may need improvements.
- Streamline analysis: AI-powered tools ensure accurate, consistent tagging and save time by automating the process.
A two-tier tagging framework, combined with AI and regular audits, helps teams organize data, track trends, and improve both customer support and product development. Let’s break it down step by step.
How to Build a Tagging Framework That Works
Creating an effective tagging system starts with a two-tier structure. Tier 1 is mandatory and consists of stable, mutually exclusive categories. To keep it manageable, limit this tier to fewer than 10 categories to avoid overwhelming your team. Each ticket should fit into one and only one Tier 1 category without overlap. For example, a ticket about login errors might fall under "Technical Issue" in Tier 1, while "Login" serves as an optional Tier 2 subcategory for added context [2].
A popular approach for Tier 1 is the RUF framework, which divides tickets into three broad groups: Reliability (errors and performance issues), Usability (how-to questions), and Functionality (feature requests). This streamlined system covers most tickets without complicating the process [2].
Create Clear Tag Categories
To make your tagging system effective, avoid vague or catch-all tags like "Other" or "General Inquiry" [2]. Consistency is key – stick to one term for each concept across all tickets. For instance, always use "Billing" instead of mixing it with "Payments" or "Invoicing."
Document your tags with one-sentence definitions to ensure everyone uses them the same way. Include this glossary in your onboarding materials so new team members can quickly get up to speed. Regularly review your tags – quarterly or twice a year – to eliminate unused ones, merge duplicates, and keep the system focused on the 80% of tickets you handle most often, rather than rare outliers [2].
"If a tag doesn’t change how you handle a ticket or how you understand your support data, it’s adding noise instead of clarity." – Jake Bartlett, Writer and Customer Support Expert [2]
Once your categories are clear, AI can help maintain consistency and accuracy in tagging across all tickets.
Use AI to Auto-Tag Support Tickets
Manual tagging often becomes inconsistent, especially under time pressure [2]. AI-powered ticket routing and prioritization tools solve this problem by applying objective logic to every ticket. Instead of relying on literal keywords, AI uses Natural Language Processing (NLP) to understand the context and intent behind a message [6][7].
The results are impressive. Support teams typically spend up to 20% of their time organizing tickets manually [8], but AI can reclaim that time. In fact, 64% of support leaders say AI-based ticket classification boosts agent efficiency [6]. Automating this process can save each agent 15–20 hours per month and reduce response times by up to 20% [8][6].
AI also handles nuances that keyword systems often miss. For example, a sentence like "I don’t want a refund" might confuse keyword tagging, but AI understands the sentiment and intent behind it [7][8]. Modern AI systems can even classify tickets on multiple levels at once – tagging by topic, urgency, sentiment, and product area in real time [5][6]. These models continuously improve as they learn from agent corrections and new data trends, eliminating the need for manual retraining [5][6].
sbb-itb-e60d259
How to Collect and Organize Tagged Data
Once you’ve set up your tagging framework with AI-powered tagging, the next step is gathering all interactions into one customer support management system for analysis. This includes pulling data from email, chat, phone, and self-service portals. Having everything in one place is key to spotting patterns across different channels.
Make sure to collect data for at least 30 days to account for natural fluctuations in ticket volume and types [1]. Shorter periods might give you misleading results. For instance, a rise in "Billing" tags during the first week of the month could simply reflect routine invoice-related activity, not a systemic issue.
Group Tags by Theme
To uncover meaningful insights, organize tags using your two-tier taxonomy. Start by grouping Tier 1 tags – broad categories like Technical Issue, Billing, or Feature Request – to see where most tickets fall. Then dig deeper into Tier 2 subtags to identify specific trends within each category.
For example, if "Technical Issue" accounts for 40% of your tickets, examine the subtags under it. Are most of these related to "Login" problems or "API Errors"? This breakdown helps you pinpoint whether a widespread authentication issue or a more niche integration challenge is at play. Similarly, clusters under "Usability" tags might highlight the need for better documentation or training resources.
Benchmarks show that SaaS companies typically achieve 75-85% tag consistency, while fintech teams often hit 80-90% [1]. Consistent tagging is critical for identifying patterns. Without it, your data can become fragmented. For instance, if one agent tags password-related issues as "Login" while another uses "Authentication", you’ll lose the ability to see the full picture. By grouping tags clearly and ensuring consistency, you’ll have a strong foundation for actionable insights.
Ensure Data Consistency
To maintain uniform tagging, rely on your tag glossary – those concise, one-sentence definitions you created for each category and subcategory [2].
Aim for an agreement rate of 85% or higher by cross-checking how different agents tag the same set of tickets [1]. One way to measure this is by having multiple team members independently tag 50-100 tickets and then comparing their results. If agreement falls below 85%, it might mean your tag definitions need refinement or your team could benefit from more training.
Tagging accuracy also varies by channel. Email and ticketing systems often achieve 88-95% coverage, while phone interactions lag behind at 60-75% [1]. This gap usually occurs because phone agents focus on resolving issues in real time and may not document them thoroughly afterward. To address this, introduce real-time validation that flags tickets missing required tags before they’re closed [1]. Automated systems can also monitor for unusual tagging patterns using AI customer support tools – like an agent suddenly using a tag they’ve never applied before – and trigger immediate feedback or coaching.
How to Analyze Tags for Training and Product Gaps
Once you’ve established a solid tagging system, the next step is to dive into the details. This analysis helps uncover where your team might need more training and highlights areas where your product could be improved. The goal? Go beyond basic reporting and pinpoint specific problems that need attention.
Find Training Gaps Through Tag Patterns
Start by comparing how individual agents use tags. For example, if one agent is applying a "Billing" tag far more often than their colleagues for similar tickets, it might signal confusion about tag definitions or a lack of knowledge in related topics like account management. These discrepancies can highlight outliers who may benefit from targeted coaching.
But don’t stop at counts – dig deeper. Review ticket samples to catch systematic misclassifications. An agent might label complex API errors as generic "Technical" issues simply because they don’t fully understand the product. To catch these patterns, perform weekly blind audits of 50–100 tickets to check for tagging accuracy and common mistakes [1].
If you notice heavy reliance on catch-all tags, it might mean agents are overwhelmed or the tags themselves are unclear. Breaking this down further, cohort analysis (e.g., by agent tenure or shift) can reveal whether newer hires struggle more with technical tags than seasoned team members.
"With an accurate understanding of why customers contact you, and the volume that topic arises, you can focus training around the most common issues and retrain agents when a new topic arises" [3].
- Ben Goodey, Customer Service Researcher at SentiSum
Identify Product Issues from Recurring Tags
Once training gaps are addressed, tag patterns can also shed light on product weaknesses. For instance, if you see a high volume of repeat tickets asking, "How do I export my data?" it may point to a product or documentation shortfall [9]. Keep an eye on these trends, particularly after updates. A spike in "Integration" tags post-release might suggest that customers weren’t prepared for changes or that new features are confusing [9].
Watch for feature discovery tickets – those moments when customers say, "I didn’t know this feature existed." These indicate users might be missing out on high-value tools, such as workflow automation or integrations, due to gaps in onboarding or product visibility [9]. Similarly, if customers repeatedly request workarounds, it could mean they’re unaware of more efficient solutions or that the product isn’t meeting their needs.
Tickets from long-term customers about basic features may signal knowledge gaps or increasing product complexity [9]. To get a clearer picture, sort these findings into four categories: what customers don’t know, can’t find, misunderstand, or haven’t been exposed to.
Track Key Metrics for Better Analysis
Focus on metrics that lead to action, not just numbers that look good on paper. For example, tag frequency and volume can highlight common pain points. If a particular tag appears more often than others, it’s an area worth prioritizing. Trend analysis can also help – compare tag usage over time to spot shifts tied to product updates or pricing changes.
Keep an eye on your tag consistency rate, which measures how consistently agents use tags for similar issues. SaaS teams typically hit 75–85%, while fintech teams often aim for 80–90% due to stricter guidelines [1]. Another key metric is the tag coverage rate, which tracks the percentage of tickets with at least one tag. Mature teams often aim for 90–95% coverage [1].
Tie tags to business outcomes by tracking customer satisfaction (CSAT) by tag. For example, if tickets tagged as "Onboarding" consistently receive lower satisfaction scores than "Billing", it’s a clear sign of customer frustration [3]. Additionally, using RUF distribution (Reliability, Usability, Functionality) can help you decide whether to focus on fixing bugs or developing new features [2]. This data provides concrete evidence to guide product roadmaps.
| Metric | What It Reveals | Target Benchmark (SaaS) |
|---|---|---|
| Tag Consistency Rate | How uniformly agents apply tags | 75–85% |
| Tag Coverage Rate | Percentage of tickets with tags | 85–95% |
| Average Tags per Ticket | Granularity of issue tracking | 2.1–2.8 |
Source: Support operations research [1]
How to Turn Tag Insights into Real Improvements
Once you’ve completed a detailed tag analysis, the next step is turning those insights into actionable changes. This involves prioritizing gaps, creating targeted training, and sharing findings with your development team.
Rank Gaps by Impact and Frequency
Start by ranking gaps using the RUF categorization system to quickly gauge ticket impact and set priorities [2]. This method helps you determine whether you’re dealing with critical bugs that need immediate resolution, knowledge gaps that call for training, or feature requests that should be added to the product roadmap.
"RUF stands for Reliability, Usability, Functionality. The idea is that every single ticket gets only one of these tags."
Focus on the most impactful areas by applying the 80/20 rule – address the gaps that affect the majority of tickets. For example, prioritize tags tied to SLAs, specialized routing, or key customer groups like "Enterprise" or "VIP." Also, pay attention to frequent use of catch-all categories like "Other" or "General Inquiry", as it may indicate missing or unclear taxonomy categories [1][2].
Build Training Programs That Address Specific Gaps
Generic training often falls short. Instead, classify gaps into categories like unknown, inaccessible, misunderstood, or unexposed [9]. This approach enables you to deliver training tailored to the specific issue.
For example, if tags show customers frequently asking, "How do I export my data?" create a quick 2-minute video or a step-by-step guide addressing that exact question [9]. Place these resources strategically at customer touchpoints, such as tooltips or signposts, where users encounter challenges.
For internal teams, analyze tagging accuracy and identify skill gaps based on tenure or shift patterns. Use this data to conduct cohort-specific coaching sessions rather than applying a generic training refresh [1].
"Your support queue isn’t a problem to manage. It’s a lesson plan your customers wrote for you."
To measure training success, monitor changes in ticket volume for specific tagged topics over time – check progress at 30, 60, and 90-day intervals [9]. Use these results to refine training efforts and guide product planning.
Feed Tag Data into Product Planning
Your tag data isn’t just for support – it can directly inform product development. Share recurring product-related tags with your development team to ensure the roadmap aligns with customer needs.
Use sentiment analysis to differentiate between neutral feature mentions and high-frustration pain points. This helps you prioritize urgent fixes over less critical enhancements. Integrate your tagging system with tools like Jira to streamline communication. For instance, when a customer-reported issue is resolved, Sales and Customer Success teams can be automatically notified, closing the feedback loop and demonstrating that customer input matters.
Finally, review and update your tagging taxonomy every six months or after major product updates. Consistent, standardized tags create a shared language across teams, improving resource allocation and collaboration between developers, designers, and product managers. This keeps your system aligned with both customer needs and product evolution.
Common Tagging Mistakes to Avoid
Common Support Ticket Tagging Mistakes and How to Fix Them
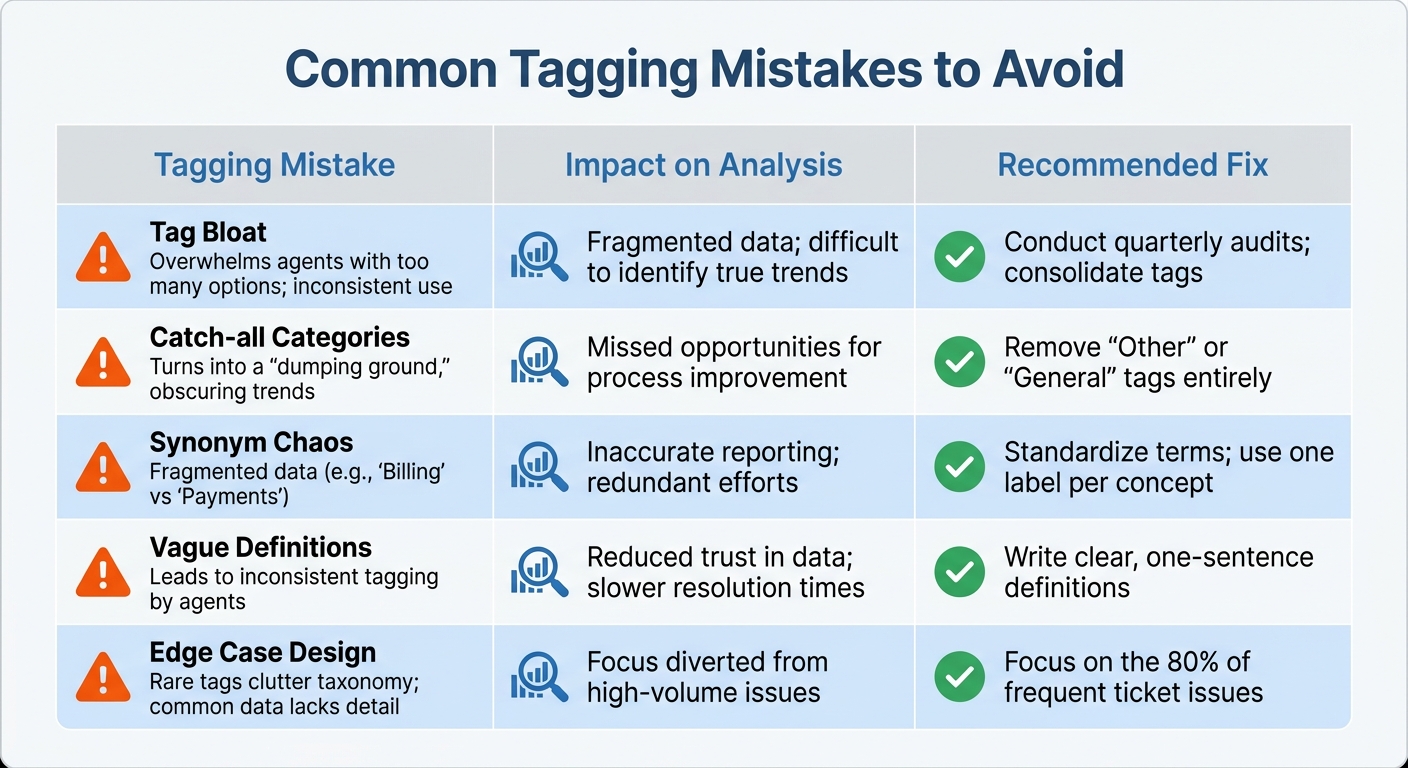
Tagging systems can run into trouble when certain missteps occur. One major issue is tag bloat, where hundreds of redundant tags pile up, leaving agents overwhelmed. Many support teams end up with over 1,000 tags, but only about 200 are actively used on a regular basis [4].
Another frequent error is relying on catch-all categories. Overusing vague labels like "Other" or "General" makes it nearly impossible to extract meaningful insights from your data [2]. Similarly, synonym chaos – using multiple terms like "Billing", "Payments", and "Invoicing" to describe the same issue – breaks your data into fragmented pieces. This makes it hard to identify trends or patterns. To avoid this, it’s essential to standardize your terminology through knowledge-centric support (refer to ‘Create Clear Tag Categories’ for more details).
A lack of clear tag definitions can also lead to subjective interpretation. Without concise, one-sentence explanations in an internal knowledge base, agents may apply the same tag to entirely different issues based on their personal judgment. This inconsistency skews your data and undermines its reliability. In the SaaS industry, tagging consistency typically falls between 75–85%, but your goal should be to reach at least 85% agreement among team members before rolling out the system [1].
Designing for edge cases is another common mistake. Building your tagging system around rare scenarios, like "VIP escalations", while lumping the majority of tickets into overly broad categories, creates blind spots in your reporting. Lastly, avoid analyzing tagging patterns over too short a period. Reviewing data from less than 30 days won’t capture natural fluctuations or seasonal trends, which can lead to misguided conclusions.
| Tagging Mistake | Impact on Analysis | Recommended Fix |
|---|---|---|
| Tag Bloat | Overwhelms agents with too many options; inconsistent use | Conduct quarterly audits; consolidate tags |
| Catch-all Categories | Turns into a "dumping ground", obscuring trends | Remove "Other" or "General" tags entirely |
| Synonym Chaos | Fragmented data (e.g., "Billing" vs "Payments") | Standardize terms; use one label per concept |
| Vague Definitions | Leads to inconsistent tagging by agents | Write clear, one-sentence definitions |
| Edge Case Design | Rare tags clutter taxonomy; common data lacks detail | Focus on the 80% of frequent ticket issues |
How to Automate Tag Analysis with AI
Why AI-Driven Tag Analysis Works Better
Managing hundreds – or even thousands – of support tickets weekly can quickly overwhelm teams relying on manual processes. Spreadsheets become unwieldy, and by the time trends are identified, customer issues may have already escalated. AI-powered platforms, using Natural Language Processing (NLP) and Machine Learning (ML), solve this by automating ticket categorization across multiple channels, removing the need for manual tagging altogether [11][12].
What sets these systems apart is their ability to perform advanced text and sentiment analysis. They don’t just categorize tickets – they extract meaningful insights from customer responses, spotting recurring themes and detecting emotions like frustration or satisfaction in real time [11][12][13]. This means teams can address problems as they arise. For instance, if a spike in checkout errors is detected, the system flags it immediately, notifies the relevant team, and even triggers preventive actions before the issue spreads [13].
The numbers speak for themselves: studies reveal that AI agents can improve productivity by 14% and boost customer satisfaction by 17% [12]. Jane Hendricks of Genesys captures this perfectly:
"Consumer insights analytics can be a game-changer in understanding and predicting customer behavior" [10].
Beyond speed, AI uncovers patterns that might elude human reviewers. These insights feed directly into ongoing performance monitoring, paving the way for dynamic and responsive reporting.
Automate Reports and Dashboards
AI-native platforms don’t just stop at analysis – they take reporting to the next level with real-time updates and automated dashboards. A great example is Supportbench, which simplifies tag analysis and reporting by generating visual dashboards and performance summaries automatically. No more exporting CSV files or building pivot tables. Instead, these systems continuously update metrics like agent performance indicators, tag frequency, and training gaps [1]. They can even flag unusual tagging patterns in real time, allowing for immediate coaching when an agent’s actions deviate from team norms [1].
Modern AI reporting tools go a step further by using specialized agents for parsing data, spotting trends, and generating narratives. By Q1 2026, these multi-agent systems had cut report generation times by 30–50% compared to traditional approaches [14]. By May 2026, 80% of enterprise analytics teams had adopted conversational AI tools, enabling managers to ask plain-language questions like, "What were the top product issues causing escalations last month?" [14]. These tools respond instantly, pulling from unified tag data and presenting results in easy-to-read charts and tables – no SQL expertise required, no manual dashboard setup needed.
Conclusion
Structured tagging turns support tickets into a treasure trove of data that can be used to refine training programs and improve products. By creating a clear taxonomy, avoiding catch-all categories, and ensuring consistency, you can transform raw data into actionable insights. The results speak for themselves: SaaS companies that maintain tag consistency rates between 75% and 85% are better equipped to pinpoint knowledge gaps, prioritize product updates based on actual customer needs, and allocate resources more effectively [1].
With a solid tagging framework in place, automating customer support workflows takes things a step further by removing human error from the equation. Instead of relying on manual categorization, modern platforms use plain language definitions to apply tags consistently and accurately [2].
The shift to AI-powered platforms, like Supportbench, is revolutionizing how B2B teams operate at scale. These systems automate tag analysis and generate real-time dashboards, making it easier to uncover insights that would otherwise get lost in spreadsheets. This isn’t just about tracking metrics – it’s about understanding why customers are reaching out, enabling deeper root cause analysis to address underlying product or process issues [3]. By integrating tagging with AI, support operations become a strategic driver for product and service enhancements.
When you pair a strong tagging system with AI automation, you create a feedback loop that continuously improves agent performance and product quality. Training becomes more focused, product teams can prioritize features using data-backed evidence, and support costs drop as customer pain points are addressed at their source. As Ofir Ziv, Lead Data Scientist, wisely notes:
"The data is the most important thing in any Data Science project… Garbage IN → Garbage OUT" [15].
Start with structure, layer in AI automation, and let the insights guide meaningful improvements. These strategies empower B2B support teams to not only solve today’s challenges but also proactively reduce costs and boost customer satisfaction over the long term.
FAQs
How do I choose Tier 1 tags that won’t overlap?
To keep Tier 1 tags organized and prevent overlap, it’s essential to build a clear, hierarchical tagging system. Start with broad, distinct categories that cover major issue types. These top-level tags should act as umbrella terms, making it easy to classify issues without confusion.
At the same time, ensure the tags are detailed enough for reporting but still simple for agents to use consistently. Overly complex or ambiguous tags can lead to inconsistent usage, which defeats the purpose of tagging in the first place.
Finally, don’t set it and forget it. Regularly review and refine your tags to remove redundancies and improve clarity. This ongoing process ensures that your system stays relevant, supports accurate data analysis, and prevents unnecessary confusion for your team.
What’s the fastest way to measure tagging consistency?
The fastest way to evaluate tagging consistency is to examine tag usage patterns. Look at how often and uniformly tags are applied across tickets. Pay attention to the distribution and frequency of tags to catch any irregularities. To make this process smoother, use a clear tagging taxonomy as a reference for agents. This minimizes mistakes and boosts consistency. By combining these steps, you can quickly spot and resolve inconsistencies in your tagging system.
How do I turn recurring tags into product roadmap priorities?
Support tags are a treasure trove of insights when used effectively. By analyzing recurring tags, you can uncover the most common issues your customers face and what they truly need. The key is to establish a consistent tagging system that tracks patterns across all customer interactions.
Focus on tags that appear frequently, as they often point to major pain points. These recurring themes can guide your efforts in reducing customer friction or addressing unmet needs. For example, if "payment issues" or "shipping delays" are common tags, these should be flagged as high-priority areas for improvement.
To make this process even smoother, tools like AI or automation can help. These technologies can quickly sort through large volumes of data, identify trends, and translate them into actionable insights. From there, these insights can inform product updates, process changes, or even new features that directly address customer concerns.
By prioritizing themes with the most potential impact, you can turn customer feedback into meaningful improvements that enhance their experience.