Support teams are shifting focus from satisfaction metrics like CSAT, CES, and NPS to revenue-driven metrics like Net Revenue Retention (NRR). Why? Because NRR directly ties customer loyalty to revenue growth, making it a key indicator of business health. Top B2B SaaS companies with NRR above 110% grow faster and achieve higher valuations compared to those with weaker retention.
Here’s the core idea: support isn’t just about solving problems anymore – it’s about protecting and growing revenue. By improving retention and driving upsells, support teams can transform from cost centers into revenue engines. Metrics like NRR and Gross Revenue Retention (GRR) help predict churn, highlight growth opportunities, and align support operations with business goals.
Key takeaways:
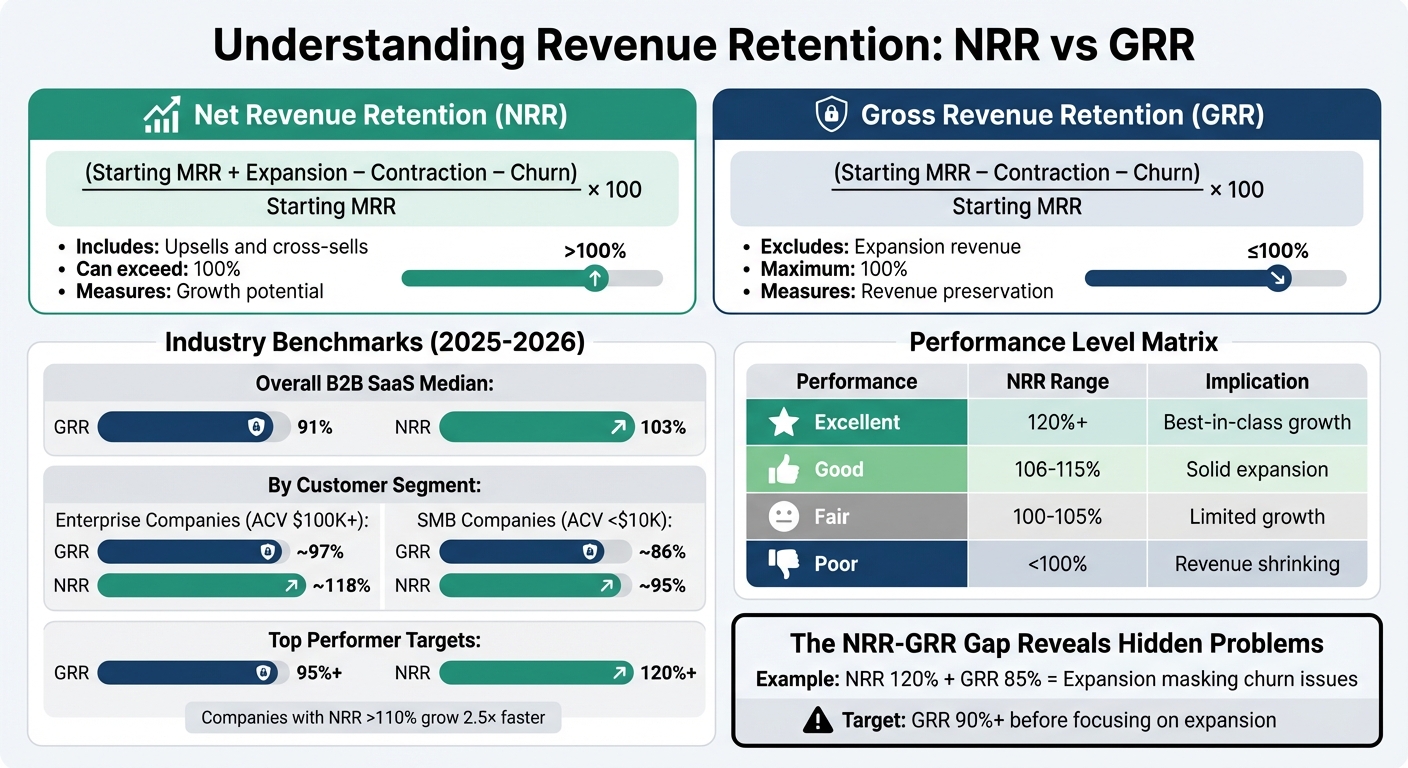
- NRR Formula: (Starting MRR + Expansion – Contraction – Churn) / Starting MRR × 100
- GRR Formula: (Starting MRR – Contraction – Churn) / Starting MRR × 100
- Benchmarks: Aim for 90%+ GRR and 110%+ NRR for enterprise customers.
- AI Tools: Predict churn, prioritize tickets, and automate workflows to boost retention and efficiency.
Support teams that adopt revenue-focused strategies and integrate AI tools can reduce churn by 20–30%, improve customer loyalty, and directly impact the bottom line.
What is Net Revenue Retention (NRR) & How to Improve It
sbb-itb-e60d259
Revenue Retention Metrics Explained
NRR vs GRR: Revenue Retention Metrics Comparison and Benchmarks
Revenue retention revolves around two key metrics: Net Revenue Retention (NRR) and Gross Revenue Retention (GRR). While both track customer revenue retention, they highlight different aspects of your business. NRR captures growth potential by factoring in expansion revenue from upsells and cross-sells. On the other hand, GRR focuses strictly on keeping your existing revenue steady, excluding any expansion revenue – it maxes out at 100%.
"Net Revenue Retention offers a more complete story than gross retention by accounting for customer growth. It frames retention not just as a defensive metric, but as a powerful lever for capital-efficient growth." – Salesmotion.io [7]
For support teams, these metrics are invaluable. They reveal whether your efforts are merely preserving revenue or actively driving growth.
NRR and GRR Formulas
Here’s how to calculate these metrics:
Net Revenue Retention (NRR) starts with your monthly recurring revenue (MRR). Add revenue from upsells and cross-sells, subtract downgrades (contraction) and cancellations (churn), then divide by the starting MRR and multiply by 100:
(Starting MRR + Expansion – Contraction – Churn) / Starting MRR × 100
Gross Revenue Retention (GRR) measures how much of your original revenue you retain after accounting for contraction and churn, excluding any growth from upsells. It’s calculated as:
(Starting MRR – Contraction – Churn) / Starting MRR × 100
GRR stays capped at 100%, offering a clear snapshot of how well you’re holding onto your initial revenue. The gap between GRR and NRR (e.g., 90% vs. 115%) shows the contribution of expansion revenue. For support teams, GRR pinpoints retention challenges, while NRR highlights growth opportunities.
Industry Benchmarks for NRR and GRR
Benchmarks help set performance goals and guide strategy. For B2B SaaS companies, recent data shows that by 2025–2026, the median figures will hover around 91% GRR and 103% NRR [3]. However, these numbers vary depending on your customer base:
- Enterprise companies (average contract values above $100,000): ~97% GRR and 118% NRR
- SMB-focused companies (contract values under $10,000): ~86% GRR and 95% NRR [3]
Top-performing companies aim even higher, targeting GRR above 95% and NRR above 120% [2][3][4]. For instance, Snowflake consistently maintains an NRR between 140% and 160% [6]. Similarly, MapsPeople revamped their pricing strategy to reach 111% NRR, significantly boosting revenue from key customer segments [1].
For support teams, these benchmarks are critical. A GRR below 85% signals a significant retention issue that needs immediate attention. No amount of upselling can offset a weak base. Ideally, aim for 90%+ GRR, with enterprise teams striving for 95% or more [3][4][6].
Using Revenue Retention to Forecast Customer Lifetime Value
Revenue retention metrics play a vital role in projecting customer lifetime value (CLV). When NRR exceeds 100%, it means customers aren’t just sticking around – they’re spending more over time, leading to compounding revenue growth. Companies with NRR above 110% grow their revenue 2.5× faster than those with lower retention rates [6][7].
Here’s the formula for CLV:
LTV = (ARPA × Gross Margin %) / (Churn Rate – Expansion Rate)
When expansion outpaces churn (i.e., NRR > 100%), the effective churn rate drops, significantly boosting lifetime value. If expansion greatly exceeds churn, CLV can skyrocket, highlighting the potential for sustained growth [5].
"When NRR falls below 100%, you face a ‘leaky bucket’ problem where new customer acquisition must first compensate for declining base revenue before driving any growth." – Jordan Zamir, CEO, Turnstile [1]
For support teams, even small gains in retention can lead to exponential growth. Extending revenue from existing accounts amplifies CLV, proving that the true value of support lies far beyond traditional satisfaction metrics. It’s about driving measurable, long-term impact on your company’s bottom line.
How Support Operations Affect Revenue Retention
Support operations aren’t just about solving problems – they’re a critical driver of revenue retention and growth. Every customer interaction can influence renewals, upsells, and customer loyalty. On the flip side, poor support experiences can quickly lead to churn. Let’s dive into how specific operational strategies can directly impact revenue.
Faster Resolution Times Reduce Churn
Quick resolutions do more than keep customers happy – they help safeguard your revenue. For SaaS companies, downtime isn’t just inconvenient; it undermines the value customers expect from your product. The longer an issue drags on, the more customers question whether your solution is worth their investment.
Here’s the reality: 69% of customers say quick resolutions make for a positive service experience [8], while 73% are willing to switch to a competitor after repeated poor support experiences [9]. Even worse, 96% of customers say a single bad support interaction can destroy their loyalty [9].
"Customers don’t leave because your product is flawed – they leave because support is slow." – Secure Path Innovation [9]
Delays send a clear message: the customer isn’t a priority. Even small wait times can erode trust, but what matters even more is delivering a "first impactful reply" – a response that genuinely progresses the issue, not just an automated acknowledgment [10]. Companies using advanced support tools report resolution times that are 37% faster than those relying on basic systems [8]. Pairing this with AI-driven tools can boost revenue by 20–35% [9].
For context, average resolution times in B2B SaaS hover around 11.4 hours, with enterprise-level issues taking closer to 24.2 hours [8]. To tackle the most critical cases, focus on your P90 metric – the resolution time for the slowest 10% of tickets. These outliers often have the biggest impact on churn.
Fast resolutions are just the start. Proactive approaches can turn support into a growth engine.
Proactive Escalations Create Upsell Opportunities
Proactive escalations don’t just prevent churn – they open the door to growth. By spotting patterns in support tickets, teams can intervene before frustrations boil over and shift the conversation toward strategic opportunities.
Here’s how ticket trends can signal both risks and opportunities:
| Volume Pattern | CS Action | Timeline |
|---|---|---|
| 3× spike in 7 days | Executive sponsor check-in | Within 24 hours |
| 50% increase over 30 days | Deep-dive meeting to find root causes | Within 1 week |
| Zero tickets for 60+ days | Proactive engagement campaign | Within 1 week |
| Same issue >3 times | Escalate to product team for a fix | Within 48 hours |
By catching these signals early, support teams can shift from reactive problem-solving to offering solutions that drive upsells. For example, a customer with a surge in tickets might benefit from additional licenses or premium features. Similarly, recurring technical issues could present an opportunity to sell professional services or training. Proactive outreach can reduce churn by 20–30% [11].
Treating support data as a goldmine for customer insights allows teams to uncover challenges, spot usage trends, and identify areas for expansion. Every ticket becomes a chance to deepen the customer relationship.
Dynamic SLAs During Renewal Periods
Not all support interactions carry the same weight. A ticket submitted 90 days before renewal is far more critical than one filed mid-contract. Dynamic SLAs (Service Level Agreements) adjust response priorities based on factors like account value and renewal timing, ensuring key moments get the attention they deserve.
For enterprise customers with Annual Contract Values (ACVs) exceeding $100,000, hitting Net Revenue Retention (NRR) benchmarks of 110–120%+ is achievable through lower churn and expansion opportunities [1]. For these accounts, consider intervention playbooks with strict timelines, such as a 2-hour internal review followed by a 24-hour outreach from a Customer Success Manager.
A lack of support interactions for 60+ days can signal disengagement, triggering a proactive health check. Automated alerts for negative sentiment or low survey scores can also help prioritize high-value accounts. For instance, set thresholds like −35 sentiment for enterprise accounts and −45 for mid-market accounts to focus efforts where they’ll have the greatest revenue impact – especially in the critical 90 days before renewal.
These tailored approaches ensure your support operations are ready to integrate with advanced, AI-driven retention strategies. Every interaction matters, and the right response at the right time can make all the difference.
AI-Driven Methods to Improve Revenue Retention
AI-powered tools are reshaping customer support by identifying risks, reducing churn, and protecting revenue. By analyzing patterns that are otherwise easy to miss, these tools integrate seamlessly into support workflows to help businesses retain more revenue. Here’s how AI can make a difference.
AI Case Summaries Identify At-Risk Accounts
AI-driven case summaries go beyond simply recapping customer interactions. They analyze subtle changes in behavior – often referred to as "quiet drift" – that can signal disengagement using AI-driven sentiment analysis. Using natural language processing, these summaries scan communication channels like emails, Slack messages, tickets, and call recordings to detect tone changes, frustration, and warning signs like mentions of competitors or the exit of a key decision-maker.
These insights allow Customer Success Managers (CSMs) to focus on accounts based on sentiment trajectory rather than just ticket volume. For instance, AI can flag accounts with no support interactions for over 60 days, a sign of disengagement rather than self-sufficiency. Businesses using AI-driven analytics to manage deflection and retention have reported reducing churn by 20–30% [11].
"But if your QBRs are being done below the C-suite, you are four times more likely to churn a customer… maintaining engagement with the customer base, and in particular the C-suite on an ongoing basis is game changing." – Guy Rubin, Ebsta Founder [12]
To prioritize effectively, consider the Annual Recurring Revenue (ARR). A negative sentiment score on a high-value account should prompt immediate action, such as an executive sponsor check-in. Risk alerts generated by AI can also be integrated into CRMs or Slack, enabling CSMs to act without switching tools. Companies leveraging advanced churn prediction models have seen retention improvements of 5–10% [12].
Predictive CSAT and CES Scores Flag Churn Risk
Traditional surveys often miss the mark, as most customers don’t respond, leaving teams unaware of dissatisfaction until it’s too late. Predictive CSAT (Customer Satisfaction) and CES (Customer Effort Score) models solve this by analyzing all customer interactions – emails, chat logs, and calls – to generate sentiment scores even in the absence of survey responses.
For example, European fintech company IuteCredit partnered with Alterna CX in 2020 to implement an AI-based Voice of the Customer program. By analyzing open-text feedback, they flagged detractors early and achieved an 18-point NPS increase in one year. This led to actionable improvements, like extending branch hours and adding SMS notifications for loan contract updates [13].
Similarly, Aksigorta, an insurance firm, used AI to reduce complaints, achieving a 20+ point increase in NPS in 2021. Meanwhile, home improvement retailer Koçtaş processed customer feedback using machine learning, boosting NPS by 60% in nine months by addressing dissatisfaction in real time [13].
To make the most of these tools, set up automated workflows that create follow-up cases for detractors as soon as a low sentiment score is detected. Go beyond surveys by incorporating unstructured data from sources like social media and call transcripts to provide deeper context for CSAT and CES metrics [13].
AI-Generated Knowledge Base Content Reduces Support Load
Repetitive support tickets can overwhelm teams, slowing response times for high-priority accounts. AI-generated knowledge base articles address this by transforming resolved case histories into self-service content, allowing customers to resolve common issues on their own.
For example, Supportbench’s AI KB Article Creation feature uses past case communications to automatically generate articles with subject lines, summaries, and keywords. This ensures that the knowledge base stays up-to-date without requiring manual updates. On average, AI-powered self-service systems achieve 30% deflection rates, reducing the number of routine inquiries reaching support teams [11].
This approach not only lightens the load for support teams but also ensures that bots deliver accurate, current answers, minimizing errors or outdated information. Businesses implementing such systems have linked them to churn reductions of 20–30% [11]. Additionally, AI-driven case prioritization ensures that urgent issues are addressed promptly, further supporting revenue retention efforts.
Automated Case Prioritization and Escalations
Not all support tickets carry the same weight. AI-powered tools can prioritize tickets by analyzing text patterns, urgency, frustration markers, and account details like ARR, renewal dates, and support entitlements.
These tools can save significant time. For example, AI-enhanced escalation processes cut response times from 10–22 hours down to just 1–3 hours, saving up to 86% in cycle time [14]. Predictive models can also reduce total escalation rates by 45% and achieve 88% accuracy when trained on historical data [14].
Supportbench’s automation features take this further by prioritizing cases, tagging issues, and assigning them automatically. For low-confidence predictions, a human-in-the-loop approach ensures accuracy, with AI providing rationale and next-step suggestions for faster decision-making [14].
"By preventing surprises and accelerating resolutions, teams commonly preserve CSAT for at-risk accounts and protect renewal revenue tied to escalations." – The Pedowitz Group [14]
Embedding AI-driven cancellation flows into account settings allows for tailored solutions – like discounts or pause options – at the moment churn risk is identified. By speeding up resolutions, this approach directly supports revenue goals, making AI an essential tool for retention-focused support teams.
Tracking Support’s Impact on Revenue Retention
To understand how support influences revenue retention, it’s essential to connect traditional support metrics with financial outcomes. Start by monitoring leading indicators like Customer Satisfaction Score (CSAT) and Customer Effort Score (CES), which can help predict changes in lagging metrics such as Net Revenue Retention (NRR) and churn well before they occur [6][15]. Let’s take a closer look at the key performance indicators (KPIs) that highlight support’s financial contributions.
Key Support KPIs for Revenue Retention
Support teams should focus on three main categories of metrics to measure their role in retention:
- Efficiency metrics: These include First Response Time (FRT), Average Resolution Time (ART), and First Contact Resolution (FCR), which reflect how quickly and effectively the team resolves issues.
- Quality metrics: These capture the customer’s perspective using tools like CSAT, CES, and Net Promoter Score (NPS).
- Business impact metrics: These link support performance to financial outcomes, such as NRR, Gross Revenue Retention (GRR), and revenue influenced by support interactions [6][15].
Improving these metrics can significantly affect both costs and customer loyalty. For instance, every 1% improvement in FCR not only reduces operating costs by 1% but also boosts customer satisfaction by 1% [15]. CES stands out as being 1.8 times more effective than CSAT in predicting customer loyalty [15]. Additionally, customers who rate their CSAT at 4 or 5 are 80% more likely to renew, while 96% of those who face high-effort support interactions become disloyal compared to just 9% of those with low-effort experiences [15].
| Metric | Excellent Target | Good Target |
|---|---|---|
| First Response Time (Email) | < 4 hours | 4-12 hours |
| First Contact Resolution (FCR) | 70-80% | 60-70% |
| Customer Effort Score (CES) | 90-100% low effort | 80-90% low effort |
| CSAT | 80-90% | 70-80% |
| NPS | 50-70 | 30-50 |
Adding NRR and GRR to Support Dashboards
Integrating revenue retention metrics with support data requires pulling information from various sources like billing platforms (e.g., Stripe), CRMs, and support tools to track upgrades, downgrades, and customer satisfaction [6]. Monitoring NRR monthly can help identify trends, while using 3-month rolling averages smooths out fluctuations to reveal meaningful patterns [6].
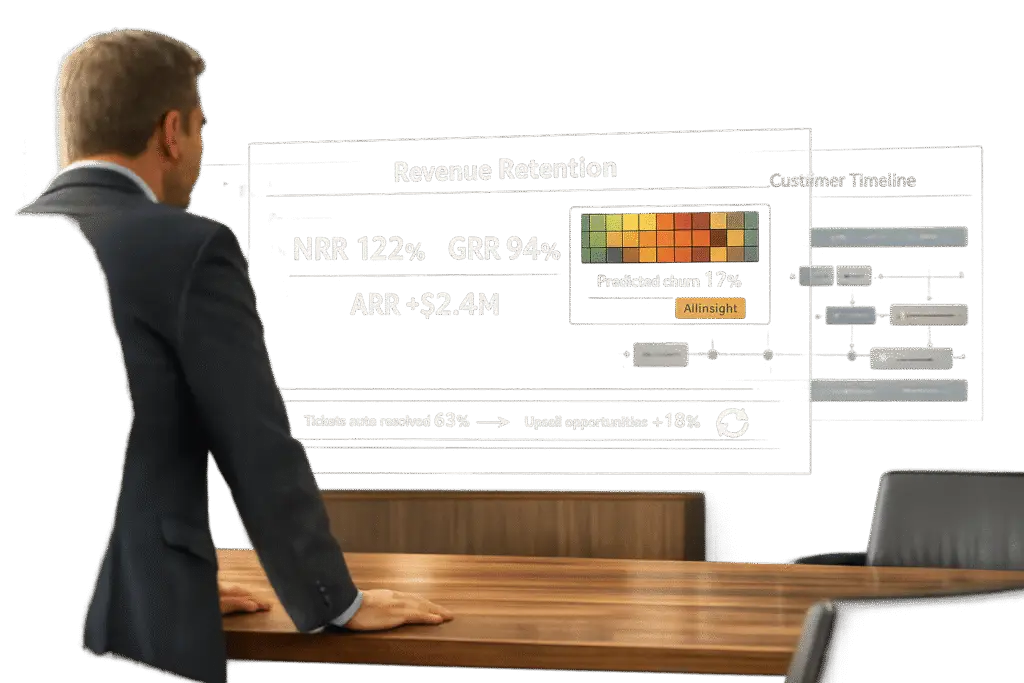
One essential metric to display is the NRR-GRR gap, which shows whether strong expansion revenue is masking churn issues. For example, if NRR is at 120% while GRR is only 85%, it’s a sign that expansion revenue is hiding a retention problem that needs immediate attention [6][1]. Segmenting metrics by customer size, industry, and Annual Contract Value (ACV) helps determine which groups need more personalized support [6].
Automated alerts can also play a critical role. For instance, a 50% weekly drop in logins could trigger immediate support intervention to prevent churn [1]. Additionally, tracking fields like expansion revenue or saved renewals attributed to support interactions highlights the direct financial impact of your team [15]. Monitoring "aha moments" – when customers first see the value of your product – can also help. Customers who reach this point quickly are far more likely to renew and expand their contracts [6].
Revenue Retention Benchmarks for Support Teams
Once dashboards are set up, it’s important to compare your performance against industry benchmarks. For GRR, the goal should be at least 95%, with the median sitting at 90% [2][6]. Before focusing on expansion revenue to boost NRR, address any retention issues – this is often referred to as the "leaky bucket" rule [6].
NRR benchmarks vary depending on the stage of the company and customer segment. For early-stage companies ($1M-$3M ARR), median NRR typically falls between 94-98%, while mature companies ($30M+ ARR) often achieve 106-110% [6]. In 2025, B2B AI companies reported a median NRR of 106%, with top performers exceeding 120% [2]. This metric is crucial because SaaS companies with high NRR grow 2.5 times faster than those with lower NRR [6].
| Performance Level | NRR Range | Business Implication |
|---|---|---|
| Excellent | 120%+ | Best-in-class; high compounding growth |
| Good | 106-115% | Solid baseline; expansion offsets churn |
| Fair | 100-105% | Maintaining revenue; limited expansion |
| Poor | Below 100% | Revenue shrinking; immediate action needed |
Customer segments also influence benchmarks. For example, SMB accounts ($0-$5K ACV) typically achieve 95-100% NRR, while Enterprise accounts ($100K+ ACV) can reach 110-115% [6]. Different goals should be set for each segment rather than applying a one-size-fits-all approach. Companies using autonomous AI support agents report 20-40% faster resolution times and 15-25% higher CSAT scores, which directly contribute to better retention rates [6].
Conclusion
Revenue retention has become the key metric for measuring and funding support operations. As Jegan Selvaraj explains, "Traditional support models punish growth because scaling revenue requires scaling headcount. AI breaks this cost curve by handling unlimited support volume at near-zero marginal cost" [16]. With AI-driven chat costing between $0.03 and $0.50 per interaction – compared to $3 to $6.50 for human-led interactions [16] – support shifts from being a financial drain to a driver of strategic growth.
To make this transformation, operational adjustments are essential. Align your support function with Revenue Operations or the Chief Revenue Officer (CRO) to ensure KPIs focus on pipeline and retention rather than just cost [17]. Replace outdated metrics like Average Handle Time with ones that reflect AI’s impact, such as Ticket Deflection Rate via AI, Impact on NRR, and Saved Cancellations [11][16]. Equip your agents with AI-driven customer support tools for complete context – currently, 33% of agents lack sufficient information when resolving issues [18] – and automate low-value tasks so they can prioritize activities that directly influence retention.
The financial upside of these changes is clear. AI-powered deflection systems reduce churn by 20% to 30% [11], while personalized AI-driven support can increase revenue by up to 40% [16]. Moreover, conversational AI is expected to cut contact center labor costs by $80 billion by 2026 [17]. Incorporate metrics like NRR and GRR into your dashboards to ensure expansion revenue isn’t masking churn. Prioritize First Call Resolution – a 1% improvement in this area leads to a 1% gain in cost efficiency and customer satisfaction [17]. Leverage AI to monitor real-time sentiment, spot at-risk accounts before they churn, and identify upsell opportunities during routine support interactions. These proactive strategies turn your support team into a growth engine, transforming every customer interaction into a chance to drive revenue and retention.
FAQs
What’s the difference between NRR and GRR for support teams?
The main distinction between Net Revenue Retention (NRR) and Gross Revenue Retention (GRR) lies in what they measure.
- GRR focuses on the percentage of revenue retained from existing customers without accounting for any additional revenue from upselling or cross-selling. It maxes out at 100%, making it a pure indicator of how well a company retains its existing revenue base.
- NRR, on the other hand, factors in both retention and revenue growth from existing customers, such as upsells and cross-sells. Because of this, NRR can exceed 100%, providing a broader view of customer-driven growth.
In short, GRR is a measure of retention strength, while NRR highlights the combined impact of retention and growth efforts, giving credit to the teams driving expansion.
How can support prove it directly improved revenue retention?
Support teams play a key role in keeping customers happy and loyal, and they can prove their value by tracking metrics such as Customer Retention Rate (CRR), Gross Revenue Retention (GRR), and Net Revenue Retention (NRR). These numbers help show how well the team is maintaining customer relationships and contributing to long-term revenue.
To take it a step further, using multi-touch attribution models, like U-shaped or W-shaped frameworks, can link support activities directly to financial results. These models track how different interactions – like resolving issues or offering proactive help – impact the customer journey.
Another way to highlight the team’s influence is by integrating support data into CRM systems. This connection allows businesses to see how actions such as faster problem-solving or timely escalations lead to greater customer loyalty and more recurring revenue. It’s a practical way to tie support efforts to measurable financial outcomes.
Which AI workflows most impact churn before renewals?
AI workflows aimed at reducing churn before renewals prioritize identifying risks early and taking action before it’s too late. Techniques like predictive analytics, customer health scoring, and sentiment analysis play a big role in spotting accounts that may be at risk – often 30 to 90 days before their renewal date.
Key warning signs include things like reduced platform usage, fewer logins, or a spike in support tickets. By tracking these signals, teams can focus their efforts on the accounts that need attention the most. This might involve personalized outreach, offering tailored support, or addressing specific concerns to keep customers engaged.
One particularly effective approach is using health scoring models. These models combine behavioral data (like how often a customer uses the product) with transactional data (such as payment history) to give a clearer picture of customer satisfaction and loyalty. This way, teams can act strategically to improve retention.