

Retention metrics are the backbone of renewal-focused teams. They help predict customer behavior, measure revenue retention, and identify risks early. Key takeaways:
- Retention drives growth: Companies with retention rates over 85% grow 1.5–3x faster.
- Core metrics to track: Gross Revenue Retention (GRR), Net Revenue Retention (NRR), Customer Retention Rate (CRR), and churn rate.
- NRR benchmarks: Top SaaS companies aim for 110%+ NRR, while startups typically start around 79%.
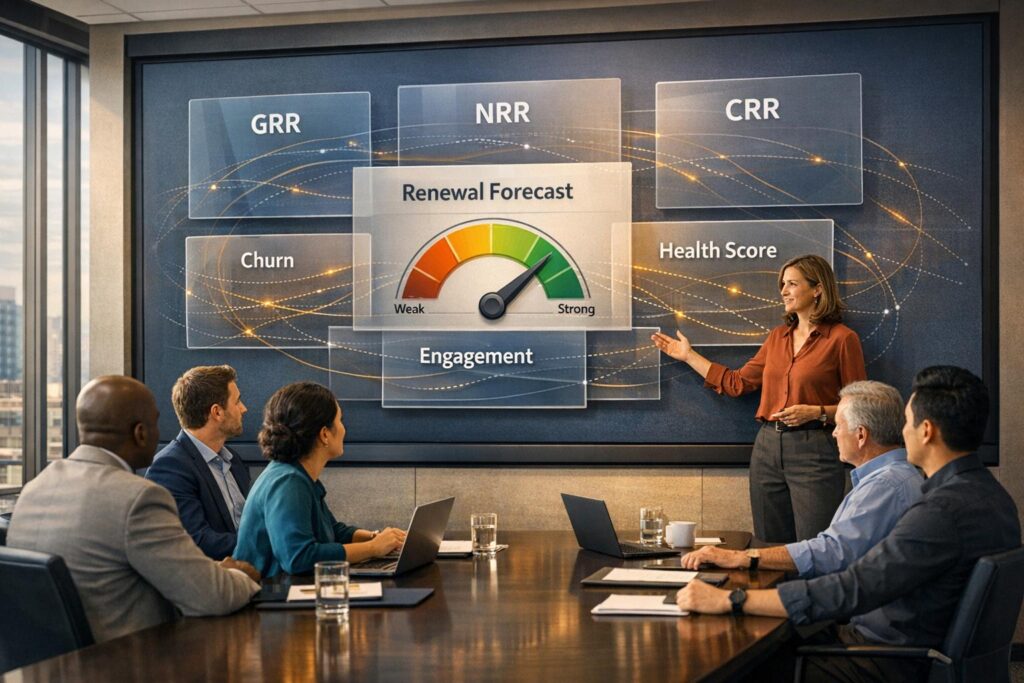
- Early warning indicators: Customer Health Scores, product adoption rates, and engagement metrics like DAU/MAU ratios predict renewal outcomes.
- Cost efficiency: Retaining a customer costs 1/5 of acquiring a new one, and a 5% retention boost can increase profits by 25–95%.
Retention metrics connect daily operations to revenue growth, guiding teams to act before customers churn. Start with basic metrics like CRR and GRR, then expand into predictive tools for deeper insights.
How to Tackle Your Retention Problem | SaaS Metrics School | Retention
Core Retention Metrics Every Renewal Team Should Track
Essential Retention Metrics for SaaS Renewal Teams: Formulas and Benchmarks
Renewal teams depend on specific metrics to understand customer retention, loss, and revenue trends. These metrics generally fall into two categories: those that focus on customer behavior and those that highlight revenue impact. Together, they offer a comprehensive view of your customer base’s overall health. Let’s dive into the essential metrics every renewal team should keep an eye on.
GRR, CRR, and Churn Rate
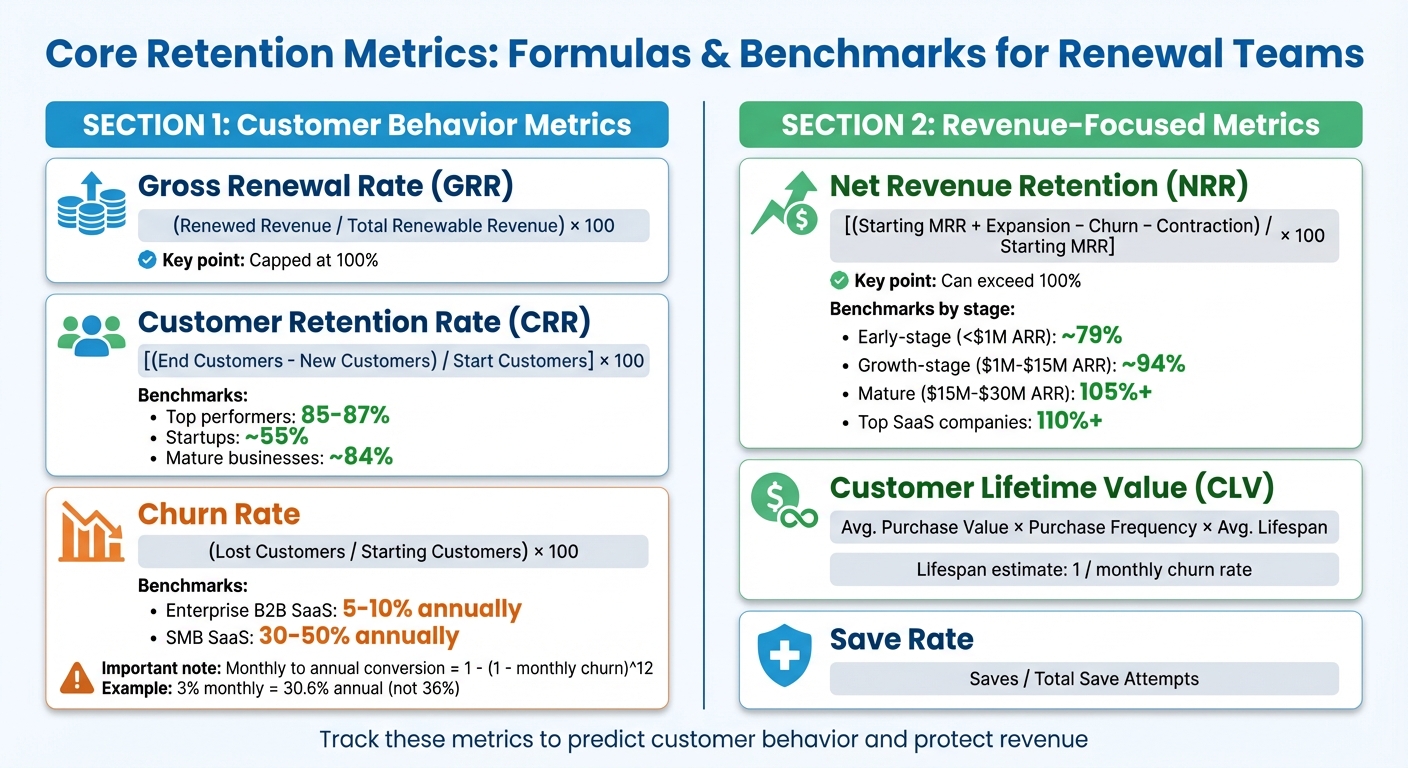
Gross Renewal Rate (GRR) is a key metric for understanding how much renewable revenue you’re retaining, excluding any upsells or cross-sells. It’s calculated as:
(Renewed Revenue / Total Renewable Revenue) x 100
Since GRR doesn’t include expansion revenue, it provides a straightforward view of your ability to retain core product revenue. GRR is capped at 100%, making it a reliable indicator of pure retention [5].
Customer Retention Rate (CRR) measures how many customers stick around over a specific period. To calculate it, subtract any newly acquired customers during the period from the total number of customers at the end, divide by the starting customer count, and multiply by 100. Top-performing companies maintain retention rates of 85–87%, while startups often hover around 55%, and mature businesses average about 84% [4].
Churn Rate measures the percentage of customers lost during a given period. It’s calculated by dividing the number of lost customers by the total starting customer count, then multiplying by 100. For enterprise B2B SaaS companies, annual churn rates typically range between 5–10%, while SMB SaaS businesses may see churn rates as high as 30–50% [5]. To dig deeper, segment churn by factors like customer size, industry, or acquisition channel to uncover specific problem areas.
When working with monthly churn, don’t forget to annualize it using this formula:
1 - (1 - monthly churn)^12.
For example, a 3% monthly churn rate translates to roughly 30.6% annual churn – not 36% [5].
Now, let’s shift from customer behavior metrics to those that focus on revenue retention and growth.
NRR and CLV: Revenue-Focused Metrics
Revenue-focused metrics like NRR and CLV provide a clear picture of both retention health and growth opportunities.
Net Revenue Retention (NRR) is widely considered the gold standard for measuring revenue health from existing customers. It accounts for expansion revenue while factoring in churn and downgrades. The formula is:
[(Starting MRR + Expansion - Churn - Contraction) / Starting MRR] x 100
Unlike GRR, NRR can exceed 100%, which means your expansion revenue is outpacing losses. Leading SaaS companies often aim for an NRR of 110% or higher [5].
NRR benchmarks vary by company size and stage. For instance:
- Early-stage startups (under $1M ARR): ~79%
- Growth-stage companies ($1M–$15M ARR): ~94%
- Mature businesses ($15M–$30M ARR): often 105% or higher [8].
Customer Lifetime Value (CLV) estimates the total revenue a customer generates over their relationship with your business. To calculate CLV, multiply the average purchase value by purchase frequency and then by the average customer lifespan [6][7]. You can estimate the average lifespan using:
1 / monthly churn rate [5].
Segmenting CLV by customer cohorts can help pinpoint whether revenue changes stem from declining customer value or shorter engagement periods [2].
| Metric | Formula | Insight Provided |
|---|---|---|
| Customer Churn Rate | (Lost Customers / Starting Customers) x 100 | Percentage of customers lost [5] |
| Net Revenue Retention (NRR) | [(Starting MRR + Expansion - Churn - Contraction) / Starting MRR] x 100 | Revenue growth from existing customers [5] |
| Customer Lifetime Value (CLV) | Avg. Purchase Value x Purchase Frequency x Avg. Lifespan | Total revenue from a customer relationship [6] |
Another important metric to track is your Save Rate, which measures how successful your team is at retaining at-risk accounts. It’s calculated as:
Saves / Total Save Attempts [5].
Using an AI-driven platform like Supportbench (https://supportbench.com) can make tracking these metrics easier. With the right tools, your team can focus on improving customer success and fine-tuning your renewal strategies.
Leading Indicators That Predict Renewal Outcomes
Lagging metrics like churn rate tell you what’s already happened, but leading indicators give you a glimpse into the future. They show whether customers are finding value and forming habits that contribute to retention. By closely monitoring these signals – such as health scores, feature adoption, engagement metrics, and financial patterns – you can act swiftly to influence renewal outcomes.
Customer Health Scores and Product Adoption Rates
Customer Health Scores (CHS) combine various signals into a single metric that helps predict whether a customer is likely to renew. These scores pull data from product usage, support interactions, CRM milestones, and NPS surveys to create a real-time risk assessment. If a health score drops, it’s a clear call to action – whether that’s a personal outreach from a Customer Success Manager or an automated re-engagement effort [3].
Product adoption rates are another critical indicator. This metric tracks how many customers are actively using the product’s core features. The formula is simple: Adoption = (users of the feature / total users) x 100 [2]. High adoption rates suggest that the product has become part of the customer’s routine, which is a good sign for retention. On the other hand, low adoption rates can indicate that customers haven’t fully realized the product’s value, putting them at risk of churning.
Days Sales Outstanding (DSO) – the time it takes for customers to pay their invoices – offers another layer of insight. When payments slow down, it can signal that your product is no longer a priority for the customer. This can complicate renewal discussions and should be factored into your strategy [1]. Combining financial data with usage metrics can give you a clearer picture of potential risks.
| Metric | What It Predicts | Why It Matters in B2B |
|---|---|---|
| DAU/MAU Ratio | Product Stickiness | High ratios show the product is essential |
| Feature Adoption | Value Realization | Low adoption signals higher churn risk |
| Customer Health Score | Renewal Likelihood | Acts as an early warning system |
| Days Sales Outstanding | Customer Priority | Late payments suggest de-prioritization |
While health scores and adoption rates are key, engagement metrics provide even deeper insights into customer loyalty.
Engagement Metrics: MAU, DAU, and First-Year Retention
Monthly Active Users (MAU) and Daily Active Users (DAU) track how often customers use your product. The DAU/MAU ratio, often referred to as "stickiness", measures whether your product is a daily necessity or just an occasional tool. A higher ratio indicates consistent reliance on your product, which strongly correlates with customer retention.
But what defines an "active" user? It depends on your product. For some, it might be as simple as logging in; for others, it could mean completing a meaningful action. Once you’ve defined this, you can set benchmarks and trigger re-engagement campaigns when activity drops below them [2]. For example, if a user’s logins fall from 15 times a month to just 3, it’s time to act.
First-year retention is especially crucial for B2B SaaS companies. The first 12 months often determine whether a product fits the customer’s needs. Key activation milestones during the first 30–90 days can reveal early signs of value realization [3]. Companies with retention rates above 85% tend to grow 1.5 to 3 times faster than their competitors [4]. By keeping a close eye on engagement trends, teams can step in before renewal risks escalate.
Platforms like Supportbench (https://supportbench.com) integrate health scoring and engagement tracking into their case management tools. This allows support teams to detect declining activity early and address at-risk accounts well before renewal dates. With this proactive approach, early warning signs can translate into effective, timely interventions.
sbb-itb-e60d259
How to Build a Retention Metrics Framework
Creating a retention metrics framework doesn’t have to be overwhelming. Start with the essentials and gradually expand. Trying to track every metric all at once can lead to confusion and inefficiency. Instead, take a phased approach – this builds momentum, demonstrates value, and helps secure support for more advanced analytics later. A well-structured framework allows you to take proactive steps to improve customer retention and renewal outcomes.
3-Phase Implementation Approach
Phase 1 focuses on the fundamentals: Customer Retention Rate (CRR), Gross Revenue Retention (GRR), and churn rate. These core metrics give you a clear picture of how many customers are sticking around and how much revenue you’re keeping. Assign specific ownership for these metrics – Customer Success teams often handle CRR and Net Promoter Score (NPS), while Product teams track adoption rates and analyze reasons for churn [6]. You can also group customers by their onboarding month to pinpoint when in the lifecycle drop-offs are most likely to occur.
Phase 2 adds depth with Customer Lifetime Value (CLV) and segmentation. Break your retention data into meaningful categories like plan type, region, acquisition channel, or industry. This segmentation helps you identify your most valuable customer groups [3][4]. At this stage, refining your Ideal Customer Profile (ICP) becomes crucial, ensuring you focus your resources on accounts that contribute the most revenue.
Phase 3 incorporates predictive analytics. Use Customer Health Scores to combine insights from product usage, support interactions, and customer sentiment. These scores help you anticipate churn before it happens [3][10]. Advanced tools now use AI to shift from reactive reporting to real-time monitoring, flagging friction points that could lead to churn [9]. This predictive approach supports your overall goal of improving renewals and customer satisfaction.
Platforms That Simplify Retention Tracking
Once your framework is established, integrated platforms can make retention tracking much easier. Relying on spreadsheets or disconnected tools often leads to errors, delays, and missed opportunities. Modern platforms combine product analytics with CRM data, offering real-time insights into account health [3][10].
Take Supportbench (https://supportbench.com) as an example. It embeds AI into case management and customer insights, enabling teams focused on renewals to track engagement, predict outcomes like CSAT and CES, and monitor dynamic health scores – all in one place. Features like predictive analytics, automated quality management, and 360-degree customer views come standard. This setup minimizes costs and allows teams to take action before churn occurs, without needing IT support for setup or maintenance.
Automated reporting further simplifies the process by consolidating data from various sources, ensuring metrics stay up to date. Platforms that sync product usage data with CRM tools like HubSpot or Salesforce provide a comprehensive view of each customer. This makes it easier to identify trends and respond quickly, helping your retention framework deliver real results.
Using Metrics to Improve Renewal Outcomes
Retention metrics are only as valuable as the actions they inspire. By tapping into AI-driven insights from platforms like Supportbench, you can take targeted, cost-efficient steps to address potential risks early and customize renewal strategies to match the unique needs of each customer segment.
Intervening Before Customers Churn
Customer churn rarely happens without warning. Red flags like reduced login activity, fewer active users, or stalled onboarding processes often signal trouble ahead. A well-designed customer health score combines data from product usage, support interactions, CRM milestones, and NPS feedback to create a real-time view of churn risk.
Set clear engagement benchmarks for your customers. If activity dips below these thresholds, act quickly. For instance, if a daily user suddenly becomes inactive for a week, it’s time to reach out. Similarly, monitor how customers adopt key features. If certain groups aren’t using critical tools, provide targeted guidance to highlight the product’s value.
Payment delays can also be a sign of trouble. A high Days Sales Outstanding (DSO) might indicate that a customer is deprioritizing your service. Likewise, when a customer gives a low NPS or CSAT score, it’s essential to follow up personally to address their concerns before they consider leaving. Platforms like Supportbench integrate these alerts into case management workflows, making it easier to spot and address accounts that are starting to drift.
Once early warning systems are in place, the next step is fine-tuning your renewal strategies based on the specific needs of different customer segments.
Tailoring Renewal Strategies by Customer Segment
Not all customers are created equal, and their renewal strategies shouldn’t be either. Metrics like Customer Lifetime Value (CLV) and health scores help you prioritize efforts, ensuring that accounts with the most financial impact get the attention they deserve. Group customers into categories like "at-risk", "needs attention", and "healthy" to apply tailored strategies for each.
For example, promote features that are proven to drive engagement and longer session times to low-engagement users in specific segments. If a customer downgrades their service package, treat it as a warning sign of potential churn and respond with additional support or incentives to re-engage them.
Tracking retention by cohort – such as customers in their first 90 days – or by segment (like industry or team size) can reveal patterns in who’s struggling. When retention metrics dip, dig deeper by reviewing exit surveys and support tickets to uncover the root causes. Combining predictive data with qualitative insights allows you to create renewal strategies that resonate with the needs and challenges of each customer group.
Conclusion
Retention metrics are at the heart of every effective renewal strategy. Companies with retention rates exceeding 85% grow 1.5 to 3 times faster than their competitors [4]. Plus, existing customers are 50% more likely to try new products compared to those who are new to the brand [1]. These metrics do more than just track performance – they connect the dots between everyday support activities and long-term business goals, helping teams demonstrate ROI while safeguarding revenue. By shifting from reactive to proactive relationship management, businesses can use these indicators to intervene before customers decide to leave.
Take Customer Health Scores, for example. Unlike reactive metrics like churn rate, these early warning signals give teams the chance to act before issues escalate. It’s about turning data into actionable insights that can make a real difference.
"Retention metrics are the bridge between daily operations and strategic decisions." – Alberto Incisa, Product and Growth at June [3]
The best part? Building an effective retention framework doesn’t require a huge investment in tools or additional staff. Supportbench (https://supportbench.com) simplifies the process by integrating AI-powered retention tracking directly into case management workflows. It automates alerts for critical issues like usage declines, payment delays, or negative sentiment. With built-in predictive CSAT and CES scoring, teams can quickly identify at-risk accounts and focus their efforts where they’ll have the greatest financial impact – all without the hassle of juggling multiple platforms or paying for expensive add-ons.
The secret is to start small. Focus on tracking two or three key metrics, such as Customer Retention Rate (CRR) and Net Revenue Retention (NRR), to establish a solid baseline. As your framework evolves, you can incorporate predictive insights to fine-tune your approach. When retention becomes a core part of your operations, it lays the groundwork for the stability and loyalty that fuel long-term growth. These practices are your foundation for sustainable success.
FAQs
What’s the difference between Gross Revenue Retention (GRR) and Net Revenue Retention (NRR)?
Gross Revenue Retention (GRR) measures the percentage of recurring revenue you keep from your existing customers, without factoring in any upsells or expansions. This metric focuses strictly on the revenue left after accounting for losses due to customer churn or downgrades.
Net Revenue Retention (NRR), on the other hand, takes a broader view. It includes not just the losses from churn and downgrades but also the additional revenue from upsells and expansions. This gives a clearer picture of how much your revenue is growing (or shrinking) within your current customer base.
Both GRR and NRR are crucial metrics for renewal-focused teams. They help track customer retention while also pointing out where there’s room for revenue growth.
How do Customer Health Scores help predict renewal rates?
Customer Health Scores offer a powerful way to predict renewal rates by giving a clear picture of a customer’s satisfaction and engagement levels. These scores are usually based on a mix of metrics, such as how often a product is used, interactions with support, survey feedback, and overall account activity. Together, they help gauge whether a customer is likely to stick around or move on.
Tracking trends in these scores allows renewal-focused teams to spot accounts that might be at risk. This enables them to take action early – whether through outreach or resolving issues – before small problems grow into major ones. Using this data-driven method not only helps safeguard revenue but also builds stronger, more enduring customer relationships.
Why is retaining existing customers more cost-effective than acquiring new ones?
Retaining customers is much cheaper than trying to win over new ones – studies show it can cost five to 25 times more to acquire a new customer. Plus, existing customers are more likely to buy from you again, need less support, and deliver better profit margins.
Loyal customers also form deeper connections with your brand. They’re more inclined to stick around, renew their services, and even recommend your business to others. Prioritizing retention doesn’t just save money; it creates lasting value and strengthens the foundation of your business.