


Support teams often struggle to prove their financial impact, especially as leadership demands clear ROI. With AI now resolving the majority of basic tasks, human agents are expected to deliver measurable results tied to customer retention and growth. The challenge? Oversimplified attribution models can distort the true value of support efforts. This guide breaks down how to connect support activities to revenue outcomes using meaningful metrics, multi-touch attribution models, and AI-driven tools. Here’s what you’ll learn:
- Key Metrics to Track: Focus on retention, expansion, and efficiency. Metrics like Customer Retention Rate (CRR), Customer Lifetime Value (CLV), and churn rates are vital.
- Attribution Models That Work: Move beyond single-touch models to multi-touch frameworks like U-shaped or W-shaped attribution for a clearer picture of support’s impact.
- AI’s Role in Revenue Tracking: AI tools can predict churn, prioritize high-value accounts, and identify growth opportunities through sentiment analysis and predictive modeling.
- Incrementality Testing: Use control groups to separate correlation from causation and validate your attribution models.
- Unified Data Systems: Integrate support data with your CRM for a complete view of customer interactions and revenue impact.
Revenue Metrics That Support Teams Should Track
Which Metrics Actually Matter
When it comes to revenue metrics for support teams, focus on three main areas: retention, expansion, and efficiency.
Start with Customer Retention Rate (CRR), which tells you the percentage of customers who stick around over a specific time frame. To calculate it, subtract new customer acquisitions from your end-period customer count, then divide by the starting customer count. Why does this matter? A 5% bump in retention can lead to at least a 25% increase in profits.
Next, there’s Customer Lifetime Value (CLV) – a metric that predicts the total revenue a customer brings over their relationship with your business. You calculate it by multiplying average purchase value by purchase frequency, then multiplying that by the average customer lifespan. Support teams play a huge role here by keeping customers around longer and encouraging repeat purchases. A strong business typically aims for a 3:1 ratio of CLV to Customer Acquisition Cost (CAC).
Keep an eye on Customer and Revenue Churn Rates too. Churn is a clear sign of trouble. As Scribe‘s Customer Success Lead explains:
"Churn is the ultimate indicator of a failure to retain customers. The impact of a customer churning is not just the loss of current revenue, but also all of their potential expansion revenue".
Other key metrics include Existing Customer Revenue Growth Rate, which tracks upsells and cross-sells often sparked during support interactions, and Customer Effort Score (CES), which measures how easy it is for customers to resolve their issues. Lower effort scores are linked to higher loyalty and lower churn.
Once you’ve identified these metrics, the challenge is figuring out which support actions directly affect revenue.
Separating Correlation from Causation
It’s easy to assume that a customer renewing their subscription after contacting support means the support interaction caused the renewal. But to prove support’s true impact on revenue, you need to dig deeper and test what happens without those interventions.
Cohort analysis can help. Compare groups of customers who received specific support interactions with those who didn’t. For example, do customers who contact support in their first month stick around longer than those who don’t?
You can also run incrementality experiments using control groups. For instance, test whether cutting response times actually boosts retention. A fascinating case: cart-abandonment emails had a 15.5% conversion rate. But when compared to a control group that didn’t receive the emails, the actual incremental lift was just 1.3 percentage points.
Finally, combine 30-day sentiment trends with ticket volume and product usage data to create predictive churn models. These models can flag high-risk accounts, giving your team a chance to step in before it’s too late.
How Support Activities Affect Each Customer Journey Stage
Multi-Touch Attribution Models for Support Teams: U-Shaped vs W-Shaped
Support’s Role at Each Journey Stage
Support plays a crucial role in shaping the customer journey, and tracking its impact can reveal how your team contributes to revenue growth.
During the onboarding phase (typically the first 30–90 days), a spike in support tickets often signals friction in the customer experience. Monitoring metrics like Time-to-Value and Activation percentage can uncover whether customers are struggling to get started. Delays here can push back revenue recognition and increase the risk of early churn.
As customers transition to the adoption phase, support queries often focus on specific features. These interactions can highlight underused capabilities. By tracking metrics like Adoption Depth and Feature Usage, you can identify opportunities for growth. Customers who use more features tend to generate a higher Average Revenue Per User (ARPU).
In the retention stage, support data becomes a key indicator of churn risk. High ticket volumes, negative sentiment, or even prolonged inactivity (no support contact for 60+ days) can signal at-risk accounts. Research shows that 96% of customers who encounter high-effort support interactions are likely to become disloyal. If a customer’s ticket volume triples within a week, initiating an executive-level check-in within 24 hours can help mitigate churn. Beyond just retaining customers, support can also uncover growth opportunities during this stage.
When it comes to expansion, tools like AI-driven sentiment analysis can pinpoint enthusiastic customers – those most likely to respond positively to upsell offers or referral programs. The language these "champion advocates" use in support interactions often reveals their readiness to invest further.
Using Multi-Touch Attribution Models
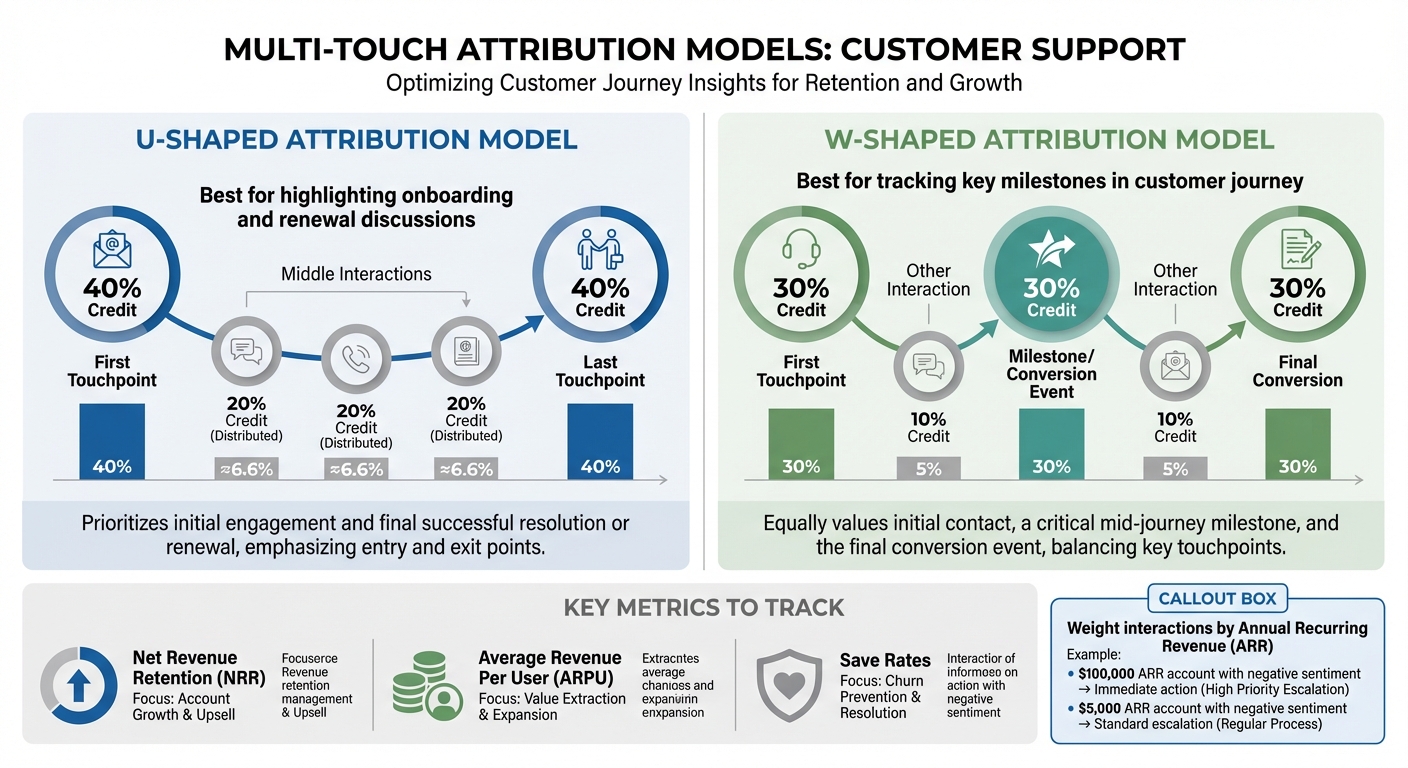
To fully understand support’s influence across the customer journey, you need the right attribution model. Single-touch attribution, which credits only one interaction, often misses the broader impact of support. Multi-touch attribution, on the other hand, spreads credit across various touchpoints, offering a more comprehensive view.
In a U-shaped attribution model, 40% of the credit is assigned to both the first and last touchpoints, with the remaining 20% distributed among the middle interactions. This setup highlights support’s role in both early onboarding and final renewal discussions.
A W-shaped attribution model adds another key interaction – usually a milestone or conversion event. It allocates 30% of the credit to the first touchpoint, 30% to the milestone, and 30% to the final conversion, with the remaining 10% spread across other interactions.
These models help tie support interactions to critical revenue metrics like Net Revenue Retention, ARPU, and save rates. For example, when applying these models, weighting interactions by the account’s Annual Recurring Revenue (ARR) allows you to prioritize actions. A negative sentiment score from a high-value account (e.g., $100,000 ARR) should prompt immediate action, while a similar score from a smaller account (e.g., $5,000 ARR) might follow standard escalation protocols.
Using AI to Track and Predict Revenue Impact
AI-Powered Metrics and Predictions
AI is reshaping how businesses track and predict revenue outcomes by offering precise insights that go beyond traditional attribution methods.
Modern AI tools analyze every customer interaction, picking up on subtle signals like competitor mentions, urgency, or changes in tone that can impact revenue. These systems provide real-time conversation scoring, which is far more accurate than manual sampling for calculating ROI.
For example, predictive churn modeling combines customer sentiment from support interactions with metrics like product usage (e.g., logins or feature adoption) and contract details (such as ARR and renewal dates). This approach assigns a probability score for potential revenue loss. AI can even detect early signs of dissatisfaction, such as formal language, shorter replies, or passive-aggressive phrasing, which often hint at impending churn.
Some platforms, like Supportbench, take this further with features like AI Predictive CSAT and AI Predictive CES, which estimate customer satisfaction and effort scores before surveys are sent. This allows teams to address at-risk accounts proactively. Additionally, tools like AI First Contact Resolution detection (FCR) analyze historical case patterns to flag cases resolved in a single interaction, streamlining support efforts.
Automating Attribution Tracking
AI doesn’t just predict outcomes – it also simplifies attribution tracking.
By analyzing support interactions, AI-powered workflows can determine their impact on revenue. These systems monitor trends like 30-day sentiment averages compared to baseline levels, enabling businesses to identify declining customer relationships before they affect renewals. This proactive approach is far superior to reacting to isolated negative feedback.
Sentiment-weighted prioritization is another game-changer. Instead of the outdated "first-come, first-served" model, AI assesses sentiment scores alongside account value (ARR). For instance, a negative sentiment score from a $500,000 account triggers a different response than the same score from a $5,000 account. If a high-value account records a -40 sentiment score, the system can initiate an executive-level check-in within 24 hours. AI also flags accounts with no support activity for over 60 days, as prolonged silence can indicate disengagement rather than satisfaction.
AI doesn’t stop at risk detection – it also identifies growth opportunities. By analyzing language in support interactions, it can spot "champion advocates" who display enthusiasm, adopt features more frequently, or mention competitors. These signals automatically route Customer Success Qualified Leads (CSQLs) to sales teams, turning support data into actionable growth opportunities [10, 11].
These capabilities demonstrate how AI-driven workflows can directly impact revenue.
Practical Examples of AI in Action
The real-world impact of AI is evident in several success stories:
- In May 2025, an e-commerce giant using Intercom’s AI platform cut its cost per contact by 62% and achieved a 285% ROI within three years. The initial investment was recouped in just seven months.
- Okta boosted renewals by 13% through a proactive Customer Success strategy. By using AI to spot low adoption patterns, they could intervene early and prevent accounts from becoming at risk.
- Omnicell improved on-time renewals by 30% by leveraging AI-powered dashboards that enhanced collaboration between their Renewals and Customer Success teams.
- In August 2025, data.world utilized AI-driven risk signals and automated playbooks integrated with tools like Gong, Jira, and Slack. This approach helped them protect 15% of ARR and eliminate churn within a single quarter.
"AI should tell me which accounts need my attention today – whether it’s risk signals or expansion potential." – Gainsight Essential Guide
The most impactful AI implementations focus on measurable outcomes, such as increased deal sizes from upsells identified by AI or higher renewal rates driven by AI insights. These tangible results highlight AI’s ability to influence revenue far more effectively than traditional metrics like ticket volume or response times.
sbb-itb-e60d259
Setting Up Data Systems for Revenue Tracking
Connecting Support Data with Your CRM
To effectively track revenue, you need to bring together data from various sources – product usage, account profiles, contracts, invoices, and support interactions – into your CRM. Without this integration, understanding how support impacts retention or expansion becomes nearly impossible.
Your CRM should work seamlessly with support, marketing, and ERP systems. Imagine a customer success manager opening an account and instantly seeing everything they need: recent support tickets, sentiment scores, product adoption metrics, and upcoming renewal dates. This comprehensive view helps teams make smarter decisions about where to focus their efforts.
It’s also crucial to maintain clean and accurate customer data. Research shows that while 87% of revenue leaders feel pressured to adopt AI, poor data quality is the main reason many of these initiatives fail.
The good news? Modern platforms now integrate support data directly with CRMs, cutting out the need for costly middleware or custom solutions. For example, dynamic service-level agreements (SLAs) can automatically adjust based on revenue-critical events – like a $500,000 account nearing renewal – by pulling in contract data directly into support workflows.
With all this unified data, you can create dashboards that clearly connect support activities to revenue outcomes.
Building Dashboards That Show Revenue Impact
Once your CRM is set up correctly, you can build dashboards that link support actions to revenue. The key is to balance leading indicators (e.g., AI adoption rates, sentiment trends, response times) with lagging indicators (e.g., retention rates, upsell conversions, revenue influenced by support). Leading indicators show where you’re headed, while lagging indicators confirm the results of your efforts.
Instead of tracking everything, focus on one to three metrics that align directly with revenue goals. For B2B support teams, the most impactful metrics often include:
- Retention rate by support engagement level
- Expansion pipeline influenced by support interactions
- Sentiment-weighted case volume by account value
It’s also important to weight these metrics by account value. For instance, a negative sentiment score from a $500,000 account should trigger different alerts than one from a $5,000 account. Your dashboard should highlight accounts where support signals – like sentiment or ticket volume – indicate risk or opportunity based on annual recurring revenue (ARR), not just the number of tickets.
Proactive monitoring is equally important. Set up alerts for "silent accounts" – those with no support activity for 60+ days. This lack of engagement often signals a problem, not satisfaction, and high-performing teams now consider this type of monitoring standard practice.
| Indicator Type | Metric Examples | Business Purpose |
|---|---|---|
| Leading | AI usage frequency, sentiment trends, response times | Predicts if support activities align with revenue goals |
| Lagging | Retention rate, expansion pipeline, revenue influenced | Confirms the business outcomes of support efforts |
Once these dashboards are in place, dynamic SLAs can help you prioritize actions for accounts that matter most.
Setting Dynamic SLAs Based on Revenue Events
Static SLAs treat all customers the same, but dynamic SLAs adjust priorities based on revenue-critical data like contract dates and ARR. This ensures that high-value accounts get the attention they need. Think of it like multi-touch attribution in marketing – it spreads focus across touchpoints that drive the most impact.
For example, if a $250,000 account has a renewal coming up in two weeks, the system should automatically escalate any support tickets from that account and notify the right team members. This ensures resources are allocated where they matter most.
Dynamic SLAs can also include triggers based on ticket volume. A sudden spike in tickets from any account – regardless of size – should prompt immediate action. Here’s a quick guide to common patterns and recommended actions:
| Volume Pattern | Customer Success Action | Timeline |
|---|---|---|
| 3x ticket spike in 7 days | Immediate executive sponsor check-in | Within 24 hours |
| 50% increase for 30 days | Schedule a deep-dive to identify root causes | Within 1 week |
| Zero tickets for 60+ days | Launch a proactive engagement campaign | Within 1 week |
| Same issue >3 times | Escalate to the product team for a permanent fix | Within 48 hours |
This shift from a "first-come, first-served" approach to a revenue-weighted model marks a major change in how support teams operate. While every customer deserves quality service, resource allocation must align with business priorities. Companies adopting a Revenue Operations (RevOps) approach increasingly focus on a "won and retained" mindset, recognizing that strong customer relationships require ongoing, strategic support.
Testing Your Attribution Model with Incrementality Experiments
What Incrementality Testing Means
Incrementality testing is a key method for determining whether your support activities are actually driving revenue or simply aligning with positive outcomes. While attribution models track customer touchpoints – like interactions before renewals or expansions – they don’t confirm causation. Incrementality testing, through randomized controlled trials, helps isolate the true impact of these support interventions.
"Attribution tells you what’s happening. Incrementality tells you what matters." – Brian Quinn, President and GM, AppsFlyer North America
Here’s how it works: Attribution tracks events, but incrementality testing uses control and treatment groups to pinpoint the actual effect of your support actions. For example, attribution might credit a channel with 300 sales, but incrementality testing might reveal that only 200 of those sales are truly incremental. This means your real cost per acquisition could be 50% higher than you initially thought. It’s no surprise, then, that only 42% of marketers trust first-touch or last-touch attribution models.
The process is straightforward. Start by dividing customers into two groups: a control group (receiving standard support) and a treatment group (receiving a new intervention, like AI-powered proactive outreach). Then, compare key metrics such as retention rates, expansion revenue, or customer lifetime value. Companies that excel at this process use the findings to refine their attribution models.
Next, we’ll dive into how incrementality testing fits alongside other attribution models.
Comparing Different Attribution Models
Each attribution model has its strengths, and combining them can provide a more complete picture of performance.
- Multi-Touch Attribution (MTA): This model provides detailed, real-time insights into specific touchpoints, making it great for optimizing campaigns. However, it often overemphasizes measurable clicks and struggles with the privacy challenges posed by the decline of third-party cookies.
- Marketing Mix Modeling (MMM): MMM offers a high-level view, useful for long-term budget planning across channels. It accounts for factors like seasonality and indirect activities but lacks the real-time detail of other models and relies heavily on historical data rather than direct causation.
- Incrementality Testing: While it requires significant resources and only provides periodic insights, this method delivers robust evidence of causation. A notable example comes from Uber’s U.S. & Canada team, which paused Meta ads in 2025 for several months to determine whether customer acquisition costs were influenced by seasonality. The test revealed no negative impact, leading to a reallocation of $35 million annually to more effective channels.
Running incrementality tests on a monthly or quarterly basis can help validate and adjust your ongoing attribution models. Using synthetic control groups – built from multiple data sources rather than simple geographic matches – can also improve accuracy.
Adding Customer Feedback to Validate Attribution
Quantitative testing is powerful, but it doesn’t tell the whole story. Incorporating qualitative insights, like customer feedback and support transcripts, adds critical context that numbers alone can’t provide. These insights help identify whether your attribution model is capturing the right signals.
For instance, if your model credits a support team with a renewal, but customer feedback shows the renewal was already planned, the model might be over-attributing. On the other hand, if customers mention a support interaction as a key reason for staying but the model doesn’t capture this, it could be underestimating support’s impact.
Conclusion
Key Takeaways
To transform your support team into a revenue-driving force, connect support efforts to financial outcomes by using unified data systems that integrate your helpdesk, CRM, and financial tools. The numbers speak for themselves: companies delivering standout support grow five times faster than their competitors, and even a modest 5% improvement in customer retention can boost profits by over 25%.
AI-powered sentiment analysis is a game-changer. By analyzing interactions across platforms like Slack, email, and calls, AI uncovers risks and opportunities that manual reviews might overlook. As Bryan Bayless puts it:
"AI isn’t magic. It only delivers ROI when properly configured and tied to measurable outcomes".
With AI, the potential return is clear – $3.50 for every $1 invested.
Success lies in balancing leading indicators (like AI adoption rates and sentiment trends) with lagging indicators (such as Net Revenue Retention, churn rate, and customer lifetime value). Focus on metrics weighted by account value to ensure interventions protect your most valuable customers and differentiate true impact from mere correlation.
By applying these principles, you can refine your support strategy and deliver measurable results.
Next Steps for Support Leaders
Ready to take action? Here’s how to start improving your support operations right away:
- Establish a baseline: Spend 8–12 weeks tracking key metrics like handle time, first contact resolution, and churn before rolling out new attribution models or AI tools. This creates a benchmark for measuring progress and builds trust with your finance team.
- Ensure seamless data integration: Make sure your customer success team has direct access to support ticket data and sentiment scores within their existing tools – no need to switch platforms. Define clear thresholds for critical signals. For instance, set automated triggers so that any enterprise account with a sentiment score below -40 prompts a customer success manager to check in within 24 hours.
- Monitor disengaged accounts: Keep an eye on accounts with no support interactions for over 60 days. These accounts are often at risk of disengagement, not just self-sufficiency. Link customer satisfaction (CSAT) scores to renewal data in your CRM to demonstrate how satisfaction drives lifetime value. Regularly review your ROI framework – quarterly is a good cadence – to align with shifting business goals and customer needs.
FAQs
How can support teams show their impact on revenue without relying on misleading metrics?
Support teams can highlight their influence on revenue by leveraging data-driven metrics and clear attribution methods. Start by monitoring key indicators such as upsell and cross-sell opportunities during support interactions, customer retention rates, and customer lifetime value (CLV). For example, if a support interaction results in an upgrade or renewal, it directly links to revenue growth.
To dig deeper, map out customer journeys and identify patterns, such as changes in sentiment or accounts that might be at risk. Addressing these issues proactively can boost retention and encourage account expansion. By combining quantitative metrics (like revenue from upsells) with qualitative insights (such as customer feedback), you get a more complete view of how support contributes to the bottom line. This approach not only makes support’s value clear but also positions it as a critical driver of long-term business growth rather than just an operational expense.
How can AI help customer support teams drive retention and revenue growth?
AI gives customer support teams the tools to boost retention and grow revenue through proactive, personalized, and efficient strategies. By processing massive amounts of customer data, AI can predict needs, spot accounts at risk, and identify signs of potential churn. This allows teams to prioritize actions that make the biggest impact, reducing customer turnover and fostering long-term loyalty.
On top of that, AI links support efforts to measurable results like customer lifetime value, upselling opportunities, and retention rates. With accurate, data-backed insights, businesses can clearly show how their support teams contribute to revenue. This shifts the perception of customer support from being a cost center to a key driver of growth.
What’s the difference between single-touch and multi-touch attribution when measuring support’s impact?
Single-touch attribution gives full credit for a customer action – like a purchase or subscription renewal – to just one interaction, typically the first or last touchpoint. While it’s straightforward and easy to manage, this method often ignores the role of other interactions along the customer journey, resulting in a limited understanding of what truly drives outcomes.
In contrast, multi-touch attribution spreads the credit across several touchpoints. This approach paints a clearer picture of how different interactions, such as support activities or marketing efforts, contribute to results like revenue growth, customer retention, or upselling. However, implementing it requires strong data tracking and can be more intricate to manage. For businesses with longer customer lifecycles and multiple decision-makers, multi-touch attribution is often a better fit for uncovering the real impact of their efforts.