
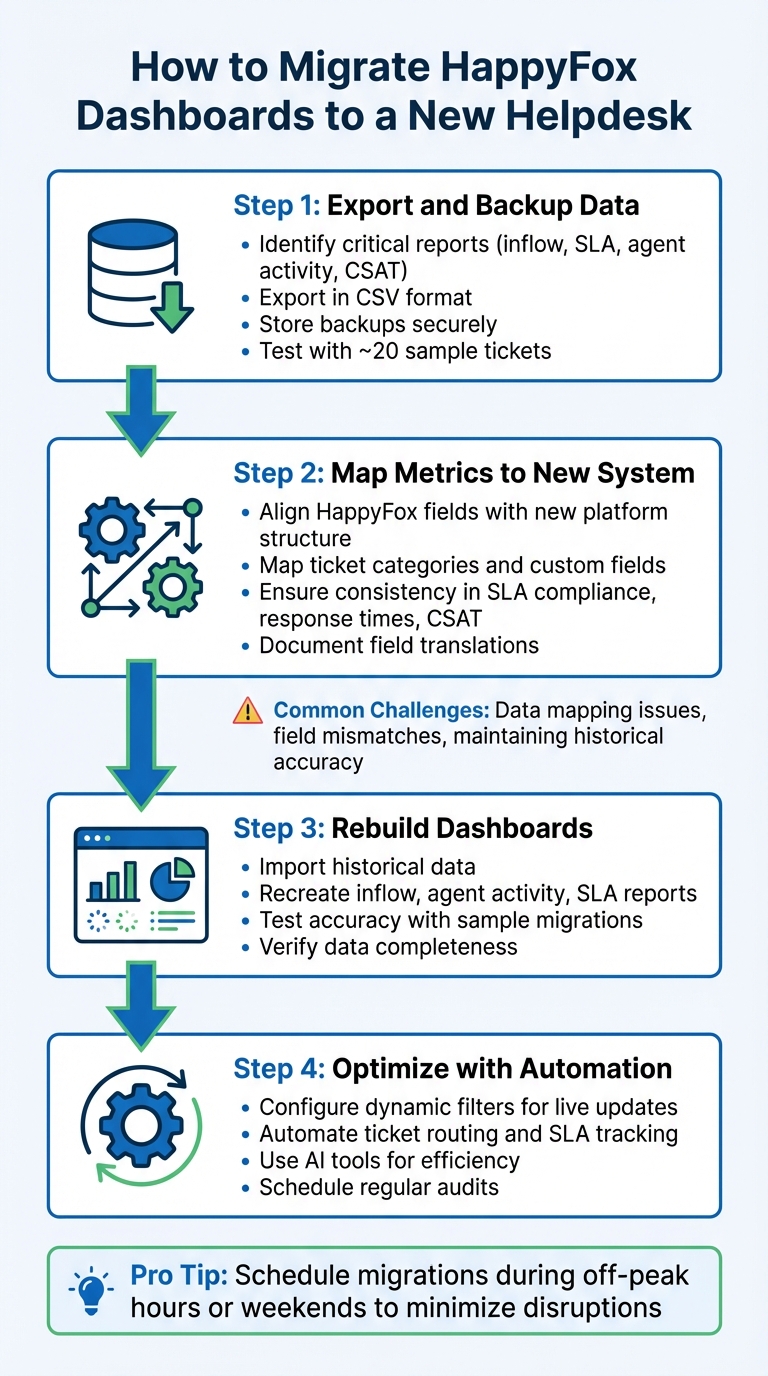
Migrating HappyFox dashboards to a new helpdesk can feel overwhelming, but it boils down to four key steps:
- Export and Backup Data: Identify critical reports (inflow, SLA, agent activity, CSAT) and export them in compatible formats like CSV. Ensure backups are securely stored.
- Map Metrics to the New System: Align HappyFox fields (e.g., ticket categories, custom fields) with the new platform’s structure, ensuring consistency in metrics like SLA compliance, response times, and CSAT, CES, and NPS scores.
- Rebuild Dashboards: Use historical data to recreate inflow, agent activity, and SLA reports. Test for accuracy with sample migrations before full implementation.
- Optimize with Automation: Configure dynamic filters for live updates and automate repetitive tasks like ticket routing or SLA tracking.
Challenges like data mapping, field mismatches, and maintaining historical accuracy can arise, but careful planning and testing help mitigate these issues. Regular updates and AI tools can further refine your dashboards, ensuring they remain actionable and aligned with your goals.
4-Step Process for Migrating HappyFox Dashboards to a New Helpdesk System
How Help Desk Migration Wizard Works | Step-by-Step Migration Guide
sbb-itb-e60d259
Step 1: Document and Export Data from HappyFox
To successfully transition from HappyFox to a new helpdesk system, start by exporting your data in a format that works with the new platform. This step is critical for maintaining operational continuity and ensuring a smooth migration process.
Identify Which Reports and Metrics to Export
Begin by reviewing your current dashboards and identifying key reports that influence team performance and SLA tracking. Pay special attention to:
- Inflow Reports: These show ticket volume by channel and category.
- Agent Activity Reports: Highlight closures and reply counts per agent.
- SLA Reports: Monitor breach percentages and target achievements.
- Satisfaction Survey (CSAT) Reports: Capture customer ratings by agent.
- Performance Reports: Break down tickets by status and priority.
- Custom Fields Reports: Include any unique ticket classifications your team uses.
If your team relies on automation, make sure to export Smart Rules Reports, which document execution counts and the time saved through automated workflows.
Metrics to prioritize include average first response time, the number of replies required for resolution, and individual agent performance stats.
Export HappyFox Data in Compatible Formats
Go to Reports > Exports in HappyFox and select the CSV format for compatibility with most platforms. While setting up the export, enable the "Strip Newlines from Text Values" option to avoid formatting issues caused by tabs or extra spaces. For the most accurate data, filter exports based on Resolved time or Updated time, rather than just the ticket creation date.
Keep in mind a few technical details: Excel has a limit of 65,530 hyperlinks, so plan accordingly. Also, download links for exported files expire after three days, so act quickly. Ensure that your account has the necessary export permissions, typically granted to managerial roles.
After exporting, verify the data for accuracy and completeness before moving forward.
Create a Backup for Reference
Download the exported files immediately, as the links expire after three days. Store these files securely in a separate location, such as cloud storage or a local server. This backup will be invaluable if issues arise during the migration or if you need to reference historical data in the future.
To ensure everything is correctly mapped, perform a test migration with a small sample of about 20 tickets. Schedule the final data extraction during off-peak hours or on weekends to minimize disruptions and avoid missing any new tickets created during the process.
Step 2: Define Core Metrics and KPIs for the New System
Now that your data is securely exported and backed up, it’s time to identify the metrics that truly matter. Focus on metrics and KPIs that drive customer satisfaction and align with your strategic goals. Avoid migrating irrelevant or outdated data that could clutter your new system.
Review Existing Metrics for Relevance
Start by evaluating your current metrics. Separate operational metrics from KPIs that directly impact performance and long-term objectives. Many teams make the mistake of transferring reports they rarely use, simply because they exist. Instead, rebuild metrics that reflect your current business needs.
Use HappyFox’s Custom Fields Report to identify fields that are rarely used or left blank. These fields should be excluded from your new system to avoid unnecessary clutter. For instance, if your team no longer tracks specific ticket classifications, there’s no need to carry them over into the new platform.
Concentrate on seven key KPIs that are essential for B2B support operations: First Response Time, Ticket Resolution Time, First Contact Resolution (FCR) Rate, Customer Satisfaction (CSAT) Score, Net Promoter Score (NPS), SLA Compliance Rate, and Reopen Rate. These metrics are critical for building customer trust, ensuring team efficiency, and meeting contractual obligations.
Map Metrics to the New Helpdesk Structure
To ensure a smooth transition, align HappyFox report categories with the corresponding modules in your new system. For example:
- Inflow Reports (tracking volume by channel or category) can map to the inbound analytics module in your new platform.
- Agent Activity Reports (covering participation, closures, and replies) can translate into productivity or leaderboard metrics.
- SLA Reports (tracking breach counts and target achievement percentages) align with service level compliance tracking.
It’s important to confirm that your new platform calculates metrics in the same way as HappyFox. For example, HappyFox’s Response Stats View provides detailed data on the number of replies needed to resolve a ticket. Ensure your new system uses similar logic to maintain consistency and allow for valid historical comparisons.
Document how HappyFox Categories and Custom Fields will translate into equivalent structures in your new system, such as Departments, Folders, Tags, or Custom Attributes. This mapping will help maintain reporting continuity and prevent gaps in your data analysis. Before importing historical data, perform a side-by-side comparison of field names and values using tabular exports from HappyFox to verify alignment.
| HappyFox Report Type | Core Metrics to Rebuild | New System Equivalent |
|---|---|---|
| Inflow Report | Volume by Channel/Category, Peak Hours | Volume/Inbound Analytics |
| Performance Report | FCR %, Avg Response Time, Time to Closure | Speed & Quality KPIs |
| SLA Report | Breach Count, Target Achievement % | Service Level Compliance |
| Agent Activity | Participation, Closures, Replies | Productivity/Leaderboards |
| Satisfaction Survey | CSAT Scores by Agent/Category | Customer Sentiment/NPS |
| Smart Rules Report | Execution Count, Time Saved | Automation Efficiency Metrics |
This structured mapping ensures a seamless transition of your historical data and helps you rebuild dashboards that are both accurate and actionable.
Step 3: Migrate Historical Data and Rebuild Dashboards
Once you’ve defined your core metrics, the next step is ensuring seamless access to past insights by migrating historical data and rebuilding dashboards.
Import Historical Data for Smooth Reporting
Migrating historical data is key to maintaining context and continuity in your reports. To do this effectively, focus on smart data mapping. Align HappyFox’s default and custom fields – such as priorities, statuses, and tags – with the structure of your new platform. This ensures relationships between tickets, agents, and companies remain intact.
Start with a demo migration of about 20 tickets to test field mapping, attachments, and formatting. Take this opportunity to clean up your data by auditing HappyFox records for duplicates, incomplete fields, or broken records. This step helps protect the integrity of your data and ensures your insights remain actionable. During the migration, disable email alerts, triggers, and automation in both systems to avoid duplicate notifications.
"Data migration is more than just copying files from one system to another – it’s a delicate, high-stakes process that can affect everything from day-to-day operations to long-term compliance."
– Eric Klimuk, Founder and CTO, Supportbench
Use a delta migration process to capture any new tickets or updates added in HappyFox while the main migration is running. To minimize disruptions, schedule the full migration during off-peak hours or weekends. Once you’ve verified the data, you can move on to dashboard reconstruction.
Rebuild Dashboards with Custom Visualizations
Dashboards are the backbone of daily operations, so take the time to rebuild them thoughtfully. Start by replicating key HappyFox report types, such as:
- Inflow Reports: Track ticket volume by channel and category.
- Agent Activity Reports: Monitor closures and replies.
- SLA Reports: Keep an eye on breach incidents.
- Satisfaction Surveys: Measure CSAT scores.
Ensure your new platform supports custom visualizations, allowing you to drill into ticket data using custom fields. This feature is essential for spotting trends, like recurring request types or product-related issues. When recreating trend reports, double-check that date filters are applied consistently across all widgets, pages, and report levels to avoid discrepancies.
To confirm accuracy, export underlying data as CSV or XLSX files from your new system and compare them against your HappyFox backups. You can refine these files using tools like Excel or Google Sheets or connect your helpdesk’s analytics directly to Business Intelligence (BI) tools via API links for more advanced reporting.
Use AI to Streamline and Refine
Once your dashboards are set up, integrating AI tools can help automate workflows and improve data accuracy. AI-native platforms like Zapier can automate data formatting and ensure seamless transfers to your new system. Conditional logic within these tools can further refine the process, matching exported HappyFox data to the new platform’s requirements.
For added efficiency, generative AI tools like GPT-4 can summarize lengthy ticket threads during the import process, providing valuable context without requiring manual effort.
"Transform data from different sources into cross-functional reports and dashboards. Track your key performance indicators, measure trends, identify outliers, and uncover hidden insights."
– HappyFox Business Intelligence
AI-powered BI tools can also identify outliers in your migrated data, helping you catch mapping errors or field mismatches early. Additionally, automation can maintain ticket hygiene by handling repetitive tasks like tagging and routing, ensuring consistent categorization for all reports. This not only saves time but also keeps your data organized and actionable.
Step 4: Optimize and Automate Reporting in the New Platform
After rebuilding your dashboards in Step 3, the next step is to fine-tune them for ongoing use. This involves setting up dynamic filters and automating workflows to ensure your reporting is both efficient and relevant.
Configure Dynamic Filters and Time Periods
Static reports can become outdated quickly. To avoid this, use relative date ranges like "last 30 days" or "last 6 months." This ensures your dashboards automatically update to reflect the latest data without requiring constant manual adjustments. With this setup, your team always has access to the most up-to-date insights.
You can apply global filters for overarching trends or widget-level filters for more granular analysis. To refine data further, use "ALL" conditions to focus on specific intersections or "ANY" conditions for broader overviews. Proper mapping of metrics to date dimensions is also key. For instance, pair "Tickets Created" with "Created Date" and "Tickets Resolved" with "Resolved Date" to ensure accurate filtering.
Another helpful tip is to align reports with your business cycle by setting a custom week start, such as Friday to Thursday. You can also use rank order filtering to highlight key insights automatically, like showing the top 5 agents by performance. This eliminates the need for manual sorting and keeps priority areas in focus.
Once your dynamic filters are in place to keep the data relevant, the next step is to streamline the reporting process with automation.
Automate Reporting Workflows
Automation can save significant time and reduce errors associated with manual report generation. Many modern helpdesks offer automation features that handle routine reporting tasks, freeing up your team to focus on higher-value work. When starting with AI-powered automation, use a limited data set – such as one month’s worth – to establish a reliable baseline.
For more detailed reports, apply multiple filter conditions that update automatically based on ticket attributes like status, priority, or custom fields. These filters can be tailored at the agent level, allowing team members to personalize their views without affecting shared dashboards. Keep in mind that filters often persist across reports until manually changed, which helps maintain consistency during analysis.
If your reporting needs go beyond what standard dashboards can handle – such as integrating data from multiple platforms or conducting complex trend analysis – explore Business Intelligence (BI) tools. These modules are designed for advanced reporting and can pull data from various sources. To keep workflows running smoothly, regularly review key performance metrics like resolution times and CSAT scores, and adjust your automated processes as needed. Be aware, however, that some platforms may limit the number of automated actions per month. Exceeding these caps could temporarily halt workflows until you upgrade your plan.
Common Challenges and How to Solve Them
Even with meticulous preparation, dashboard migrations often come with unexpected hurdles. Issues like mismatched data fields and broken historical records can disrupt the process, even if you’ve carefully planned data exports, metric definitions, and dashboard rebuilding. Addressing these challenges early can help you avoid delays and gaps in reporting.
Data Mapping and Field Incompatibilities
One major challenge is how platforms label fields differently. For example, HappyFox might use "Ticket Subject", while your new helpdesk could call it "Subject" or "Issue Title." Similarly, "Requester Email" might become "Customer Email." If not mapped correctly, essential data could be misplaced or lost during migration.
Custom fields add another layer of complexity. These fields often track critical information like subscription levels, contract IDs, or SLA timers. As Help Desk Migration points out:
"Losing these [custom] fields during migration can mean losing critical context".
Without accurate mapping, operational details that make your reports valuable could be compromised. Additionally, your new platform might require fields that weren’t present in HappyFox. If your source data lacks these mandatory fields, imports may fail unless you assign default values, such as "Low" for priority or "Open" for status.
Differences in data formats – like dates, currencies, or user IDs – can also cause corruption if not handled properly. To avoid these pitfalls, audit your data to eliminate duplicates, outdated records, and formatting problems. Enhance your mapping by including format conversions and assigning default values for missing fields. Running a small demo migration with around 20 random tickets – often a quick five-minute test – can help you catch errors early and fine-tune your mapping.
Once your field mappings are verified, the next step is ensuring the accuracy of historical data.
Maintaining Historical Accuracy
Preserving the integrity of historical data is crucial for reliable reporting. If key relationships break during migration, the value of your historical data diminishes. For instance, tickets must stay linked to the correct agents, companies, and attachments, or your historical reports lose their reliability. Eric Klimuk, Founder and CTO of Supportbench, emphasizes:
"Mismatched relationships are one of the most common sources of integrity issues in poorly executed migrations".
Another common challenge is maintaining conversation threads. Importing messages in strict chronological order using unique identifiers is essential to prevent fragmented histories. Metadata like timestamps, user IDs, and SLA timers must also remain intact during the transfer.
Take the example of Rossi Residencial, a Brazilian construction company. In July 2025, they migrated four SAP environments to Google Cloud using Migrate to Virtual Machines. By conducting a detailed pre-migration assessment and mapping all systems in advance, they achieved a zero-downtime migration and cut infrastructure costs by 50%.
To safeguard your data, ensure you have a secure backup of all source information before migration. Temporarily freeze changes to HappyFox during the migration window to avoid last-minute edits that could cause mismatches. After completing the migration, compare pre- and post-migration analytics – like ticket volume and resolution times – to confirm data completeness. Additionally, spot-check conversation threads to ensure agents retain the proper historical context.
Best Practices for Long-Term Reporting Success
After a successful dashboard migration, the real challenge begins: keeping your reporting tools relevant and effective over time. As priorities shift, team dynamics evolve, and customer expectations change, your dashboards need to keep up. Regular updates and optimizations are key to ensuring your dashboards stay aligned with your goals.
Review and Update Dashboards Regularly
Dashboards can quickly lose their relevance if left unchecked. Conduct weekly performance audits to monitor metrics like ticket closures and resolution times. This helps you identify trends and top-performing agents while confirming that your key performance indicators (KPIs) – such as resolution times and CSAT scores – still align with your current objectives. For example, if you’ve introduced a new product or updated your SLA commitments, adjust your dashboards to reflect these changes. Gathering feedback from agents can also help you prioritize visualizations that deliver the most value.
To keep your reports clean and actionable, remove unused custom field values that can clutter your data. Use clear, descriptive naming conventions for all reports instead of relying on system-generated titles, so everyone can easily understand the data’s context. When making major updates, use the "Save As New" feature to create a copy of the report. This approach safeguards historical data structures and makes it easier to revert changes if needed.
As your reporting needs grow, manual updates may become less practical. That’s where built-in AI tools can make a big difference.
Use Built-In AI Features for Continuous Improvement
Many modern helpdesk platforms come equipped with AI-powered tools that can enhance your reporting capabilities. For instance, AI-driven search can help both customers and agents find the information they need faster, which can reduce ticket volume. Automating repetitive tasks like ticket routing and escalations can also boost response times while minimizing errors.
Keep an eye on AI performance metrics, especially if you’re using chatbots or automated agents. These insights can reveal opportunities for improvement. If your platform supports advanced features like AI agents for handling tasks autonomously or generative AI to reduce average handle times, make sure their performance metrics are integrated into your dashboards. This gives you a complete view of how both human and AI resources are contributing to your support operations.
Additionally, review "Smart Rules" reports to measure how much time automation is saving and to identify rules that may need adjustment. These data-driven insights can guide decisions on resource allocation, staffing, and process improvements, ensuring your operations run smoothly and efficiently.
Conclusion
Moving reporting dashboards from HappyFox to a new helpdesk platform takes careful planning to maintain continuity while tapping into fresh possibilities offered by modern, AI-driven support tools. Your helpdesk holds years of crucial data – everything from customer interactions to support workflows – that informs key decisions. As the HappyFox Blog aptly puts it, "A well-planned migration ensures minimal disruption to your team’s productivity while preserving critical customer information and setting the stage for improved customer service". Think of this transition as a chance to enhance your reporting strategy, not just replicate the old setup.
Key Takeaways for Migrating HappyFox Dashboards
The migration process can be summarized into four main steps: documenting and exporting your existing data, determining which metrics remain relevant, rebuilding dashboards with historical context, and enhancing them with automation. Start by thoroughly reviewing active and historical tickets, customer records, and custom fields to ensure no critical data is overlooked. A detailed mapping of fields from HappyFox to your new system is essential for maintaining data accuracy.
When reconstructing dashboards, prioritize metrics like SLA performance, agent activity, ticket distribution (by status and priority), and CSAT scores . Take time to clean and validate your data, removing inconsistencies before importing it into the new platform. Schedule the actual data transfer during off-peak hours – weekends are ideal – to minimize disruptions. These steps lay the groundwork for optimizing your new system effectively.
Next Steps for Optimizing Your New Helpdesk
Once your dashboards are live, make it a habit to audit your data regularly to catch errors and fine-tune configurations. Gather input from your support agents during the transition – they’re often the first to spot issues or suggest improvements. This migration is also the perfect moment to explore advanced automation tools, such as AI-powered ticket routing and automated SLA management, which may not have been fully utilized in your previous system.
For future reporting, use your new platform’s native builder to take advantage of its full range of features and avoid unnecessary technical complications. Keep an eye on dashboard usage – most dashboards stop being edited within 10 days of creation. Archive those that no longer serve a purpose and focus on maintaining reports that deliver actionable insights and improve operations.
FAQs
What data should I migrate for reporting?
When setting up your new helpdesk system, it’s crucial to bring over key data like tickets, customer histories, workflows, and report metrics. This ensures your reporting remains accurate and consistent throughout the transition. Without these elements, you risk losing valuable insights and disrupting your ability to track performance effectively.
How do I keep SLA metrics consistent after migration?
To keep your SLA metrics on track after moving to a new helpdesk, it’s crucial to replicate all SLA data and configurations accurately. This includes objectives, conditions, and schedules. Once the migration is complete, compare pre- and post-migration SLA reports to confirm the data matches.
Run tests on workflows and SLA performance reports to spot any inconsistencies. If you find gaps, adjust thresholds and schedules to align with your original setup. Additionally, using features like delta migration can help reduce data loss, ensuring SLA tracking continues smoothly without interruptions.
How can I validate historical report accuracy?
To ensure the accuracy of historical reports, start by cross-referencing the exported data with the original ticket records. Running test exports can help identify any discrepancies early on. Additionally, conduct thorough data integrity checks to confirm everything aligns correctly. It’s crucial to perform these validations both before and after the migration process to ensure the data remains accurate and consistent throughout.
Related Blog Posts
- How do you migrate away from Freshdesk without losing tickets, contacts, or history?
- How do you map Kayako statuses, priorities, and custom fields to a new helpdesk?
- How do you map HappyFox categories, custom fields, and statuses to a new system?
- How do you migrate HappyFox SLA policies and escalation rules correctly?