When downtime strikes, it’s not just an inconvenience – it’s a financial and operational disaster. Businesses can lose $300,000 to $5 million per hour, depending on their size, with recovery efforts often requiring 20 to 50 hours of extra work. Beyond the immediate costs, outages damage trust, increase customer churn by 15% to 40%, and disrupt critical workflows like billing and order fulfillment.
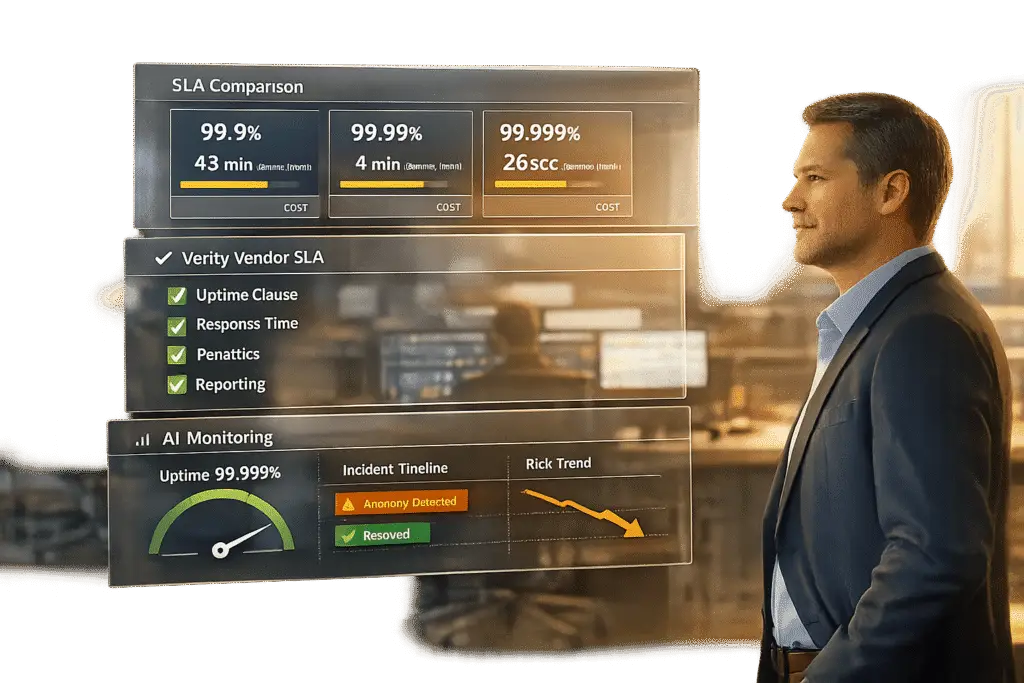
This is where Service Level Agreements (SLAs) come in. SLAs define uptime guarantees and response times, ensuring vendors prioritize reliability. Even small differences in SLA uptime – like 99.9% (8.7 hours downtime/year) versus 99.99% (52.5 minutes downtime/year) – can significantly impact your business. To protect your operations, it’s essential to evaluate SLA terms carefully, verify vendor performance, and use tools like AI for real-time monitoring.
Key takeaways:
- Downtime costs: $5,600 per minute on average; up to $5 million/hour for large enterprises.
- Hidden impacts: Customer churn, strained relationships, and reputation loss.
- SLA importance: Clear metrics for uptime, response times, and financial remedies for breaches.
- Proactive measures: AI monitoring, predictive analysis, and robust contract protections.
Downtime is costly, but the right vendor and SLA terms can minimize risks and ensure smoother operations.
How to Calculate the Cost of Downtime
sbb-itb-e60d259
Measuring the Financial Impact of Downtime
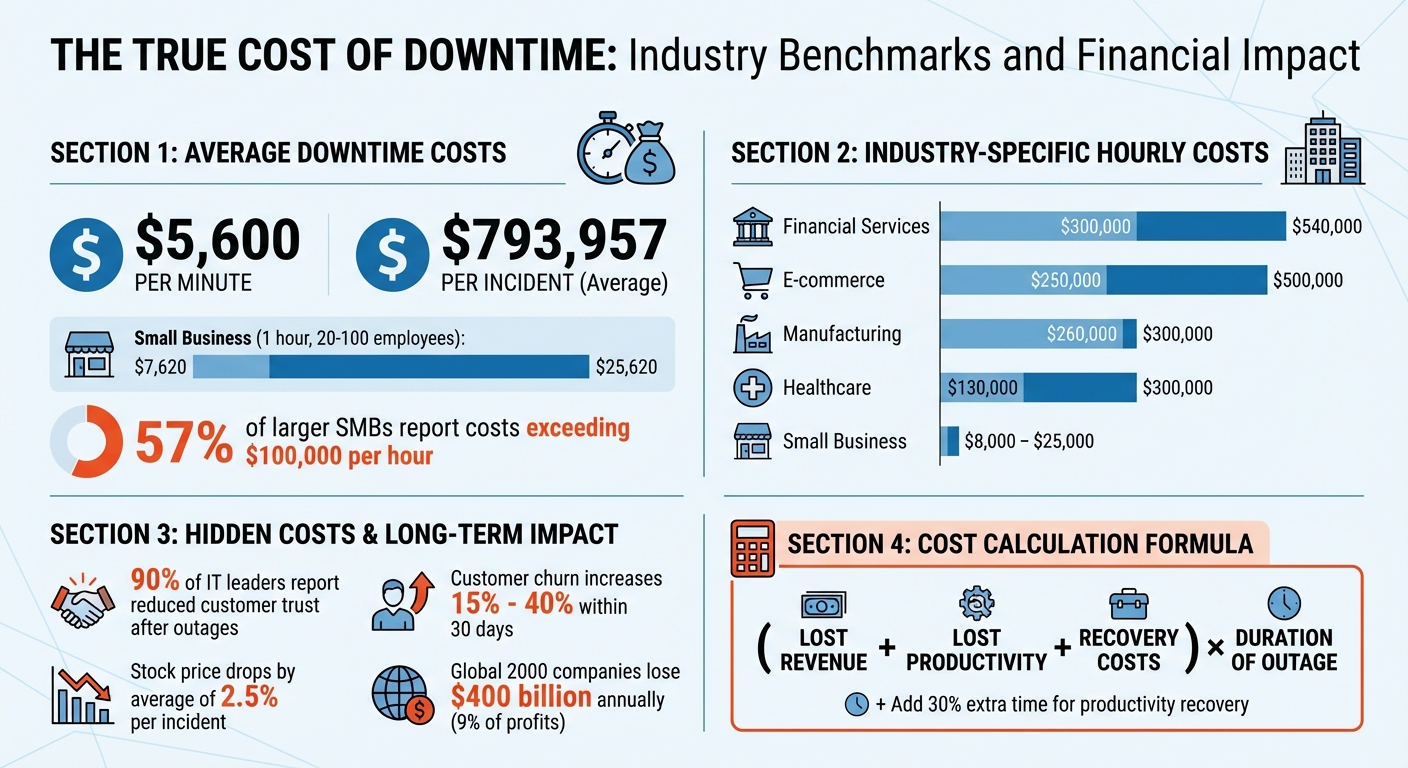
The True Cost of Downtime: Industry Benchmarks and Financial Impact
Direct Costs of Downtime
Downtime comes with obvious, immediate financial hits. First, there’s lost revenue – transactions that don’t go through, missed sign-ups, and leads that slip away. On average, downtime costs $5,600 per minute, though some industry estimates place it closer to $4,537 per minute. This brings the total for an average incident to about $793,957 [3][4].
Then, there are labor inefficiencies. Employees, like support agents, remain on the clock during an outage but can’t perform their tasks effectively without access to essential tools or systems. For small and midsize businesses (SMBs) with 20 to 100 employees, an hour of downtime can cost between $7,620 and $25,620 [5]. For larger SMBs, 57% report hourly costs exceeding $100,000 [5].
Other direct costs include SLA penalties, such as service credits or fines when uptime guarantees aren’t met. Add recovery costs like overtime pay for support and engineering teams, fees for emergency vendors, and the time spent verifying data after the incident. These expenses can snowball quickly [1][5][6].
"Downtime is the silent profit killer. Whether caused by a network outage, power failure, or system crash, every minute your business is offline costs money – and often more than you think." – Kinect Communications [4]
While these direct costs are significant, the hidden, long-term effects of downtime can be just as damaging.
Indirect Costs: Customer Churn and Reputation Loss
Downtime doesn’t just hurt your bottom line – it shakes customer confidence. For businesses, particularly those with service-level agreements (SLAs), trust erosion is a major consequence. A staggering 90% of IT leaders say outages have reduced customer trust in their organizations [3]. In B2B settings, where clients depend on your platform to run their own operations, this loss of reliability can have a ripple effect.
Customer churn often spikes after a significant incident, increasing by 15% to 40% within just 30 days [2]. While brand reputation typically rebounds within 60 days [8], the financial impact lingers. For example, a company’s stock price drops by an average of 2.5% after a single downtime event [8]. Across the Global 2000, downtime accounts for $400 billion in annual losses, cutting into roughly 9% of profits [8].
These incidents also create hurdles in the sales process. Potential clients may bring up past outages during technical evaluations, further complicating your ability to close deals.
Industry Benchmarks for Downtime Costs
To truly understand the financial risks, it helps to compare your numbers with industry averages. Some sectors face steeper costs than others. For example, financial services experience downtime costs of $300,000 to $540,000 per hour [4]. E-commerce businesses are close behind at $250,000 to $500,000 per hour, while manufacturing sees costs around $260,000 to $300,000 per hour [4].
| Industry | Average Cost Per Hour of Downtime |
|---|---|
| Financial Services | $300,000 – $540,000 [4] |
| E-commerce | $250,000 – $500,000 [4] |
| Manufacturing | $260,000 – $300,000 [4] |
| Healthcare | $130,000 – $300,000 [4] |
| Small Business | $8,000 – $25,000 [4] |
To estimate your own financial exposure, use this formula: (Lost Revenue + Lost Productivity + Recovery Costs) × Duration of Outage [4]. It’s also smart to factor in about 30% extra time beyond the outage itself for employees to regain focus and productivity [1]. If your business relies heavily on sales, you can calculate missed opportunities by multiplying your average revenue per contact by the number of contacts missed during the downtime [7].
"Average downtime cost doesn’t mean much without context. The real question is: your cost per minute, on your critical apps, at the right moment." – ip-label [1]
SLA Metrics That Determine Vendor Reliability
Evaluating SLA performance requires a close look at specific metrics that directly influence operational stability and customer satisfaction.
Uptime Guarantees and Availability Percentages
The difference between a 99% and a 99.9% uptime guarantee is striking. While 99% allows for over 7 hours of downtime each month, 99.9% cuts this to just 43 minutes. For businesses, even small increases in downtime can disrupt operations and frustrate customers.
| Target Uptime | Allowed Downtime per 30-Day Month | Operational Impact |
|---|---|---|
| 99% | 7 hours 12 minutes | High risk for B2B |
| 99.5% | 3 hours 36 minutes | Standard for non-critical sites |
| 99.9% | 43 minutes 12 seconds | Modern baseline for SaaS/BPO |
| 99.95% | 21 minutes 36 seconds | Required for critical infrastructure |
| 99.99% | 4 minutes 19 seconds | High-availability enterprise tier |
Achieving 99.99% uptime requires more than just minor improvements – it demands advanced systems and processes. While 99.9% uptime might allow for occasional multi-hour incidents, maintaining four nines means issues must be identified and resolved within minutes. This often involves automated monitoring, on-call escalation systems, and robust redundancy measures [12].
"An SLA is a promise, not a reality. It’s what the provider aims for, not what you’re guaranteed to experience." – API Status Check [13]
Be wary of vendors who calculate uptime on an annual basis rather than monthly. Annual calculations can obscure the impact of major outages by averaging them out over the year. Monthly metrics provide a clearer picture of consistent reliability [10].
Next, let’s look at how response and resolution times further shape vendor reliability.
Response and Resolution Time Commitments
Response time and resolution time are two different – but equally important – metrics. Response time measures how quickly a vendor acknowledges an issue, often with an automated confirmation. Resolution time, on the other hand, reflects how long it takes to actually fix the problem [11].
While fast response times are nice, they don’t guarantee swift resolutions. That’s why your SLA should prioritize clear resolution time commitments over response times alone.
Another key metric is First Contact Resolution (FCR), which measures the percentage of issues resolved during the initial interaction. Top-tier support centers typically achieve FCR rates above 80%, while rates between 70% and 79% are considered acceptable [9]. If a vendor can’t provide FCR data, it might signal potential inefficiencies.
Mean Time To Recovery (MTTR) is also critical. This metric tracks the average time it takes to restore service after an incident occurs. Your SLA should define "recovery" clearly – whether it means a fully restored system or a minimally functional state – to avoid confusion during outages [10].
Let’s now examine how support availability affects overall service performance.
Support Availability Windows
Downtime doesn’t follow a 9-to-5 schedule, especially in global B2B operations. If your vendor only offers support during business hours in EST, your business could be vulnerable during off-hours. For companies with international customers, 24/7 support is a must.
One key benchmark for accessibility is answering 80% of calls within 20 seconds [9]. But modern support extends beyond phone calls. Vendors should also provide consistent service across multiple channels like email, chat, and phone.
Priority classification is another critical factor. Severe issues, such as platform-wide outages, should have tighter response and resolution times compared to routine inquiries [9]. With around 67% of businesses facing at least one major IT outage each month [11], it’s essential to choose a vendor capable of handling emergencies effectively.
"SLAs are the guardrails of customer service excellence. They don’t just measure performance; they guide it, ensuring every customer interaction is consistent, reliable, and aligned with your brand promise." – Admin, CallZent [9]
How to Evaluate Vendor SLA Reliability
Reviewing a Service Level Agreement (SLA) is just the starting point – what really matters is verifying how well a vendor performs in practice. After all, SLA reliability directly impacts costs tied to downtime and overall operational efficiency. While many vendors present impressive-sounding SLAs, the reality often tells a different story. Here’s how to dig deeper and assess whether a vendor’s reliability lives up to their claims.
Methods for Verifying SLA Claims
Don’t rely solely on vendor-provided reports – they may paint a rosier picture than reality. Instead, take these steps to get a clear view of actual performance:
- Use independent monitoring tools: Third-party tools can track Service Level Indicators (SLIs) like uptime, latency, and error rates. These measurements from your own systems give you an unfiltered view of service performance. Compare this data with the vendor’s reports to spot any inconsistencies.
- Request historical SLA data: Before signing a contract, ask the vendor for at least 90 days of detailed SLA performance data. This should include breakdowns by priority levels and geographic regions. If they hesitate or refuse, it’s a warning sign that their past performance might not hold up.
- Leverage AI-powered benchmarking tools: Tools like contract intelligence platforms can help you compare the vendor’s SLA promises against market standards. For instance, while 99.5% uptime may be acceptable for some services, mission-critical systems often require 99.9% or higher. This ensures you’re not settling for less than what the industry typically offers.
"Enterprises buy outcomes, not intentions." – Sirion [14]
Once you’ve gathered and verified this data, use it to strengthen your contracts with specific terms and protections.
Contract Protections Against SLA Breaches
To safeguard your business, your contracts should go beyond vague promises and include enforceable remedies. Here’s what to look for:
- Financial remedies: Ensure the agreement includes clear service credits for SLA breaches, typically ranging from 5% to 25% of the service fee. Avoid vague terms – credits should be tied to specific metrics and calculated transparently.
- Avoid "proportional credit" loopholes: Some vendors only issue credits for the specific feature that failed, even if the failure disrupts your entire service. Push for terms that reflect the full impact on your operations.
- Termination rights: Include a clause allowing you to terminate the agreement without penalties if the vendor repeatedly fails to meet SLAs. For example, you might specify termination rights after three breaches in three months, rather than relying on a standard 30-day cure period.
- Explicit metric definitions: Define how performance metrics are calculated, what exclusions apply, and how credits are determined. For example, "permitted downtime" should only cover routine, pre-scheduled maintenance during off-peak hours – not vague "emergency" events that vendors could use to excuse poor performance.
"A 99.99% uptime ‘guarantee’ is meaningless if you get the same remedy whether actual availability is 95% or 99%." – Brian Heller, Outside GC [15]
Beyond financial terms, pay close attention to the SLA documentation itself for any warning signs.
Warning Signs in SLA Documentation
Certain red flags in SLA documents can indicate potential issues. Be on the lookout for these pitfalls:
- Unrealistic promises: Claims like "100% uptime guarantees" sound great but are technically impossible. Without meaningful remedies, these promises are just marketing fluff.
- Non-binding commitments: If response or resolution times are listed as "targets" rather than enforceable commitments, the vendor may lack accountability.
- Complicated credit processes: Some vendors require customers to manually track and request credits, which often leads to missed claims. Instead, credits should be automatically calculated and applied.
- "On-hold" loopholes: Vendors may pause the SLA clock for vague reasons like "awaiting customer response" or "third-party delays." This can artificially inflate their compliance metrics while masking real performance issues.
| Red Flag | Why It Matters | Healthy Alternative |
|---|---|---|
| Emergency Maintenance Exclusion | Lets vendors hide downtime under "fixes." | Only pre-scheduled, off-peak maintenance allowed. |
| Vague Severity Levels | Major failures may be labeled as "minor." | Severity tied to business impact, not just "up/down." |
| Manual Credit Requests | Shifts the burden to customers to avoid payouts. | Credits automatically tracked and applied. |
| Backward-Looking Reports | Monthly summaries can hide patterns of instability. | Real-time dashboards with granular data. |
Finally, consider how the vendor handles third-party dependencies. If they rely on providers like AWS or Google Cloud, their SLA should include "pass-through" clauses. These ensure you’re protected even when the issue originates with their sub-provider [16].
Using AI to Monitor SLAs and Reduce Downtime
Managing SLAs (Service Level Agreements) has traditionally been a slow, manual process, often leaving businesses to address problems only after they’ve occurred. AI changes the game by focusing on preventing issues before they happen.
Real-Time SLA Monitoring and Alerts
AI-driven monitoring systems keep an eye on performance metrics continuously, moving beyond the outdated practice of end-of-month reviews. Instead of waiting for dashboard notifications, these tools analyze live data and send alerts when deadlines are at risk. For instance, if a high-priority case is nearing its resolution time and the assigned agent is overloaded, the system can flag it for escalation automatically.
Take the example of a Fortune 500 telecom company. In February 2023, they introduced a machine learning alert system via the Analance platform. By analyzing 659,875 historical tickets with 78 distinct attributes, the system achieved a 72.6% accuracy rate in predicting potential SLA breaches in near real time. This allowed them to identify high-risk tickets early and significantly cut their mean time to repair (MTTR)[17].
Modern AI tools also monitor behavioral SLAs, such as response accuracy, tone, and compliance with policies. This is especially important when AI handles customer interactions. If the system detects errors or policy violations, it can automatically step in and halt the AI’s actions to prevent further issues[19].
"35–50% of sales go to the vendor that responds first – making AI response time a revenue driver." – EmailAnalytics[19]
To avoid AI escalation loops – situations where tickets endlessly bounce between bots and humans – modern systems use features like cooldown windows and sticky assignments. For example, if a human agent resolves a ticket, the system might block it from being re-automated for 15 minutes, ensuring valuable time isn’t wasted on repeated handoffs[18].
These monitoring tools integrate seamlessly with existing CRMs and ticketing platforms, strengthening SLA reliability across the board.
Predictive Analysis for SLA Compliance
Building on real-time alerts, predictive analysis takes things a step further by forecasting potential SLA breaches. By analyzing historical data, ticket complexity, and customer sentiment, AI assigns real-time risk scores to active cases. If a ticket has a 40% or higher chance of breaching its SLA, the system can automatically escalate it or adjust its priority.
These tools can predict SLA breaches with up to 90% accuracy, giving support teams up to 4 hours of lead time to intervene[17]. Sean O’Connor from monday.com highlights this shift:
"Service management is shifting from tracking SLAs to continuously improving them. With AI automation, service desks move from reactive responses to predictive, problem-solving operations."[17]
Predictive models also uncover recurring issues that traditional reporting might miss. This allows businesses to reallocate resources more effectively. Companies using AI for SLA management have seen service costs drop by as much as 30%, while customer satisfaction scores rose by 34%[17].
Automated Escalation and Resolution Processes
AI doesn’t just predict problems – it also helps solve them faster. Automated escalation systems can reassign tickets, adjust priorities, or send notifications to managers via platforms like Slack or Microsoft Teams.
For example, IBM Watson AIOps uses AI-driven incident detection and root-cause analysis to streamline support workflows. This has helped reduce MTTR by 50%[19].
Another critical feature is the use of circuit breakers. If an automation begins misrouting tickets or generating incorrect responses, the system can automatically disable that process once it hits a predefined error threshold. This prevents widespread failures during busy periods[18].
| Safeguard Type | Function | Downtime/SLA Impact |
|---|---|---|
| Cooldown Window | Blocks re-automation for a set period after human handling | Prevents immediate re-entry into loops |
| Sticky Assignment | Retains the same agent after the first human interaction | Ensures continuity and faster resolution |
| Circuit Breaker | Disables specific automations if breach rates are high | Stops systemic failures during peak loads |
| Sentiment Trigger | Escalates tickets based on customer frustration | Addresses high-risk issues before deadlines |
AI-powered tools are transforming SLA management by not only predicting and preventing issues but also automating resolutions, making service operations smarter and more efficient.
Conclusion: Making SLA Reliability a Priority
Downtime isn’t just a tech hiccup – it’s a full-blown business crisis. It can cost enterprises over $300,000 per hour and alienate customers after just one poor experience. Your vendors and their SLAs play a critical role in determining whether you protect your revenue or suffer significant losses.
Key Points for Vendor Evaluation
When assessing vendors, don’t just look at uptime percentages on the surface. For instance, a difference between 99.9% and 99.99% availability might seem minor, but it’s a game-changer. That small shift means going from 43.8 minutes to just 4.38 minutes of downtime per month – a tenfold improvement that could make or break a client relationship[20]. Also, pay attention to recovery metrics like MTTR, MTTA, and MTBF to gauge how quickly issues are resolved.
Trust but verify. Independent monitoring has shown that some vendors under-report outage durations by as much as 50%[22]. To keep things transparent, use third-party synthetic monitoring tools to cross-check uptime claims. Set automated alerts at critical thresholds – like 75% or 90% of your SLA targets – so your team can act before breaches escalate[16].
"Standard SLA service credits typically cover only 5-10% of monthly fees while business losses can reach $300,000+ per hour" – Chang Law Group[24]
Contract details matter as much as technical performance. Push for service credits of 10% to 25% of monthly fees for SLA breaches, and include clauses that hold vendors accountable for failures caused by their subcontractors. For extended outages, consider business interruption coverage that compensates actual losses[20][24]. Be specific about metrics – ensure terms like "Response Time" mean real human action, not just automated acknowledgments, to avoid loopholes[21].
These insights can help you evaluate vendors more effectively and strengthen your operational strategy.
Next Steps for Support Leaders
Start by auditing your current SLAs to identify recurring breaches[16]. Don’t wait for quarterly reviews – implement independent monitoring now to stay ahead of issues[22].
Leverage AI-driven tools for proactive monitoring and establish clear escalation paths for quick response[21].
Finally, reduce reliance on a single vendor. Diversify your vendor portfolio and embrace vendor-neutral architectures[24]. With 85% of enterprise customers willing to pay extra for better reliability guarantees[23], choosing vendors with proven SLA performance is a smart move to protect your operations and retain customer trust.
FAQs
What SLA uptime should I require for my support tools?
When it comes to support tools, setting a Service Level Agreement (SLA) uptime of at least 99.9% is a solid starting point. This translates to roughly 8.76 hours of downtime per year. However, many businesses are now gravitating toward even stricter guarantees, such as 99.99% (about 52.56 minutes of downtime annually) or 99.999% (just 5.26 minutes annually). These higher standards significantly reduce the chances of operational hiccups and help prevent potential revenue losses, ensuring smoother and more dependable customer support operations.
How can I verify a vendor’s SLA performance myself?
To keep tabs on a vendor’s SLA performance, leverage real-time monitoring tools and conduct regular risk assessments. Automated dashboards are particularly useful for tracking key compliance metrics, such as response times and resolution rates. By comparing actual service data with the agreed SLA terms, you can quickly pinpoint any discrepancies.
Additionally, tools like SLA risk calculators can provide insights into potential risks by analyzing open cases and breaches. This proactive approach helps you evaluate a vendor’s reliability and tackle problems before they impact your customers.
What SLA clauses matter most during outages?
The most important SLA clauses to pay attention to during outages are uptime guarantees, response and resolution times, and enforceable penalties or remedies for downtime. These clauses play a key role in ensuring smooth operations and holding vendors accountable when services are disrupted. Make sure agreements clearly outline these terms to reduce downtime’s impact and keep customer support running effectively.