
Customer portals are only as good as the results they deliver. To prove their value, you need to track metrics that show both adoption and ROI. Here’s how:
- Adoption Metrics: Focus on login frequency, feature usage, and self-service resolution rates. These reveal whether users are actively engaging with your portal and solving issues independently. For example, a 25% self-service resolution rate is a strong indicator of success.
- ROI Metrics: Measure ticket volume reductions, customer health scores, and financial gains like cost savings and churn prevention. A 25% ticket deflection rate could save $30,000 annually for a team handling 1,000 tickets per month.
- AI Tools: Use AI to simplify analytics by automating reporting, predicting customer satisfaction, and identifying at-risk accounts. AI-powered portals can handle up to 50% of service issues without human involvement, cutting costs and improving efficiency.
Metrics That Prove Portal Adoption
Adoption metrics reveal whether customers are actively using your portal or simply logging in once and never returning. This distinction is crucial because 74% of customers will switch to a competitor if the portal’s onboarding process feels overly complicated [4]. By tracking the right metrics early, you can address potential issues and reduce churn.
Login Frequency
Login frequency measures how often customers return to the portal. This can be tracked as daily active users (DAU), weekly active users (WAU), or monthly active users (MAU). However, logging in alone doesn’t necessarily mean customers find value. As Lumenalta points out, "Active usage tells you if analytics is embedded in day-to-day work instead of sitting idle" [1]. To measure true engagement, focus on meaningful actions, like completing tasks or using key features, rather than just logging in.
Segmenting login data by user roles can provide deeper insights. For instance, if admin users log in daily but end users only log in monthly, it could signal a problem. Additionally, with 78% of users preferring mobile access [2], low mobile login rates may highlight usability issues.
Beyond login data, understanding how customers use specific features offers a clearer picture of portal engagement.
Feature Utilization Rates
This metric tracks the percentage of users interacting with specific portal features, such as knowledge base searches, ticket creation, order tracking, payment updates, invoice downloads, or subscription management.
For example, a mid-sized SaaS company found that 40% of their support tickets stemmed from the same ten feature setup questions. By adding an in-app knowledge base and hover-over tooltips for those features, they reduced related technical queries by 55% in just three months [5].
Another useful metric is the ticket-after-portal rate, which measures the percentage of users who visit the portal or search for help but still end up creating a support ticket. If this rate is high, it suggests certain features or articles aren’t meeting user needs. A good benchmark for portal adoption is achieving 60% engagement within the first three months [6].
Tracking how well users resolve issues independently adds another layer of insight into portal adoption.
Self-Service Resolution Rates
This metric calculates the percentage of cases resolved through the portal without requiring agent assistance. The formula is straightforward: (Self-resolved requests / Total requests) × 100 [6]. On average, a well-designed portal achieves a 25% deflection rate [6], while AI-powered portals can resolve up to 50% of service issues without human involvement [5].
Take the example of a European logistics company that launched an AI-driven portal in 2025. It offered real-time shipment tracking and proactive delay notifications, allowing customers to reschedule deliveries or check statuses independently. This resulted in a 52% reduction in ticket volume over six months, saving the company over $7,000 annually in labor costs for a team of 10 [5][6].
Portals with strong self-service capabilities also tend to boost customer satisfaction. Companies that implement these tools often see a 20% increase in Net Promoter Scores (NPS) [5]. Moreover, 67% of customers prefer self-service options over speaking to live agents [5], demonstrating that customers don’t just accept self-service – they actively prefer it.
sbb-itb-e60d259
Metrics That Prove Portal ROI
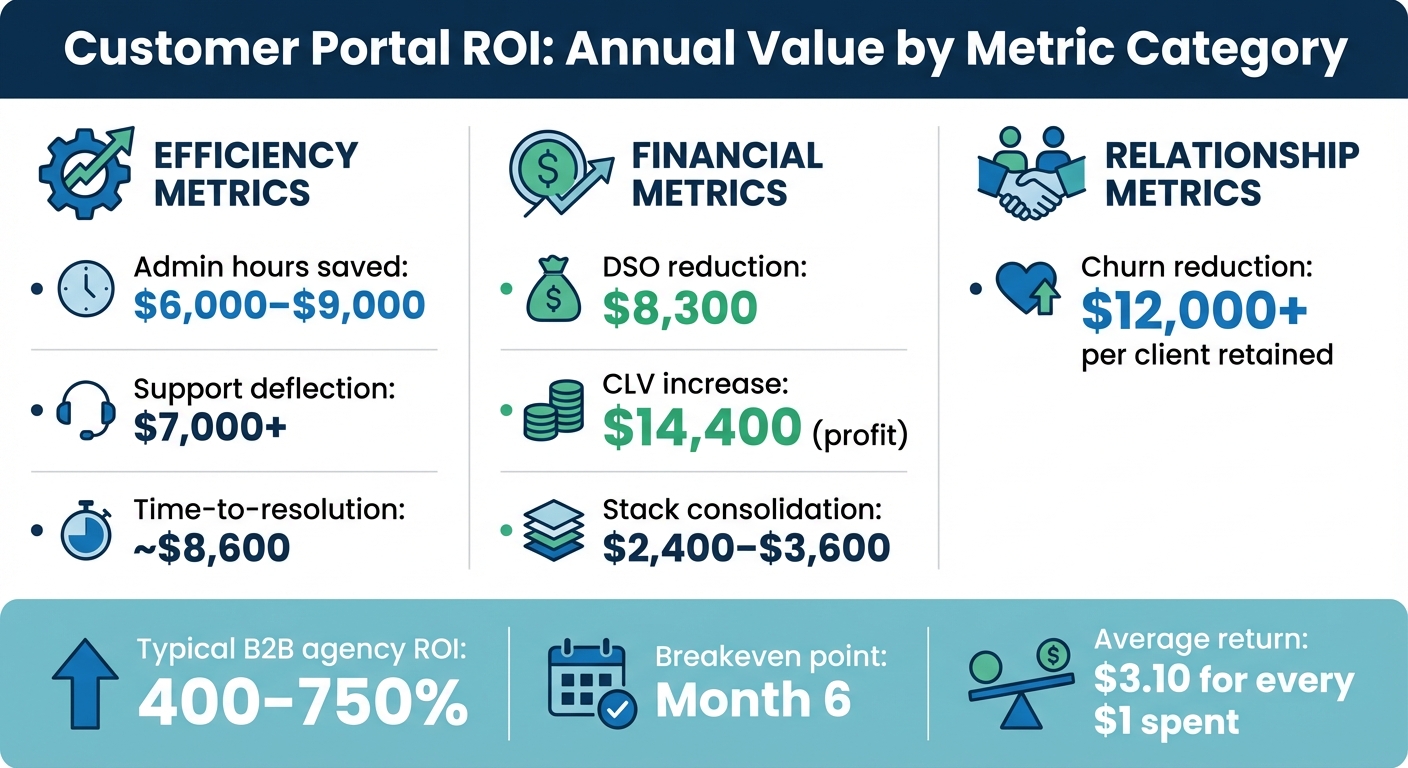
Customer Portal ROI Metrics: Annual Value by Category
Adoption metrics tell you if customers are using your portal, but ROI metrics go a step further – they show why the portal is worth the investment. These metrics directly link to cost savings and increased revenue, offering a clear picture of the financial benefits your portal delivers.
Ticket Volume Reduction
One key metric is how many support tickets your portal prevents by empowering customers to resolve issues on their own. Start by tracking monthly ticket volume before and after launching the portal. The drop in tickets represents deflected cases, which directly translates to savings.
To calculate these savings, multiply the number of deflected tickets by your cost per ticket. For reference, industry costs range from $2–$15 for email tickets and $6–$12 for phone support [5]. For example, if your team handles 1,000 tickets per month at $10 per ticket, a 25% deflection rate saves $2,500 per month, or $30,000 a year.
Additionally, faster resolution times reduce administrative tasks, leading to labor savings. For a 10-person team, this could mean $6,000–$9,000 annually [6].
Customer Health Scores
AI-driven health scores analyze usage patterns, sentiment, and predictive CSAT data to highlight at-risk accounts before they churn. This metric ties portal activity to retention and renewals, offering a clear view of its impact.
For instance, professional services firms face an average annual churn rate of 27% [6]. Retaining just one extra client per year could save $12,000 or more in revenue [6]. Better portal engagement improves transparency and communication, which boosts Client Lifetime Value (CLV) by 10–20% over two years [6]. On a $50,000 annual contract, a 10% CLV increase adds $5,000 in profit, or $14,400 when factoring in upsells and extended relationships [6].
Health scores also allow teams to act proactively. Instead of waiting for complaints, AI flags declining engagement or negative sentiment, enabling early intervention. These insights provide measurable ROI benchmarks.
ROI Calculation Benchmarks
ROI metrics validate the portal’s value by showing how it improves efficiency and generates revenue. The standard ROI formula is: (Gain from Portal – Cost of Portal) / Cost of Portal × 100 [6]. A result above 100% confirms the investment has paid off.
Portal costs typically include software subscriptions ($200–$500 per month), implementation labor ($1,125), and ongoing management ($2,250 annually) [6]. Gains come from efficiency (time saved), financial improvements (faster payments, lower software costs), and relationship value (retention and upsells) [6].
Most B2B agencies achieve 400–750% ROI, with breakeven often occurring by month six [6].
Chris Willow, Founder of Wayfront, explains: "A typical agency sees 400-750% ROI from their portal – most hit breakeven by month 6" [6].
Research from Nucleus Research further supports this, showing an average return of $3.10 for every $1 spent on CRM-related systems [7].
To prove ROI to stakeholders, establish baseline metrics before launching the portal. Track admin hours, Days Sales Outstanding (DSO), churn rates, and ticket volumes. For example, the median DSO in B2B industries is 56 days, but portals can reduce this by about 5 days [6]. On $50,000 in monthly billing, this frees up $8,300 in cash flow annually [6].
| Metric | Category | Annual Value Range |
|---|---|---|
| Admin hours saved | Efficiency | $6,000–$9,000 |
| Support deflection | Efficiency | $7,000+ |
| Time-to-resolution | Efficiency | ~$8,600 |
| DSO reduction | Financial | $8,300 |
| CLV increase | Financial | $14,400 (profit) |
| Stack consolidation | Financial | $2,400–$3,600 |
| Churn reduction | Relationship | $12,000+ per client retained |
To quantify labor savings, multiply saved hours by your team’s hourly rate. For example, saving 3 hours per week at $60 per hour adds up to $9,360 annually [6].
Maxwell Finn from Unicorn Marketers emphasizes: "We measure the success of automation by its direct impact on revenue, not by hours saved" [6].
How to Track Customer Portal Metrics
Tracking customer portal metrics doesn’t require a complicated setup. By consolidating data from your helpdesk, documentation, and communication tools into a single analytics system, you can get a clear picture of how your portal is performing.
Set Up Customizable Dashboards
Start by integrating your support, documentation, and communication tools into one dashboard. Many modern AI-powered platforms offer one-click integrations, making it easy to pull everything together without needing IT support.
You have two main options: use DIY business intelligence (BI) tools or choose integrated AI platforms. DIY BI tools, like Zoho Analytics, require technical expertise to map data for tracking support KPIs. Pricing for Zoho Analytics starts at $24 per month (for 2 users and 0.5 million rows) and goes up to $455 per month for enterprise use (50 users and 50 million rows) [8]. On the other hand, integrated AI platforms come with pre-configured dashboards designed specifically for support metrics. These dashboards let you monitor metrics like automated resolution rates, escalation patterns, and customer health scoring right out of the gate.
Before launching, use simulation modes on historical conversations. This will create a predicted performance dashboard, showing estimated resolution rates and cost savings. It’s important to focus on tracking complete resolutions rather than just shifts between support channels [8].
The next step is using AI to turn this consolidated data into meaningful insights.
Use AI for Predictive Insights
AI can transform raw portal data into actionable insights by detecting patterns that might go unnoticed in manual reviews. Instead of sifting through endless interactions, AI highlights areas where your portal falls short – for instance, identifying gaps in chatbot knowledge or search functionality. This helps you pinpoint opportunities to improve your content.
Kenneth Pangan from eesel AI emphasizes: "The answer isn’t to wrestle with a generic business intelligence (BI) tool that takes a data scientist and a few months to set up. It’s to use an analytics dashboard template for AI performance in support that’s built for the job." [8]
AI also redefines traditional metrics. For example:
- First Contact Resolution (FCR) becomes the Automated Resolution Rate, measuring how well the portal resolves issues without human intervention.
- Average Handle Time (AHT) shifts to Time Saved Per Interaction, focusing on efficiency.
- Ticket Volume evolves into the Escalation Rate, showing how effectively the portal prevents issues from reaching agents.
These insights lay the groundwork for automating reporting and workflows, ensuring your metrics stay current and actionable.
Automate Reporting and Workflows
Once you’ve gathered predictive insights, automate your reporting and workflows to keep metrics updated in real time. Automation eliminates the need for manual reports, replacing them with instant, accurate updates. For example, you can configure event-triggered updates that refresh metrics like duration, cycle time, and approval wait times whenever a self-service action is completed. This also helps you distinguish between Lead Time (the total time from request to completion) and Cycle Time (the time from approval to execution), making it easier to spot bottlenecks and prioritize areas for automation [9].
AI can also streamline content creation by generating help center articles from past ticket resolutions. By analyzing how agents have resolved similar issues in the past, AI creates documentation that improves self-service rates. This creates a feedback loop: better content leads to higher self-service success, which generates more data to refine content even further.
How AI Improves Data Interpretation
AI transforms raw portal data into actionable insights, eliminating the need for time-consuming manual analysis. It turns thousands of customer interactions into clear indicators of what’s working and what needs attention.
Predictive CSAT and FCR Detection
Traditional customer satisfaction (CSAT) surveys often face low response rates, leaving companies with an incomplete picture of customer sentiment. Predictive CSAT and CES analysis fills this gap by analyzing historical case data and resolution trends, providing valuable insights even when survey participation is limited.
Similarly, tracking first contact resolution (FCR) has always been tricky. AI can now evaluate case histories to determine if an issue was resolved during the initial interaction, eliminating guesswork and the need for manual tagging [3].
These predictive tools allow support teams to address potential churn before it happens. By 2025, AI-enhanced customer portals are projected to handle 50% of all customer service issues without human involvement [2]. This not only speeds up data analysis but also sets the stage for more efficient customer support.
AI-Driven Activity Summaries
AI-generated activity summaries simplify the process of understanding customer interactions. Instead of combing through emails, chat logs, and ticket updates, support leaders can quickly access concise overviews of key events, resolutions, and pending tasks.
This is especially helpful for complex B2B accounts, where cases often unfold over long periods. By condensing entire interaction histories into clear narratives, AI saves time and helps teams make decisions faster [3].
Customer Health Scoring with AI
AI takes insights a step further with real-time customer health scoring. This involves analyzing portal usage, ticket sentiment, and engagement patterns to detect issues like declining feature adoption or increasing escalations – going far beyond basic login metrics.
For professional services firms, which often face an annual churn rate of around 27%, these health scores enable proactive measures to retain customers before they leave [6]. The impact becomes even clearer when AI predictions are paired with timestamped actions, allowing companies to measure improvements in retention and evaluate the accuracy of predictions [1].
Agencies using AI-driven health monitoring frequently report a 10–20% increase in Client Lifetime Value (CLV) over two years. This is achieved by identifying upsell opportunities and addressing potential problems early [6]. Such improvements highlight how AI can drive both operational efficiency and measurable returns in customer support.
Conclusion
Tracking the right portal metrics transforms uncertainty into clear, measurable value. These metrics not only highlight usage trends and financial outcomes but also reveal the impact of reduced ticket volumes and improved customer health scores. When paired with ROI calculations, they provide a solid foundation for showing stakeholders the true value of your portal investment.
The real challenge lies not in gathering data but in making it actionable. This is where dashboards and AI analytics step in, turning raw numbers into meaningful insights. AI tools can predict customer satisfaction, automatically detect first contact resolution, and flag at-risk accounts before churn becomes a problem. By automating these processes, AI saves countless hours of manual work and enables quicker, smarter decisions.
These insights build on well-established strategies that drive both adoption and ROI. For companies with complex support needs, AI-native support platforms simplify analytics by offering predictive CSAT, activity summaries, and real-time health scores. This frees up support leaders to focus on enhancing customer experiences instead of wrestling with cumbersome analytics tools.
Current industry trends suggest that advanced AI metrics, like predictive CSAT and health scoring, are becoming indispensable for proactive and efficient support operations [10]. These tools are already helping teams improve performance and achieve better outcomes for their customers.
FAQs
What’s the fastest way to set a baseline before launching a customer portal?
To get started, keep an eye on key metrics that reveal how users currently interact with your platform and how your support team operates. Pay attention to things like login frequency, feature usage, support ticket volume, and the most common user questions. Leverage analytics tools to track user interactions and identify trends in self-service behavior. These benchmarks will serve as a solid foundation for comparing post-launch results and showcasing ROI with confidence.
How do I calculate cost per support ticket for accurate portal ROI?
To figure out the cost per support ticket, take the total support costs and divide them by the number of tickets handled. Make sure to account for all expenses, including agent salaries, platform fees, and operational costs. You can use your portal analytics to track ticket volume over a specific timeframe. Keeping an eye on this metric can help you measure ROI and spot ways to cut costs – especially when using AI to improve efficiency and boost resolution rates.
Which portal events should I track to prove real engagement beyond logins?
To demonstrate genuine engagement beyond just logins, focus on tracking events that reflect active user participation. For instance, look at feature utilization rates, such as how often users engage with self-service tools like articles or chatbots. Dive deeper into search engagement metrics, including the number of queries, success rates, and what actions users take after searching.
Additionally, keep an eye on self-service resolution rates to evaluate how well users solve their issues independently. Another key metric is article interactions, which can show how effectively users are leveraging content to meet their needs without requiring support from an agent.