
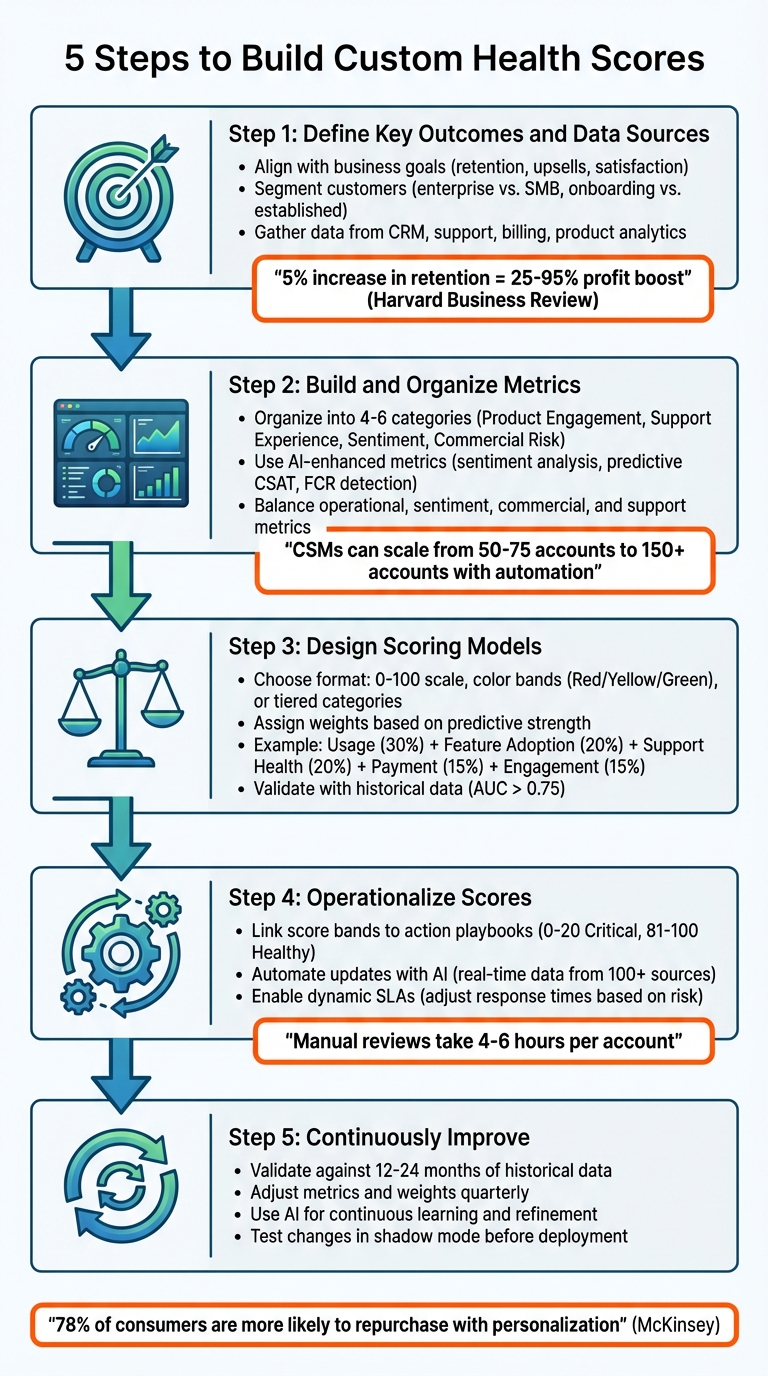
Customer health scores are a powerful tool for B2B support teams to predict churn, improve retention, and identify growth opportunities. Instead of relying on generic models, custom health scores consider unique customer needs, combining data like product usage, support interactions, and sentiment analysis. Here’s how you can create and use them effectively:
- Define Key Outcomes and Data Sources: Align health scores with business goals like retention or upsells. Segment customers (e.g., enterprise vs. SMB) and gather data from systems like CRM, support, and billing.
- Build and Organize Metrics: Focus on a few meaningful categories, such as product engagement, support experience, and sentiment. Use AI to enhance predictive insights.
- Design Scoring Models: Choose formats like 0–100 scales or color-coded bands. Assign weights to metrics based on predictive strength and validate with historical data.
- Operationalize Scores: Use scores to prioritize accounts, automate updates, and integrate them into workflows. Adjust service levels dynamically based on scores.
- Continuously Improve: Regularly test and refine your model using real customer data. Leverage AI to keep metrics accurate and relevant.
5 Steps to Build Custom Customer Health Scores for B2B Support
How to Create a Customer Health Score With 4 Metrics
sbb-itb-e60d259
Step 1: Define Key Outcomes, Segments, and Data Sources
Before diving into building a health score model, it’s crucial to establish what success looks like for your business. Without a clear purpose, health scores can easily turn into meaningless numbers. As Forrester puts it:
A customer health scorecard isn’t a magical crystal ball but it’s a vital tool… with indicators to understand whether or not the customer is satisfied.
Align Health Scoring to Business Goals
The first step is to pinpoint the specific business outcomes your health score should predict. For most companies, retention is the top priority. In fact, Harvard Business Review highlights that increasing customer retention rates by just 5% can lead to a profit boost of 25% to 95%. Beyond retention, think about expansion opportunities like upsells and cross-sells, as well as customer satisfaction metrics such as NPS (Net Promoter Score) and CSAT (Customer Satisfaction Score).
The key is to design your scoring model around outcomes that are measurable and actionable. If your team can’t identify a clear response when a score drops, that metric probably doesn’t belong in the model. Once the outcomes are clear, refine the approach by segmenting your customer base to cater to their unique needs.
Define Key Customer Segments
Not all customers are the same, so your health score metrics shouldn’t be either. For instance, high-touch enterprise accounts with dedicated Customer Success Managers (CSMs) will need different metrics compared to self-service SMB customers. Similarly, customers in the onboarding phase might be evaluated on milestones like completing initial setup or activating their accounts, while established accounts should be assessed based on ROI and feature adoption.
Segmentation can also be based on factors like geography, product lines, or service levels outlined in your SLAs. McKinsey emphasizes that 78% of consumers are more likely to repurchase when they experience personalization. This principle holds just as true in B2B relationships, where tailored health scoring can significantly impact outcomes.
Bring Together Relevant Data Sources
A health score is only as good as the data feeding into it. To create meaningful scores, you need to pull information from various systems into one unified view. Here’s what to focus on:
- Product usage data: Metrics like login frequency and feature adoption help show whether customers are getting value from your product.
- Support data: Look at ticket volume, resolution times, and sentiment trends to identify friction points.
- Commercial data: Payment history and contract value can highlight revenue risks.
- Relationship data: Factors like meeting attendance and email responsiveness provide insight into account stability.
- AI-driven sentiment analysis: This can uncover dissatisfaction early by analyzing the tone and content of support interactions.
Platforms like Supportbench simplify this process by centralizing data from multiple sources, saving teams countless hours of manual work. With your key outcomes, customer segments, and data sources aligned, you’ll be ready to build a robust set of metrics.
Step 2: Build and Organize Your Health Metrics
Now that you’ve defined your outcomes and segments, the next step is to identify and structure the key metrics that can predict customer behavior. This is often where teams feel overwhelmed by the sheer amount of data available. The trick isn’t to track everything but to zero in on a handful of meaningful signals that truly reflect customer behavior.
Organize Metrics by Category
The most effective models group metrics into four to six categories. This approach helps your team understand what drives the health score and what actions are necessary when changes occur. Here are some examples:
- Product Engagement: Metrics like feature adoption and usage frequency indicate whether customers are finding value in your product.
- Support Experience: Metrics such as ticket volume and resolution time highlight potential friction points.
- Sentiment: Tools like NPS, CSAT, and CSM Pulse capture the emotional side of the customer experience, which usage data alone might miss.
- Commercial Risk: Metrics like timely payments and contract value provide insight into trust and stability.
A well-balanced scorecard with a few high-impact metrics helps cut through the noise while still offering a full view of account health. For instance, a common strategy in B2B settings might allocate weightings like this: 30% for usage, 20% for feature adoption, 20% for support health, 15% for payment status, and 15% for engagement. As Kevin Fu, Founder & CEO of Repool, puts it:
"The most advanced health score isn’t the one with the best algorithm. It’s the one your team actually believes in and uses".
Use AI-Enhanced Metrics
AI-powered tools can take health metrics to the next level by offering predictive insights that manual reviews often miss. For example:
- AI Sentiment Analysis: Reviews support tickets and emails to detect frustration patterns before they escalate.
- Predictive CSAT: Assigns satisfaction scores even when customers skip surveys.
- FCR (First Contact Resolution) Detection: Tracks whether issues are resolved on the first try or keep recurring.
These AI-driven metrics transform health scoring from a reactive process into a proactive one. As Eric Klimuk, Founder and CTO of Supportbench, explains:
"By integrating AI into your customer health scoring, you are setting your customer support and retention strategies on a path of proactive, rather than reactive, engagement".
With automated data aggregation, Customer Success Managers can manage larger portfolios – scaling from 50-75 accounts to over 150 accounts.
Compare Different Metric Types
Each type of metric brings its own strengths and limitations, and understanding these nuances can sharpen your model’s accuracy:
- Operational Metrics: These include product usage data from analytics or CRM systems. They’re excellent for spotting churn risks due to inactivity but might overlook "silent churn", where usage remains high, but sentiment has soured.
- Sentiment Metrics: Tools like NPS and CSAT surveys excel at catching emotional dissatisfaction early. However, they can be subjective or suffer from low response rates.
- Commercial Metrics: Billing data from systems like Stripe or ERP platforms signals trust and commitment. However, these are lagging indicators – issues often appear after a churn decision has already been made.
- Support Metrics: Helpdesk data, such as ticket volume or resolution times, is great for identifying immediate friction. But sometimes, high ticket volume can reflect high engagement rather than problems.
Here’s a comparison to help you weigh each metric type:
| Metric Category | Data Sources | Strength | Limitation |
|---|---|---|---|
| Operational/Behavioral | Product Analytics, CRM | Strong for predicting churn due to inactivity | May miss "silent churn" with high usage but low sentiment |
| Sentiment/Feedback | NPS, CSAT, AI Sentiment Analysis | Excellent for spotting emotional dissatisfaction | Often subjective or limited by low response rates |
| Commercial/Financial | Billing Systems (Stripe), ERP | Reliable indicator of trust and commitment | Lagging indicator; issues surface post-churn decision |
| Support Experience | Helpdesk (Supportbench) | Great for identifying immediate friction | High ticket volume can sometimes reflect engagement rather than problems |
The goal is to balance these metrics to create a complete picture. Operational data shows what customers are doing, sentiment data reveals how they feel, and commercial metrics confirm their level of commitment. Together, these insights can guide your team toward smarter, more proactive decisions.
Step 3: Design Scoring Models and Weight Metrics
Now that your metrics are clearly defined and sorted, it’s time to bring them together into a scoring model that your team can rely on.
Choose a Scoring Format
There are several ways to format your scoring model:
- Numeric scores (0–100): These are ideal for precision and tracking gradual changes over time.
- Color-coded bands (Red/Yellow/Green): Perfect for quick, visual insights at a glance.
- Tiered categories (Healthy, At Risk, Critical): Useful for triggering specific, action-oriented playbooks.
Most B2B teams opt for a mix of these formats. For instance, you might use numeric scores in your CRM for detailed monitoring but apply color coding in customizable data dashboards to make prioritization easier. The key isn’t the format itself but whether your team can quickly identify which accounts need attention and understand the reasons behind it.
Set and Adjust Metric Weights
Weights are what make your scoring model actionable. Start by analyzing historical data – look at accounts that have churned versus those that renewed and pinpoint the metrics that stood out as strong predictors. Use this analysis to create a custom weighting formula that aligns with your business goals. For example:
Usage (30%) + Feature Adoption (20%) + Support Health (20%) + Payment Status (15%) + Engagement (15%).
To ensure fairness, scale all metrics to a consistent range (e.g., 0–100) before assigning weights. Then, validate your model by testing it against historical data. Do low-scoring accounts correlate with churn? Do high scores predict renewals? If the results don’t align with reality, tweak the weights until the model accurately reflects outcomes.
As Forrester explains:
The creation of a customer health score requires a combination of metrics that can include quantitative data as well as subjective data from customer success managers on the quality of the client relationship.
Once your format is set, assign weights to each metric based on its predictive strength. You can also customize these weights by customer segment to account for differences in behavior and priorities.
Create Tiered Scoring for Customer Segments
A one-size-fits-all scoring model rarely works across diverse customer types. The definition of "health" varies widely depending on whether you’re evaluating a newly onboarded account or a long-term enterprise client.
For onboarding accounts, focus on metrics like milestone completion, login activation, and initial support volume. These show whether customers are quickly finding value. In contrast, mature accounts should be assessed on metrics like ROI delivery, product depth, and upsell activity, which reflect long-term engagement and growth potential.
Different customer types also require tailored approaches:
- High-touch accounts: Prioritize relationship-based metrics such as executive engagement and QBR cadence.
- Digital or low-touch accounts: Lean on automated signals like in-app activity and knowledge base usage.
Here’s a breakdown of how metrics vary by segment:
| Segment Type | Key Metrics to Emphasize | Why It Matters |
|---|---|---|
| Onboarding Accounts | Milestone completion, login activation, support volume | Tracks time-to-value and identifies early friction |
| Mature Accounts | ROI delivery, product depth, NPS/CSAT, upsell activity | Measures long-term value and readiness for growth |
| High-Touch Accounts | CSM sentiment, exec engagement, QBR cadence | Reflects the strength of relationships and alignment |
| Digital Accounts | In-app activity, knowledge base usage, feature adoption | Monitors health through automated behavior signals |
Tailoring your scoring model by segment ensures it stays relevant and actionable across your customer base.
Step 4: Operationalize Health Scores in Daily Workflows
Creating a health scoring model is just the beginning. The real impact comes when you weave those scores into your team’s everyday routines. By doing so, these scores evolve from static dashboard metrics into actionable tools that drive decisions, streamline resource allocation, and improve customer management.
Use Health Scores for Proactive Engagement
Health scores allow your team to shift from reacting to problems to managing accounts proactively. Instead of waiting for issues to surface, you can use color-coded score bands – Red for Critical, Yellow for Watch, and Green for Healthy – to guide your team’s outreach priorities based on clear risk indicators. This system ensures potential problems are addressed before they escalate.
The best teams go a step further by linking score ranges to specific playbooks. For instance, accounts in the 0–20 range (Critical/Red) might trigger an "At-Risk Save Play", involving executive involvement and focused engagement. Meanwhile, accounts scoring 81–100 (Healthy/Green) can follow nurture or expansion playbooks aimed at advocacy and upsell opportunities. This structured approach eliminates guesswork, ensuring consistent, data-driven actions across all accounts.
| Health Score Band | Status | Action/Playbook |
|---|---|---|
| 81–100 | Healthy (Green) | Nurture, Advocacy, Expansion Play |
| 61–80 | Stable (Light Green) | Standard Maintenance, Feature Adoption |
| 41–60 | Watch (Yellow) | Feedback Conversation, Relevant Content |
| 21–40 | At Risk (Orange) | Intensive Engagement, Personal Check-ins |
| 0–20 | Critical (Red) | At-Risk Save Play, Executive Escalation |
By combining proactive engagement with automation, you can ensure these scores remain accurate and actionable at all times.
Automate Updates and Insights with AI
Automation takes health scoring to the next level by keeping scores up-to-date without manual intervention. Relying on manual updates can be time-consuming – comprehensive reviews might take 4–6 hours per account, leaving data outdated by the time it’s analyzed. AI-powered platforms solve this by continuously updating scores as new data flows in from sources like support tickets, product usage, billing systems, and CRM activity.
For example, Supportbench integrates data from over 100 sources to provide real-time updates and detailed insights into score changes. It even highlights the top three factors driving a score shift, whether it’s reduced product usage, an uptick in support requests, or negative feedback. This level of clarity allows customer success managers (CSMs) to address specific issues instead of relying on generic outreach. With this efficiency, teams can scale from managing 50–75 accounts to over 150, focusing only on high-risk signals and exceptions.
Enable Dynamic SLAs and Capacity Planning
To fully embed health scores into daily operations, service levels should adapt to customer risk profiles. Traditional service level agreements (SLAs) treat all customers equally, regardless of their health score. Dynamic SLAs change this by aligning response times and service levels with real-time risk assessments. For instance, if an account’s score drops below 50, the system can automatically reduce response times (e.g., from 4 hours to under 2 hours) and escalate cases to senior support staff.
This ensures that at-risk accounts receive personalized, high-priority service when they need it most. Meanwhile, accounts with higher scores and routine inquiries can be efficiently handled by Tier 1 agents. As Eric Klimuk, Founder and CTO of Supportbench, explains:
The purpose of business should be to make life better for people. With [customer health scoring], businesses can do exactly that – make life better for their customers.
| Service Level Component | Standard Service (High Health) | Enhanced Service (Low Health/At-Risk) |
|---|---|---|
| Response Time | Standard (e.g., 4–8 hours) | Accelerated (e.g., less than 2 hours) |
| Agent Seniority | Tier 1 / General Support | Tier 3 / Senior Technical Lead |
| Engagement Type | Reactive (ticket-based) | Proactive (check-in calls, personalized emails) |
| Escalation Path | Standard Management | Executive Sponsorship / CSM Intervention |
Step 5: Validate and Continuously Improve Your Model
Building a health scoring model is just the beginning. To keep it effective in predicting churn, expansion, and retention, you’ll need to validate it regularly and make ongoing adjustments.
Validate Scores Against Outcomes
To ensure your model is actually working, compare its predictions against historical data from the last 12–24 months. Look at whether accounts flagged as "at-risk" align with actual churn and whether "healthy" accounts lead to renewals. This process reveals whether your model is making accurate predictions or just generating noise.
For a statistical benchmark, use the Area Under the ROC Curve (AUC) – a score above 0.75 generally indicates reliable predictions. Additionally, calculate churn lift to see how much more likely flagged accounts are to churn compared to the average. Keep an eye on the false-positive rate to avoid overwhelming your team with unnecessary alerts.
| Validation Metric | Purpose | Target Benchmark |
|---|---|---|
| AUC (Area Under Curve) | Assesses the model’s ability to distinguish churners | > 0.75 |
| Churn Lift | Measures how much more likely at-risk customers are to churn | Positive correlation |
| False Positive Rate | Tracks how often healthy customers are flagged as at-risk | Minimize to reduce alert fatigue |
| Null Rate | Monitors missing data for key health indicators | < 5% |
Adapt Metrics and Weights Over Time
Your business isn’t static, and neither should your health scoring model be. Adjust the model’s metrics and weights quarterly using feature-importance analysis. To manage this effectively, implement a change-control process to track adjustments. For example, monitor AUC drift and data null rates monthly to identify areas that need recalibration.
Before rolling out any changes, test them in "shadow mode" for at least one quarter. This allows you to observe their impact without affecting live operations. Keep clear documentation of every update (e.g., version numbers like v1.2, v1.3) and the reasoning behind each adjustment. This structured approach ensures transparency and keeps the model from turning into an unexplainable "black box."
Use AI for Continuous Improvement
Once your model’s weights are updated, AI can take over to refine it further. AI tools can process data from various sources – like support tickets, usage stats, billing records, and CRM platforms – in real time to keep scores accurate. For example, platforms like Supportbench can automatically identify factors influencing score changes.
Machine learning models enhance predictions by continuously learning from new customer behaviors. They can adjust the importance of specific metrics without requiring manual updates. As Eric Klimuk, Founder and CTO of Supportbench, explains:
By incorporating new data and customer behaviors over time, AI models refine their predictive capabilities. Regularly review and update your model to ensure it reflects the current reality.
To take it a step further, use scenario simulators – essentially "what-if" sandboxes – to test how changes, like increasing feature adoption by 20%, could influence health scores. Set up automated alerts to catch issues like null rates exceeding 5% or abnormal score distributions. This proactive approach helps you address data quality problems before they affect your model’s accuracy.
Conclusion: Simplify and Scale with Custom Health Scores
By following a structured approach, custom health scores transform B2B customer support from reactive problem-solving to proactive strategy. Instead of scrambling to address issues during renewals, these scores help you spot at-risk customers early and focus on accounts showing signs of declining health – not just those raising complaints. This shift has a measurable financial impact: even a modest 5% increase in customer retention can drive profits up by 25% to 95%.
Traditional manual account reviews limit Customer Success Managers (CSMs) to managing just 50–75 accounts, making it tough to scale operations without hiring more staff. Here’s where AI-native platforms come in. These tools automate data collection, update health scores in real-time, and provide actionable insights, removing the bottleneck of manual processes. As Eric Klimuk, Founder and CTO of Supportbench, puts it:
By integrating AI into your customer health scoring, you are setting your customer support and retention strategies on a path of proactive, rather than reactive, engagement.
With automation taking care of the heavy lifting, CSMs can handle portfolios of 150+ accounts without compromising on quality. This innovation enables a more efficient and scalable support system.
AI-powered platforms embed health scoring directly into daily workflows. For instance, they can trigger dynamic service-level agreements (SLAs) when scores dip, send real-time alerts via tools like Slack, and integrate insights into CRM dashboards where teams already operate. By combining data from support tickets, usage metrics, and sentiment analysis, these platforms replace disjointed systems and costly add-ons with a streamlined, cost-effective solution. The outcome? A support operation that scales seamlessly, safeguards revenue, and converts customer data into actionable strategies – all without adding headcount or straining IT resources.
FAQs
What metrics should I use to create an effective customer health score?
To build a meaningful customer health score, begin by clearly defining what "healthy" means for your B2B customers in a way that aligns with your business objectives. Think about outcomes that matter most to your company, such as renewals, upsells, or lowering support costs. From there, identify measurable signals that tie directly to those goals. Leading indicators – like how often customers use your product or patterns in support tickets – can help you take action early, while lagging indicators – like customer satisfaction (CSAT) or revenue growth – validate the effectiveness of your strategies.
Organize your metrics into four main categories: product usage, support engagement, customer sentiment, and financial health. For instance, you might track data like login frequency, feature adoption rates, ticket volumes, survey responses, and renewal trends. When starting out, keep it simple by focusing on key metrics such as usage rate, Net Promoter Score (NPS) or CSAT, and a "pulse score" from your customer success manager (CSM) based on recent interactions.
Once you’ve established your metrics, test them for both accuracy and relevance. Evaluate sample accounts to see if the scores align with real-world outcomes, like customer retention or churn. Adjust the weighting of each metric based on how well it predicts those outcomes. Keep the model straightforward, but leave room for improvement as you gain access to new data sources, such as insights generated by AI. This approach ensures your health score stays actionable and efficient, meeting the evolving demands of modern customer success teams.
How does AI improve customer health scoring?
AI takes customer data and turns it into meaningful health scores by evaluating critical indicators like how customers use a product, ticket volumes, escalation patterns, feedback sentiment, and billing behaviors. These factors are merged into a live, real-time score, offering teams a clear snapshot of customer health at any moment.
By seamlessly pulling data from systems like ticketing platforms, CRM tools, and analytics software, AI removes the need for manual data handling. This not only improves accuracy but also saves valuable time. With these insights, support teams can quickly spot accounts that might be at risk, focus their efforts where it matters most, and take early action to boost customer retention – all while keeping operations efficient and scalable.
How can I effectively use health scores in my daily customer support workflows?
To make health scores a natural part of your daily workflows, start by embedding them into the tools your team already relies on. For instance, you can display predictive health scores directly on customer records. This way, agents can instantly see whether a customer is in the "green", "yellow", or "red" zone without interrupting their usual processes.
Set up real-time alerts to flag when a health score dips below a specific threshold. These alerts can prompt immediate actions, like assigning follow-ups or scheduling quick team huddles to address concerns. You can also discuss health scores during daily stand-ups to prioritize at-risk accounts, ensuring the team’s energy goes toward customers who need attention the most.
Lastly, use the results of your team’s interventions to improve the scoring model. By analyzing resolved cases and listening to customer feedback, your health scores can become increasingly precise over time. This not only helps reduce churn and safeguard revenue but also keeps your operations running smoothly.