
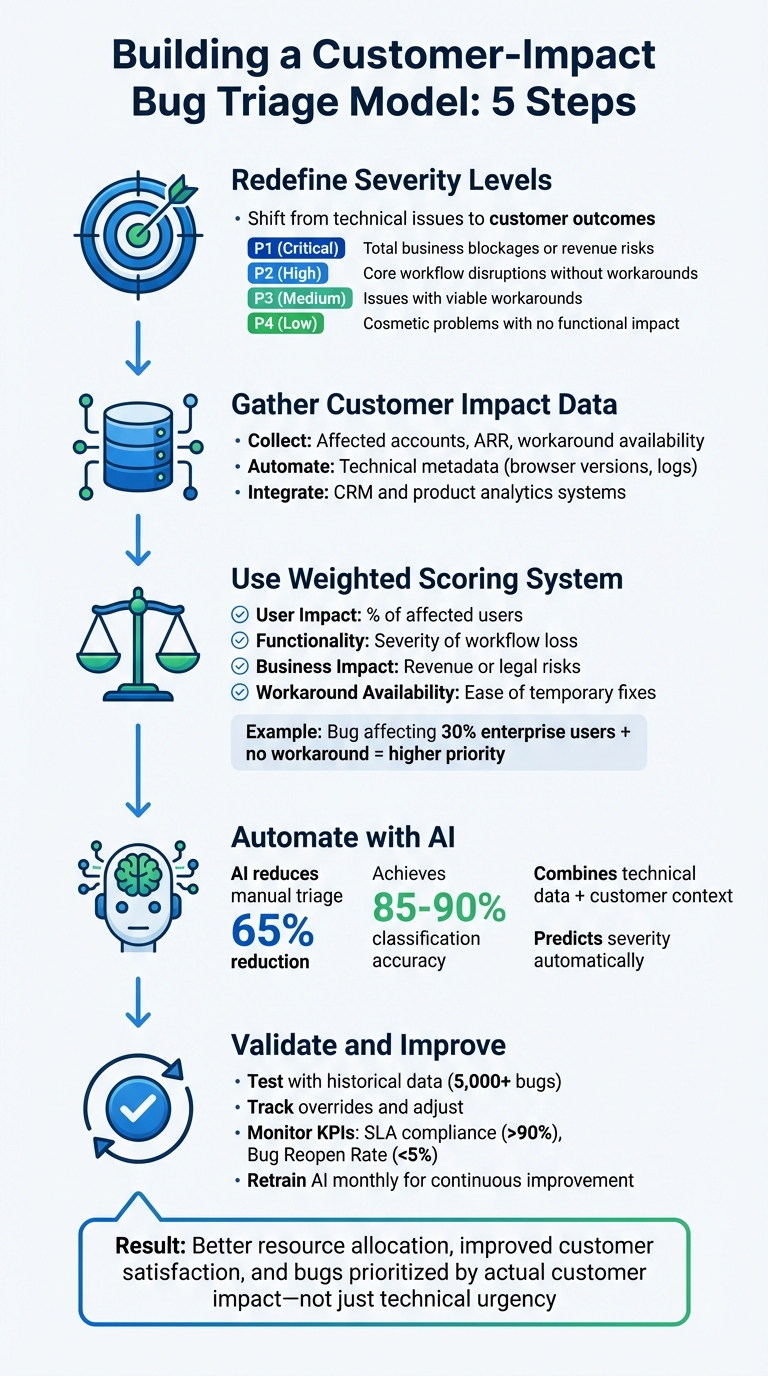
To build a bug triage severity model that aligns with customer impact, focus on outcomes over technical urgency. Traditional models often prioritize technical metrics, but an impact-driven approach centers on customer pain, ensuring bugs that affect workflows or revenue are addressed first. Here’s how to get started:
- Redefine Severity Levels:
Shift from technical issues (e.g., crashes) to customer outcomes (e.g., blocked workflows or financial risk). For example:- P1 (Critical): Total business blockages or revenue risks.
- P2 (High): Core workflow disruptions without workarounds.
- P3 (Medium): Issues with viable workarounds.
- P4 (Low): Cosmetic problems with no functional impact.
- Gather Customer Impact Data:
Collect structured data like affected accounts, ARR (Annual Recurring Revenue), and workaround availability. Use automation tools to capture technical metadata (e.g., browser versions, logs) and integrate systems like CRM and product analytics. - Use a Weighted Scoring System:
Assign points to key factors such as:- User Impact: Percentage of affected users.
- Functionality: Severity of workflow loss.
- Business Impact: Revenue or legal risks.
- Workaround Availability: Ease of temporary fixes.
For example, a bug affecting 30% of enterprise users with no workaround would score higher than a minor UI glitch.
- Automate with AI:
AI models can analyze bug reports, predict severity, and reduce manual triage efforts by up to 65%. They combine technical data and customer context for more accurate prioritization. - Validate and Improve:
Test the model with historical data, track overrides, and adjust based on feedback. Monitor KPIs like SLA compliance and customer experience metrics to ensure the model reflects actual customer needs.
This approach ensures bugs are prioritized based on their impact on customers, not just technical urgency, leading to better resource allocation and improved satisfaction.
5-Step Bug Triage Severity Model Based on Customer Impact
Defect Triage in software testing | Defect Triage Meeting
sbb-itb-e60d259
How to Define Severity Levels Using Customer Outcomes
Traditional severity models often prioritize technical issues like crashes or error codes. However, a customer-focused approach shifts the question to: What impact does this have on the customer’s business? Take, for instance, a DNS misconfiguration. Technically, it might seem minor during an audit, but as the Milestone Team documented, ignoring its business impact led to a global crisis.
An outcome-based evaluation considers factors like user impact, functionality loss, business risk, and the availability of workarounds. In January 2026, Checkly shared an example where a checkout failure on an ecommerce site affected only Microsoft Edge users. Although fewer than 5% of users were impacted, the issue was classified as SEV1 (High) because the functionality loss was total – users couldn’t check out, directly affecting revenue – and there was no viable workaround. This approach ensures severity levels reflect the real-world consequences for customers, not just technical failures.
Connect Severity Levels to Customer Pain Points
Once outcomes are defined, the next step is to tie severity levels to specific customer pain points: business blockages, financial risks, productivity losses, and workaround challenges.
- P1 (Critical): Business is completely blocked, or revenue is at risk, such as widespread login failures or significant data loss.
- P2 (High): Core workflows are disrupted without an easy workaround, like issues with downloading billing invoices.
- P3 (Medium): Inconveniences that have acceptable workarounds, such as retrying to upload attachments.
- P4 (Low): Cosmetic issues with no functional impact, like typos or misaligned UI elements.
The "blast radius" of a bug – the extent of its impact – is equally important. Factors like ARR (Annual Recurring Revenue) tier, strategic account status, or lifecycle stage can influence severity. For example, a bug affecting a $500,000 ARR account during onboarding is far more critical than the same issue impacting a $5,000 account in a stable phase.
Combine Technical and Customer-Focused Factors
To align technical assessments with customer outcomes, it’s essential to integrate objective metrics with customer context. A balanced severity framework uses standardized evidence to guide decisions. As Support Oasis explains:
Severity captures scope and breakage… Priority sets action
This means separating measurable facts – such as the number of affected users, ARR tier, and issue frequency – from subjective urgency. Fitgap echoes this, noting:
Urgency is not the same as impact
A weighted scoring system can help refine prioritization by evaluating factors like User Impact, Functionality, Business Impact, Urgency, and Workaround Availability. For instance:
- User Impact: 1 point for less than 5% of users, 2 points for 5–25%, and 3 points for more than 25% or all users.
- Total scores: 12–15 points indicate SEV1, 8–11 points align with SEV2, and 5–7 points with SEV3.
This structure minimizes debates over severity levels. As Checkly puts it:
When engineers know exactly what qualifies as a SEV1, they don’t waste time debating – they act
AI tools can further streamline this process, achieving up to 90% classification accuracy. By combining technical data – like error codes and stack traces – with historical patterns such as past escalations, AI can assign severity scores that reflect both technical breakage and customer impact.
How to Collect and Analyze Customer Impact Data
An impact-driven severity model takes data from various disconnected systems and turns it into actionable insights. Without automation, support teams can spend up to 26 hours each year manually collecting this data – a significant drain on resources.
The first step is to standardize how customer impact evidence is entered into your system. Then, automate integrations between your support, product, and business systems. Without these steps, severity decisions often remain inconsistent and subjective. Afterward, focus on identifying the key data sources that reveal customer impact.
Where to Find Customer Impact Data
Customer impact data typically comes from four main sources: support systems, CRM, product analytics, and billing systems. Unfortunately, these systems don’t always integrate seamlessly.
Start by setting up mandatory intake fields in your bug reporting tool. This ensures structured evidence – like the number of affected accounts, ARR band, frequency, and workaround difficulty – is included, replacing vague labels like "urgent". For example, tools such as Jira Service Management can block ticket submissions if required evidence, such as account IDs or log links, is missing.
Automated tools can further simplify this process by collecting technical metadata, cutting down on back-and-forth communication. Tools like Marker.io (starting at $39/month) or Shake automatically gather details such as operating system, browser version, URL, console logs, and screenshots. This automation allows developers to focus more on solving the issue rather than chasing data.
Beyond reducing manual work, automated data capture also supports AI-driven analysis, which is becoming essential in modern B2B support.
To bring customer context into bug reports, create a Ticket Analytics View using SQL materialized views. These views can combine ticket data with CRM fields (e.g., tier, monthly recurring revenue) and product details (e.g., version, error type). This consolidated view not only highlights what failed but also shows who is affected and the potential revenue impact.
How to Measure Business and Customer Outcomes
Once your data sources are connected, you can measure impact through three perspectives: quantitative reach, business value, and operational disruption.
1. Quantitative Reach
This answers the question, "How many customers are affected?" Track the percentage of your user base impacted – less than 5%, between 5–25%, or more than 25%. A bug affecting a small number of high-value users can carry more weight than one impacting many low-value users.
2. Business Value
Metrics like ARR, Annual Contract Value (ACV), plan tier (self-serve vs. enterprise), and the strategic importance of the customer help gauge business value. Research by IBM’s Lloyd Montgomery and Daniela Damian, based on over 2.5 million support tickets, found that machine learning models trained on customer tier and historical escalation patterns achieved 79.9% recall in predicting escalations. This reduced manual workload for support analysts by 80.8%.
3. Operational Disruption
This focuses on whether the issue blocks critical workflows like billing, onboarding, or reporting, or if it’s a minor cosmetic problem. Natural Language Processing (NLP) can further analyze ticket sentiment, identifying frustration, anger, or urgency to assess emotional impact. IrisAgent explains:
The prioritization decision becomes much less binary when you add sentiment and revenue… it all boils down to which customer – were they to churn – would have the most negative impact on the company’s business?
To stay ahead of potential issues, set up anomaly detection using SQL-based statistical monitoring. This can flag spikes in ticket volume or resolution times – anything more than two standard deviations from a three-week average. Catching these patterns early can prevent up to 80% of escalations, helping you address high-impact problems before they escalate.
These approaches lay the groundwork for a refined, impact-driven scoring model, ensuring that customer and business priorities are aligned.
How to Build an Impact-Driven Scoring Model
Creating a scoring system based on customer impact data can help you prioritize bugs objectively. By assigning numerical weights to different impact factors, you can eliminate guesswork from triage decisions. For example, a bug affecting 30% of enterprise customers will naturally take precedence over a minor cosmetic issue flagged by a single free-tier user, even if that user is persistent with follow-up emails.
The key is to base your model on measurable data rather than the sheer volume of complaints. Severity should be calculated using factors like the percentage of affected users, the extent of functionality loss, and whether workarounds exist.
Create a Weighted Scoring Framework
Start by identifying the dimensions that matter most to your customers and your business. Common dimensions include User Impact, Functionality, Business Impact, Urgency, and Workaround Availability. Assign point values to each dimension based on severity.
| Dimension | Low (1 pt) | Medium (2 pts) | High (3 pts) |
|---|---|---|---|
| User Impact | <5% affected | 5–25% affected | >25% or all users affected |
| Functionality | Cosmetic/minor bug | Partial functionality loss | Core feature broken, no workaround |
| Business Impact | No SLA/revenue risk | Mild SLA/revenue concern | Revenue loss or legal exposure |
| Urgency | Can wait for a sprint | Fix in a day or two | Requires immediate attention |
| Workaround | Easy workaround exists | Possible but painful | No workaround available |
Once you’ve scored the dimensions, you can map the total to severity levels: 5–7 points = SEV3 (Low), 8–11 points = SEV2 (Medium), and 12–15 points = SEV1 (High).
Security vulnerabilities should always be treated as critical, regardless of their immediate functional impact. Even a minor data exposure affecting a small user base can carry serious compliance or reputational risks. Similarly, major UX flaws that block essential workflows should be weighted heavily, as 88% of users are likely to abandon an app after repeated usability issues. This scoring approach helps safeguard customer outcomes by addressing security threats and workflow disruptions effectively.
For teams dealing with a high volume of bugs, this framework can be scaled with automation.
Use AI to Automate Scoring
AI can take the weighted scoring framework to the next level, ensuring accuracy and consistency at scale. While manual scoring works for smaller volumes, automation becomes essential when handling over 100 bugs per month. AI models can analyze bug reports, extract key features, and predict severity with an accuracy of 85–90%, compared to the 60–70% accuracy typical of human triage. These models examine factors like stack traces, error keywords, description length, and the reliability of the reporter. Fine-tuning advanced models like CodeBERT can further improve accuracy by 29–140%.
A real-world example of such automation is Microsoft’s "DeepTriage", which was deployed in October 2017 for Azure cloud services. Using a combination of gradient-boosted classifiers and deep neural networks, DeepTriage analyzes incidents and routes them to the appropriate teams. It achieved an impressive 82.9% F1 score on real incident data. As Phuong Pham and colleagues at Microsoft explained:
"An incorrect assignment risks additional incident reroutings and increases its time to mitigate by 10x."
For those new to AI-driven triage, starting with simpler, interpretable models – like combining TF-IDF with Random Forest – is a good first step before moving to more complex transformer-based models. By incorporating both text analysis (to capture meaning from bug descriptions) and numerical metadata (like customer ARR, plan tier, and system logs), you can create a hybrid scoring model that accounts for both technical and business impacts.
AI can also predict resolution times by analyzing factors like component complexity and historical developer performance. This allows teams to proactively flag bugs that are likely to breach SLAs, ensuring critical issues are resolved before they escalate. The result? A 65% reduction in manual triage efforts and more consistent severity assessments across your organization.
How to Implement and Validate Your Triage Model
Test the Model with Historical Data
Before introducing your triage model across the entire support organization, it’s crucial to validate it using at least 5,000 historical bugs. This retrospective testing helps determine whether the model’s scoring framework would have accurately classified past incidents. By comparing the model’s predictions with the original human triage decisions – and, more importantly, the actual customer outcomes – you can gauge its effectiveness.
Make it a habit to validate the model monthly using historical escalations. Review a sample of both accepted and deferred escalations to confirm that the model’s scores align with real-world customer outcomes. Focus on cases where mandatory impact fields – like affected customer count, ARR band, and blocked business outcomes (e.g., onboarding delays or billing issues) – are present, as these fields provide clear indicators of incident severity.
Additionally, track human overrides to uncover gaps in the scoring framework and refine it accordingly. Once historical validation is complete, shift your attention to ongoing KPI monitoring and iterative improvements.
Track KPIs and Adjust for Better Accuracy
After deployment, keep a close eye on key performance indicators (KPIs) to ensure the triage model is effectively capturing customer impact. If the Bug Reopen Rate exceeds 5%, it could signal potential misclassification issues. Other critical metrics to monitor include SLA Compliance (aim for >90%), Time to Resolution, and customer satisfaction scores (CSAT, CES, NPS), segmented by severity. For example, if customers affected by SEV2 bugs report satisfaction levels similar to those dealing with SEV3 issues, the model might be missing critical pain points. Breaking down these metrics by customer segment – such as high-ARR enterprise accounts versus self-serve users – can also uncover hidden weaknesses in the triage logic.
Treat your triage model like a product with version control. Label each iteration (e.g., v1.0, v1.1) and track performance shifts with every update. Document any changes made in response to override patterns or KPI trends to ensure measurable progress. These metrics feed directly into an AI-driven improvement cycle, helping you fine-tune the model over time.
Use AI Tools for Continuous Improvement
AI-powered triage models thrive on continuous learning through automated retraining and human feedback loops. Set up the system to retrain monthly using at least 5,000 tickets, ensuring it adapts to new bug types and changes in system architecture. Manual severity adjustments should also be captured as training data.
"Triage updates the index for continuous learning and improvement. To continue enhancing its performance, it’s important for Service Desk Agents to reroute any incorrectly predicted tickets." – Moveworks
Start with a high confidence threshold – around 80% – to build trust in AI recommendations. As accuracy improves, you can gradually lower this threshold to expand the model’s coverage. Incorporate intent and sentiment analysis to refine severity assignments based on customer frustration levels. For instance, high-urgency phrases like "data leak" or "system breach" can trigger automatic priority adjustments. Before rolling out a new version, test it against the current model using a 10% ticket sample to confirm improvements.
Field studies show that adaptive AI retraining can significantly reduce support workloads. This iterative approach ensures the model evolves alongside customer needs, transforming a static set of rules into a dynamic system that improves with every bug report. By doing so, it continues to safeguard high-value accounts and better addresses customer concerns.
Conclusion
Building a bug triage severity model means moving beyond isolated technical metrics to focus on customer impact, as outlined in this guide. The best models rely on standardized evidence collection and weighted scoring frameworks that factor in key elements like the number of affected customers, ARR segments, business risk, and the availability of workarounds. By using concrete data fields instead of subjective descriptions, you can avoid baseless escalations and create a system that prioritizes measurable customer pain.
Built-in AI automation transforms what was once a manual bottleneck into a scalable process. With 85-90% accuracy in severity classification, compared to the 60-70% range for human triagers, AI-powered models can cut manual effort by 65%. For example, IBM researchers achieved a 79.9% recall rate in predicting escalations and reduced analyst workload by 80.8% by training their model on over 2.5 million support tickets. These improvements come from Natural Language Processing (NLP) that understands sentiment and context – not just keywords.
Ongoing refinement is key. Treat your triage model like a product: version it, track overrides, and perform monthly audits to compare accepted versus deferred escalations. Feed manual corrections back into the AI system to improve accuracy over time. This ensures your model adapts to evolving customer needs rather than becoming outdated and rigid.
To put these strategies into action, start with mandatory impact fields, implement a weighted scoring system, and let AI handle the repetitive tasks. This approach leads to faster response times, smarter resource allocation, and scalable support operations. When your triage model aligns with real customer outcomes, you safeguard revenue, maintain satisfaction, and free up your team to tackle complex challenges that require human expertise. This AI-driven, customer-focused strategy sets the foundation for efficient, modern support operations.
FAQs
How does a customer-focused severity model enhance bug triage?
A severity model that prioritizes customer impact transforms how teams handle bug triage. Instead of sticking to traditional technical severity labels, this approach zeroes in on issues that directly affect customers – things like downtime, usability glitches, or service disruptions. These are the problems that cause the most frustration and need immediate attention.
By putting customer outcomes first, teams can tackle the most pressing issues faster, leading to happier customers and smarter use of resources. The result? Smoother support operations and a noticeably improved customer experience.
How does AI help automate bug severity classification to reflect customer impact?
AI streamlines the process of classifying bug severity by leveraging machine learning and natural language processing (NLP). These technologies analyze unstructured bug reports and convert them into structured data formats that models – like neural networks or transformers – can process. As a result, AI can quickly and accurately predict the severity of bugs, cutting down on manual work and providing consistent evaluations.
By automating the triage process, AI handles cases with high certainty on its own, while forwarding unclear or complex issues to human analysts for further review. This system not only boosts efficiency but also ensures that severity levels reflect the actual impact on customers. Plus, it helps prioritize critical bugs, keeping support operations focused on what matters most.
How can businesses keep their bug triage severity model effective over time?
To keep a bug triage severity model effective, businesses should embrace a process that evolves alongside customer needs. This means regularly revisiting and updating severity criteria based on feedback from customers, support outcomes, and performance data. Relying on fixed rules can lead to outdated practices, so periodic reviews are essential to ensure the model stays aligned with what matters most to customers.
Integrating AI-driven tools into this process can make a big difference. These tools can analyze ticket data to uncover patterns and shifts in how bugs impact customers. By combining the power of automation with insights from support teams and direct customer input, businesses can keep their severity model relevant and focused on real-world priorities.