
Building effective account briefings for QBRs is about turning support data into actionable insights. Instead of just counting tickets, focus on identifying trends, risks, and opportunities that matter to your customer’s business goals. Here’s what you need to know:
- Pull Relevant Data: Use metrics like ticket volume trends, resolution times, escalation patterns, and sentiment analysis. Segment data by account, date, and issue type for clarity.
- Analyze for Insights: Spot patterns, tie metrics to business outcomes, and focus on the customer’s goals. For example, link a spike in tickets to a product launch or reduced resolution time to saved hours.
- Structure Your Briefing: Include an executive summary, goal progress, challenges, opportunities, and a clear action plan. Keep it concise and tailored to the customer’s stage in the lifecycle.
- Automate with AI: Use AI tools to save time on data collection, analysis, and report drafting. This cuts prep time by up to 68%, letting you focus on strategic discussions.
The goal is to make QBRs impactful by presenting clear, actionable insights that align with customer priorities. By automating repetitive tasks, you can shift your focus to delivering value through meaningful conversations.
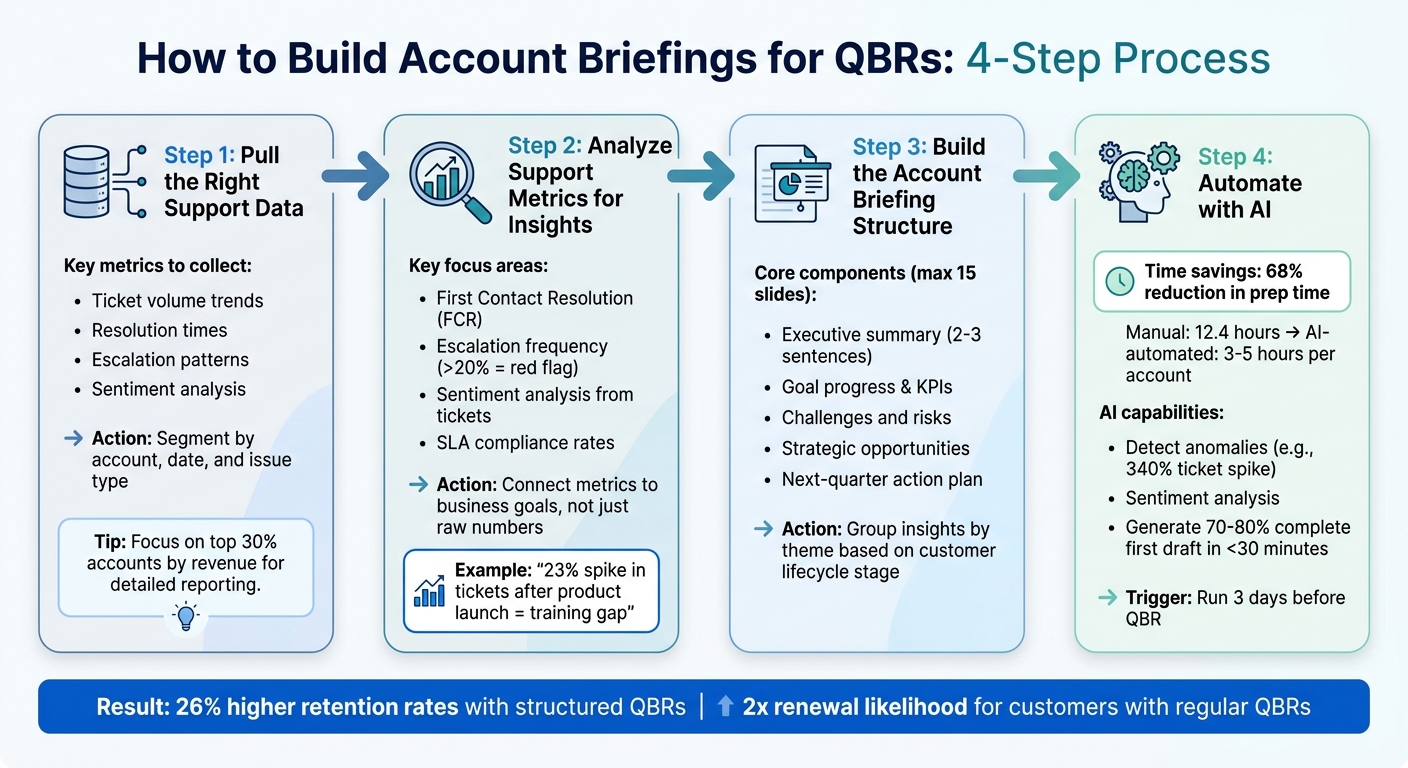
4-Step Process to Build QBR Account Briefings from Support Data
How to Build a QBR Deck Step-by-Step (Customer Success Tutorial with Sample Data)
sbb-itb-e60d259
Step 1: Pull the Right Support Data
Start with data that’s both accurate and relevant. Focus on metrics that paint a clear picture of the customer’s support experience. Key indicators include ticket volume trends, average and per-ticket resolution times, escalation patterns, and sentiment analysis [5][2]. These metrics can help you determine whether an account is stable, growing, or facing challenges. Organize the data to highlight actionable insights.
Avoid overwhelming yourself with raw data. Instead, segment it by account, date, and issue category. For example, compare issues like "API integration" against "onboarding" to see whether problems are isolated to a specific account or reflect broader product concerns [3]. This organization allows you to uncover patterns, such as a spike in ticket volume after a feature release or gaps during the onboarding phase.
For top-tier accounts – typically the top 30% by revenue or strategic importance – dig deeper into the data and provide detailed reporting. For other accounts, stick to lighter reporting to save time while still addressing key points [3]. This approach ensures your preparation aligns with the priorities of your Quarterly Business Review (QBR).
To streamline the process, integrate your support platform with a central data warehouse like Snowflake or BigQuery through APIs. This eliminates the need for manual data exports and ensures all your information is in one place [3]. Tools like Vitally, ChurnZero, or Planhat can also automate the consolidation of support data with CRM and product usage metrics [1].
Don’t stop at quantitative metrics. Use AI to analyze qualitative data, such as ticket text, NPS comments, and call transcripts. This can help you identify recurring themes – like frequent "SSO implementation concerns" – that numbers alone might not reveal [3]. For example, LinearB managed to cut their enterprise QBR prep time from 25 hours per account to just 6 hours in 2023 by automating data collection and reporting [3].
Step 2: Analyze Support Metrics for Insights
Now that you’ve gathered key support data, the next step is to dive into it and uncover insights that can drive meaningful actions.
Identify Action-Driving Metrics
Start by spotting patterns in your data that reveal the state of customer health. One important metric is first contact resolution (FCR), which measures whether your team resolves issues without requiring follow-ups. High FCR rates suggest efficient support and less effort for your customers. Another key metric is escalation frequency. If more than 20% of issues are being escalated, it could point to problems like product friction or unclear documentation. Pay attention to recurring patterns, especially if the same types of issues keep popping up [6].
Sentiment analysis is another powerful tool. It can help you detect problems that raw numbers might miss. By using AI tools to analyze ticket texts, NPS comments, and call transcripts, you can gauge the emotional tone of customer interactions. For instance, if multiple tickets show negative sentiment around "SSO implementation concerns", it’s a clear signal to address this during your QBR.
Categorizing tickets also helps you pinpoint where the real issues lie. For example, a surge in "API integration" tickets might indicate a technical blocker, while a rise in "how-to" questions could suggest the need for better training materials [3]. On top of that, keeping your SLA compliance rates high is crucial – falling short on SLAs can weaken customer trust and jeopardize renewals [6].
Connect Metrics to Business Goals
Support metrics only matter if they’re tied to broader business objectives. Instead of just reporting numbers like "847 support tickets last quarter", provide context. For example, explain how a 23% spike in ticket volume after a product launch exposed gaps in training materials and highlighted the need for better onboarding [4]. This shifts the focus from surface-level stats to actionable insights that can shape your QBR strategy.
Frame metrics in terms of business value. Let’s say you reduced average resolution time by 35%. Calculate what that means in saved hours: "We saved your team 4.5 hours per week, freeing them up to focus on strategic projects instead of troubleshooting" [4]. Tie these trends to your customer’s goals – if they’re entering new markets, show how faster resolution of integration issues supports their expansion plans.
| Metric Type | Example | QBR Value |
|---|---|---|
| Vanity Metric | "You logged 847 support tickets last quarter." | Low; reports volume without context. |
| Actionable Insight | "Ticket volume rose 23% due to a product launch without adequate training." | High; identifies a specific need for a training session. |
| Vanity Metric | "80% of your team uses the reporting dashboard." | Low; shows usage but not value. |
| Business Impact | "Reporting time decreased from 5 hours to 30 minutes per week, saving 4.5 hours per person." | High; demonstrates clear ROI and efficiency gains. |
Step 3: Build the Account Briefing Structure
Using the insights from your support metrics, it’s time to structure your account briefing in a way that ensures clarity and impact during QBRs. A thoughtful and organized briefing transforms raw data into a strategic narrative.
Include the Core Components
Your briefing should be designed for quick consumption by executives. Start with an executive summary – just two or three sentences summarizing the account’s current status, key changes since the last quarter, and your primary recommendation [4][3]. This concise overview gives stakeholders the essential takeaways right away.
Next, focus on goal progress and KPIs. Highlight performance against agreed-upon metrics, prioritizing business outcomes like time savings or efficiency improvements instead of just usage stats [4]. For instance, instead of saying "80% feature adoption", provide a more tangible result: "Reporting time decreased from 5 hours to 30 minutes per week, saving 4.5 hours per person" [4]. Include an ROI section that quantifies the value delivered, such as cost reductions, revenue impacts, or recovered hours.
Address any friction points in a challenges and risks section. Include data on escalation frequency, trends in customer sentiment from support tickets, and recurring technical issues [7][4]. Balance this by highlighting strategic opportunities, like unused features, new use cases, or growth possibilities identified through support interactions [4]. Wrap up with a next-quarter action plan, assigning specific owners and deadlines to ensure accountability [4][3].
"The best QBRs aren’t slide decks you present at people. They’re working sessions that demonstrate your deep understanding of the customer’s business and show how you’re helping them win." – Mikko Mäntylä, Co-founder & CEO, Realm [4]
To keep the discussion focused, aim for a final deck of no more than 15 slides [4].
Group Insights by Theme
Organize your support data into themes to create a clear and compelling narrative. Instead of listing every ticket type, group insights by categories that reflect business impact, such as onboarding challenges, escalation trends, or feature adoption gaps [3].
Tailor your briefing based on the account’s stage in the customer lifecycle. For accounts in their first 90 days, focus on implementation hurdles and early adoption metrics. For mid-contract accounts, emphasize feature optimization and potential expansion opportunities. If the account is approaching renewal, center the briefing around ROI and measurable business outcomes. This ensures you address the priorities that matter most for each stage [4].
AI tools can help you tag and organize qualitative data for a seamless narrative. For example, if you notice a 340% spike in support tickets, connect the anomaly to a specific event, such as a product release or an API issue [3]. This approach turns scattered data into a story that explains what happened, why it matters, and what actions to take.
| Briefing Component | Focus Area | Supporting Data |
|---|---|---|
| Executive Summary | Strategic Headline | Sentiment trajectory, major wins, and critical risks [7][4] |
| Goal Progress | Business Outcomes | Resolution time improvements, SLA performance, and milestone completion [4][8] |
| Challenges/Risks | Friction Points | Escalation frequency, recurring technical blockers, and "Escalation Intent" language [7][3] |
| Opportunities | Growth & Expansion | Feature adoption gaps and new use cases identified from support queries [4] |
| Action Plan | Accountability | Owners and dates for resolving open support issues or training needs [4] |
Step 4: Automate with AI
On average, preparing for a QBR manually takes about 12.4 hours per account, with a significant 60% of that time spent on data collection. By integrating AI, you can slash prep time by 68%, bringing it down to just 3–5 hours per account [3][9]. The key is to weave AI into structured workflows that simplify and streamline the entire QBR preparation process.
Use AI for Summaries and Insights
AI can transform raw data into actionable insights by detecting anomalies, categorizing ticket themes, and generating structured summaries [3][1]. For example, AI can highlight patterns like a 340% spike in ticket volume linked to a specific product release – something that might otherwise be overlooked [3]. Sentiment analysis powered by AI can identify shifts in tone within customer communications, flagging potential risks like churn or opportunities for expansion by detecting frustration, hesitation, or confidence [1].
Large language models (LLMs) take this a step further by categorizing support interactions based on use cases, feature requests, or pain points. They can even provide supporting quotes and business justifications, delivering a 70–80% complete first draft in under 30 minutes [3][10]. This makes it easier to fill the "Challenges and Risks" section of your QBR briefing using actual customer language instead of paraphrased summaries.
"The actual strategic thinking – the part that retains customers and expands revenue – gets maybe 20% of your time. The other 80% is manual data assembly that a well-configured AI agent could handle in minutes." – ShopClawMart [3]
Set Up AI Workflows for QBR Prep
Once you’ve automated data analysis, the next step is to establish workflows that ensure briefings are prepared accurately and on time. Companies like Clay and LinearB have shown how AI-driven workflows can drastically reduce QBR prep time. In February 2026, Clay implemented an automated pipeline that integrates usage, CRM, and conversation data, cutting QBR prep time from 6 hours to just 10 minutes [10]. Similarly, LinearB reduced enterprise QBR prep from 25 hours to 6 hours per account by leveraging internal automation systems [3].
To maximize efficiency, set up triggers to run these workflows automatically – ideally 3 days before a scheduled QBR or when a CRM stage changes to "Renewal Pending" [10][3]. Configure AI tools to include source citations for every data point, such as "[Source: Snowflake query run 04/20/2026]", so you can quickly verify information during your final review [10][3]. By automating the grunt work, your focus shifts to refining the strategy, adding relationship context, and framing the insights in a way that only a human can.
This automated approach transforms support data into actionable insights that not only save time but also enhance customer retention and drive growth.
| QBR Prep Phase | Manual Time (Industry Avg) | AI-Automated Time |
|---|---|---|
| Data Collection | 3–6 hours | Minutes (API-driven) |
| Analysis & Insights | 2–3 hours | Seconds (LLM-driven) |
| Narrative Creation | 2–4 hours | ~10 minutes (Drafting) |
| Slide Formatting | 1–3 hours | Seconds (Template-sync) |
| Total per Account | 8–20+ hours | 3–5 hours (incl. review) |
(Source: Compiled from ShopClawMart and Clay data [3][10])
Conclusion: Make QBR Prep Faster with Support Data
Preparing account briefings for QBRs doesn’t have to consume 12.4 hours per session. By pulling out key data points, tying metrics to business objectives, organizing essential insights, and using AI tools, you can slash that time by 68%, bringing it down to just 3–5 hours per account[3].
Viewing support data as a strategic resource also eliminates the exhausting "human ETL pipeline" role. Instead of Customer Success Managers manually exporting CSVs and cross-checking definitions across tools, AI can take over tasks like gathering data, spotting anomalies, and summarizing qualitative insights[3]. This frees you up to focus on what truly matters – strategic conversations that help retain customers and uncover new revenue opportunities.
"The actual value of a QBR is the strategic conversation: aligning on goals, identifying expansion opportunities, addressing concerns before they become churn risks. When you spend 80% of prep time on data assembly and slide formatting, the strategic layer is thin." – ShopClawMart[3]
Streamlining the process doesn’t just save time – it amplifies the strategic impact of QBRs. Companies that hold well-structured QBRs see 26% higher retention rates compared to those relying on informal check-ins[11]. Plus, customers who participate in regular QBRs are twice as likely to renew their contracts[12]. This makes it clear: investing in a solid briefing process directly contributes to revenue retention.
To make this shift, automate the collection of your top three data sources – usually CRM, product analytics, and support platforms. This lets you move from being a data gatherer to a strategic advisor, adding context and shaping insights that lead to more meaningful QBR discussions.
FAQs
Which support metrics should I include in a QBR account briefing?
When preparing for a QBR (Quarterly Business Review) account briefing, certain support metrics can provide a clear picture of both team performance and customer satisfaction. Here are the key ones to focus on:
- First Response Times: This measures how quickly the support team acknowledges customer inquiries. Faster responses often lead to better customer experiences.
- Resolution Times: Tracks how long it takes to fully resolve issues. Shorter resolution times reflect efficiency and effective problem-solving.
- Ticket Volume: Understanding the number of tickets can shed light on customer needs and potential pain points.
- Escalation Patterns: These reveal how often and why issues are escalated, helping identify areas where processes might need improvement.
- Customer Sentiment Analysis: By analyzing feedback and sentiment, you can gauge overall satisfaction and pinpoint specific areas for enhancement.
Together, these metrics provide a solid foundation for meaningful discussions during your QBR, helping align support strategies with customer expectations and business goals.
How do I translate ticket trends into business impact and ROI?
To tie ticket trends directly to business outcomes, focus on analyzing critical metrics such as ticket volume, resolution times, escalation patterns, and customer sentiment. By identifying recurring issues, you can showcase how addressing these problems leads to measurable improvements in CSAT (Customer Satisfaction Score), NPS (Net Promoter Score), and customer retention.
AI tools can play a pivotal role here. Use them to summarize complex data for Quarterly Business Reviews (QBRs), making it easier to highlight cost savings and efficiency improvements. This approach not only demonstrates the value of your support efforts but also shows how better performance in customer support contributes to revenue growth and aligns with broader strategic goals.
How can AI automate QBR briefings without risking inaccurate insights?
AI simplifies QBR briefings by breaking down complex datasets and highlighting actionable insights, such as emerging trends or potential risks, with minimal effort. However, to ensure accuracy, it’s essential to use AI tools equipped with validation features, like human review, to double-check summaries and recommendations. By pairing AI with human expertise, you can ensure the insights are both precise and relevant, minimizing the chances of errors or misinterpretations in the final briefing.