If ticket counts match after a migration, that only proves the records moved. It does not prove your support team can still meet SLAs, route cases the right way, or keep customer history intact.
When I validate a migration, I look at three layers:
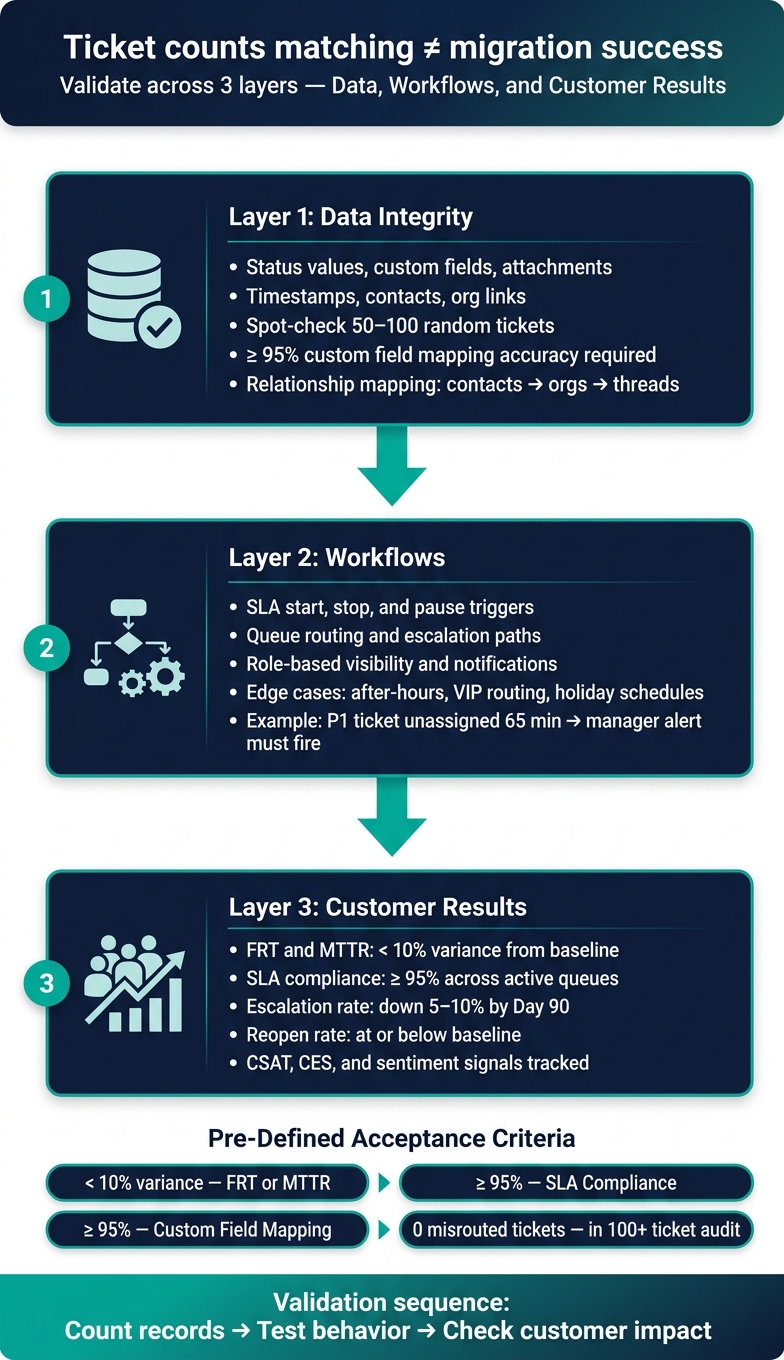
- Data: Are status values, custom fields, attachments, timestamps, contacts, and org links still correct?
- Workflows: Do SLAs, routing rules, escalations, notifications, and automations still fire the way they should?
- Customer results: Did FRT, MTTR, reopen rate, escalation rate, CSAT, and CES stay in line after go-live?
I also set clear pass/fail targets before cutover. For example:
- < 10% variance in FRT or MTTR
- ≥ 95% SLA compliance
- ≥ 95% custom field mapping accuracy
- No misrouted tickets in a live sample of 100+ tickets
That gives me a simple way to tell whether the move worked – or whether hidden issues are sitting in the queue.
A few of the most common problems are easy to miss:
- “Pending Customer” tickets mapped to “Closed”
- SLA timers reset on migrated tickets
- VIP routing breaks because a field changed format
- Attachments show as records, but links fail
- Comments import out of order
- Reports stop matching year-over-year because calculations changed
Here’s the short version: count records, then test behavior, then check customer impact. That’s how I know whether a migration succeeded in practice, not just on paper.
Migration Validation Framework: 3 Layers to Confirm True Success
Set baselines and define acceptance criteria before validation starts
Take a clean pre-migration baseline 1–4 weeks before cutover. That gives you a clear before-and-after view once go-live happens. If you skip this step, post-migration numbers turn into guesswork fast.
These baselines become the reference point for the data, operational, and workflow checks that come next.
Capture baseline service and customer metrics
This baseline is what shows whether the migration changed service quality. Snapshot the metrics that define support performance: FRT, MTTR, SLA compliance by queue and tier, backlog volume and age, escalation rate, reopen rate, FCR, CSAT, CES, and automation success rate. Then use those same metrics again after go-live so you’re making a direct comparison, not comparing apples to oranges.
One step teams often miss: mark the migration date explicitly in every reporting tool. Label the cutover date as 06/27/2026 in every dashboard and report. Without that marker, trend lines get muddy, and leaders start asking the same frustrating question: did the drop begin before the move or after it?
Write measurable post-go-live thresholds
Define success in numbers. Service, data, and customer outcomes all need a clear pass/fail line. A vague target like “performance should stay stable” sounds fine in a meeting, but it falls apart during a post-migration review.
Set hard thresholds instead:
- No more than 10% variance in FRT or MTTR
- At least 95% SLA compliance across active queues
- No meaningful increase in reopen or escalation rates compared with the pre-migration baseline
- For data quality, target at least 95% accuracy in custom field mapping before sign-off [2]
The table below links each acceptance area to a clear threshold and the way to verify it:
| Acceptance Category | Measurable Threshold | Validation Method |
|---|---|---|
| SLA Performance | < 10% variance from baseline FRT/MTTR | KPI scorecards and dashboards |
| Routing Accuracy | No misrouted tickets in a sample audit of 100+ live tickets | Sample audit of 100+ live tickets |
| Backlog Integrity | Ticket counts match by status, priority, and date | Native reporting comparison |
| Data Quality | ≥ 95% accuracy in custom field mapping [2] | Manual field-mapping audit |
| Agent Productivity | Recovery to baseline throughput within 30 days | Weekly productivity reports |
Supportbench dashboards can track these thresholds automatically without pulling in IT for every refresh [5]. During the first week – and throughout the stabilization period – check these metrics daily, not weekly. That way, regressions show up early, while there’s still time to fix them before they snowball.
Use these thresholds to validate the migration across data, operations, and workflows.
sbb-itb-e60d259
Validate the migration across three layers: data, operations, and workflows
Once your thresholds are set, validate the migration in three separate layers: records, workflow behavior, and agent usability. Each one can fail in its own way. A clean import doesn’t guarantee working automations, and working automations don’t mean agents can do their jobs without friction.
Check data integrity and field mapping record by record
Start with a manual audit. Spot-check 50–100 random tickets field by field and compare the source system against the destination. Review subject, description, status, priority, custom fields, notes, and attachments. Then confirm contact, organization, and thread mapping [1][7].
Don’t pull a narrow sample. Mix tickets across customer segments, priorities, and product lines so you’re more likely to catch edge-case mapping errors [1]. The point isn’t to inspect every record. It’s to find the kinds of failures that raw ticket counts won’t show.
Pay close attention to relationship mapping. Make sure tickets connect to the right contacts and organizations, user records kept the right email addresses, phone numbers, and custom data, and conversation threads still appear in the correct chronological order [1]. Attachments are another common trouble spot. Check that screenshots, logs, and documents are still there, open as expected, and weren’t cut off by file-size limits [1][7]. Also verify that open and pending tickets kept the right status and priority so nothing slipped through the cracks [7].
Anything below the 95% mapping threshold counts as a fail [2].
| What Is Being Validated | How to Test It | Sample Size |
|---|---|---|
| Field mapping, timestamps, and attachments | Record-by-record comparison of source vs. destination | 50–100 tickets (randomized) |
| Customer and account relationships | Verify contact-to-org linking and historical ticket associations | 5–10% of account records |
| SLA behavior and routing logic | Trigger test tickets to verify start/stop/pause and queue assignment | All active workflows |
| Automation performance | Test AI-powered ticket routing, triage, and escalation paths | 10–20 edge-case scenarios |
| Agent efficiency | Time to reply, internal note entry, and multi-inbox management | Daily feedback loops (2 weeks) |
After the sample audit passes, move to live workflow tests. Clean records can still route, pause, or escalate the wrong way.
Test SLA behavior, routing logic, and automation performance
Data checks tell you the records made it over safely. Workflow checks tell you whether the system is acting the way it’s supposed to. Those are not the same thing, and teams that blur the two often pay for it later.
Run test tickets through every active workflow. That includes SLA start, stop, and pause triggers, queue assignment by channel, escalation paths, and role-based visibility. Review notification templates too. Make sure branding, formatting, and dynamic fields such as Ticket ID and Customer Name still populate correctly [1].
Then push into edge cases that basic tests tend to miss: after-hours submissions, holiday schedules, urgent escalations, and VIP routing. A Gold-tier ticket should move to the top of the queue. A P1 ticket left unassigned for 65 minutes should trigger a manager alert. If those actions don’t fire exactly as configured, you have a live ops defect, even if the data audit looked clean.
| Workflow | Expected Behavior | Test Scenario | Supportbench Feature |
|---|---|---|---|
| Urgent escalation | High-priority tickets notify a manager after 1 hour of inactivity | Create a P1 ticket and leave it unassigned for 65 minutes | Automated escalation rules |
| After-hours routing | Tickets submitted at 9 PM route to a "Night Shift" queue or trigger an auto-reply | Send an email to the support address outside configured business hours | Business hours and routing logic |
| VIP prioritization | Customers tagged "Gold" are automatically moved to the top of the queue | Submit a ticket from a contact record marked as a "Gold" tier customer | Auto-prioritization and tagging |
| AI triage | AI correctly tags ticket sentiment and product category | Submit a ticket with frustrated language about a specific product | AI-Assisted Triage & Sentiment Analysis |
Even if workflows pass, one more problem can still show up: agents may find the new setup slower or harder to use.
Confirm agents can work efficiently in the new setup
A migration isn’t done just because the system works on paper. If agents need workarounds for normal support tasks, the problem will show up later in reopens, delays, and longer resolution times.
Test usability through actual tasks, not guided screen tours. Have agents receive tickets, merge duplicates, escalate complaints, and manage live chat handoffs in the new setup [6]. This is where bad design choices start to surface. For example, overly complex taxonomies often lead to categorization drift. Agents pick the closest label, and reporting gets worse over time [3].
Agent throughput often drops 20–40% during the first 4–8 weeks after cutover while teams get used to new screens and workflows [2]. Some slowdown is normal. What you want to prevent is a slump that lasts longer or gets worse because of friction you could have fixed early.
Run daily hyper-care check-ins for the first two weeks so agents can report blockers fast. Watch time to reply, internal note entry, keyboard shortcuts, navigation, search syntax, and how easily agents handle multiple inboxes from one view [4]. Supportbench’s Outlook-like email editor and centralized inbox management can help shorten the learning curve. It also helps to give agents a side-by-side old vs. new reference guide, so they can map old habits to the new system without guessing [4].
Measure customer impact after go-live, not just system behavior
Once records, routing, and agent workflows check out, there’s one more test that matters: did customers feel the change? Technical checks show the system was set up the right way. What matters after go-live is whether customer results stayed steady.
Compare before-and-after resolution, escalation, and reopen trends
For the first 30 days, keep the focus on stability. Compare live performance to the pre-migration baseline from day one. If MTTR is still worse by Day 30, treat that as a migration defect, not a rough patch.
Keep a close eye on escalations too. If agents are missing context or case history isn’t showing up right, that’s a migration defect, not normal post-launch noise.
Use the same baseline metrics, but judge them against what’s happening after go-live:
| Metric | Before Migration | After Migration (30/60/90 Days) | Target Threshold |
|---|---|---|---|
| First Response Time (FRT) | Baseline avg | Track daily (Week 1), weekly after | Within 5% of baseline by Day 30 |
| Mean Time to Resolution (MTTR) | Baseline avg | Track weekly | At or below baseline by Day 60 |
| Escalation Rate | Baseline % | Track daily (Weeks 1–2) | Down 5–10% from baseline by Day 90 |
| Reopen Rate | Baseline % | Track monthly | At or below baseline |
| Backlog Aging | Baseline avg days | Track weekly | No increase from pre-migration avg |
Use this table during the first 30 days. After that, shift to monthly trend reviews.
Track CSAT, CES, sentiment, and customer health signals
System stability alone doesn’t tell the whole story. Customers often spot problems before dashboards do. A ticket might close on time and still leave someone annoyed.
Watch survey completion rates along with the scores. If completion drops after migration, that often points to a broken survey trigger, not better satisfaction. When completion rates slip, predicted sentiment and AI-flagged case patterns can help spot at-risk interactions before they turn into bigger issues.
It also helps to roll these signals into customer health scores. That way, accounts that saw SLA misses, long resolution times, or spikes in escalations during the first 30 days are visible before renewal talks start.
Supportbench’s 360-degree customer views bring together case history, sentiment trends, escalations, and health signals in one place, so risk doesn’t stay buried in a spreadsheet.
Use these signals to trigger AI QA and defect reviews before issues spread.
Use AI and reporting to catch defects early and confirm success over time
Apply AI to QA samples, routing and automation failure detection
Once your data migration best practices and baseline checks are set, AI can help you go far beyond a small QA sample. The sample audit tells you where to look. Then AI can scan the full migrated dataset and spot defects that manual QA often misses.
AI summaries are especially useful for finding missing case history fast. If a summary comes back without prior context, that’s often a sign the migration pulled in only part of the record. Supportbench’s AI Agent-Copilot can compare migrated cases against source context and knowledge base content to flag gaps. It can also group repeat issues into patterns, such as missing attachments, schema mismatches, wrong SLA assignments, and misrouted cases. That way, the team can fix the root cause instead of chasing one-off failures all day.
Automate post-cutover dashboards, alerts, and governance reviews
After you’ve identified defect patterns, the next step is live monitoring. The goal is simple: catch issues before they spread. Track ticket flow, assignment lag, and automation hit rates hourly for the first 24–72 hours, daily during the 4–6 week hypercare window, then weekly and monthly through the first quarter [2][6].
Use the dashboard controls below to match each validation task to the right signal.
| Supportbench Feature | Validation Use Case | Data Required | Outcome Signal |
|---|---|---|---|
| SLA Management | Catch timer errors and missed escalations | Ticket timestamps and priority fields | Real-time violation alerts and automated escalation |
| Configurable Dashboards | Monitor automation hit rates, routing gaps, live ticket flow, and backlog spikes | Workflow trigger logs, ticket metadata, real-time ticket stream, and status changes | Detection of silent automation failures, routing gaps, or integration failures |
| Sandbox Environments | Test routing logic without live risk | Sample migrated ticket sets | Verification of field-mapping and trigger accuracy |
| Instant Metric Reporting | Benchmark post-migration performance | CSAT, resolution time, and backlog data | Early warning of productivity dips or CX degradation |
Manual reassignment spikes are one of the clearest early signs that routing logic broke during migration. High reopen rates often point to lost historical context or incomplete data migration. Both are easy to turn into automated alerts, so your team doesn’t have to wait for a manager to spot that something feels off.
If your AI is tied to the old platform, migration can leave you with a long prediction cold start. Native AI helps close that gap from day one.
AI turns migration validation into a continuous check on data, workflows, and customer outcomes. Instead of treating validation like a one-time post-cutover audit, you keep watch where it matters most.
FAQs
How long should migration hypercare last?
Migration hypercare should usually run for 2 to 4 weeks. During that stretch, keep the old and new platforms running side by side. That gives your team time to watch for stability issues, spot missing workflows, and prevent service gaps before you shut down the legacy system.
This is also the right window to track key metrics and make sure performance, routing, and AI-driven quality scores stay steady across both systems. Cutting this period short adds risk you don’t need.
What sample size is enough for migration QA?
Don’t use one flat percentage for every queue. Use a risk-based sample size tied to business impact.
- Closed tickets: 5%–10%
- Open or pending cases: 15%–25%
- High-risk, in-flight, and top-tier account tickets: 100%
- Golden test set: 20–100 records
- Multilingual queues: 5–10 tickets per language
What’s the fastest way to catch hidden migration defects?
Run a test migration in a sandbox with a representative sample of real production data. Don’t rely on synthetic data here. It often looks clean on paper but misses the weird edge cases that tend to break things.
Make sure the sample includes high-risk records, such as:
- Long threads
- Large attachments
- Non-standard status values
Then have senior agents work through their day-to-day tasks in the sandbox. That’s usually the fastest way to spot issues like broken routing, slow performance, or macros that fail when people need them most.
Also review the migration error logs closely. Pay special attention to rows that didn’t map correctly or failed to import, since those are often the records that point to bigger data issues.
Related Blog Posts
- How do you migrate from Salesforce Service Cloud to a helpdesk without losing case history?
- How do you validate a Kayako migration (sampling, parity checks, and go-live readiness)?
- How do you migrate away from Jira Service Management without losing ticket history?
- Migration sampling strategy: how many tickets to validate before go-live