To improve your support operations and reduce repetitive issues, run a monthly "top drivers" review using ticket data. This process identifies recurring problems, addresses their root causes, and prevents backlogs. Here’s how:
- Export Ticket Data: Pull key fields (e.g., subject lines, tags, sentiment scores) from your support platform. Use CSVs for small datasets or APIs for larger ones.
- Clean the Data: Standardize tags, fix inconsistencies, and create a central "data dictionary" for consistent analysis.
- Identify Trends: Use AI tools to group similar issues (e.g., "VPN failure" and "network connection issues") and rank them by frequency and impact.
- Analyze Root Causes: Use methods like the "5 Whys" to uncover why issues persist. Segment data by product, customer segment, or team to pinpoint problem areas.
- Prioritize Fixes: Evaluate solutions based on helpdesk ROI and focus on reducing ticket volume, improving customer satisfaction, and streamlining processes.
- Automate with AI: Leverage AI for trend detection, reporting, and task automation to save time and make reviews more efficient.
- Set Clear Ownership: Assign responsibilities, define deadlines, and use tools like project boards to track progress.
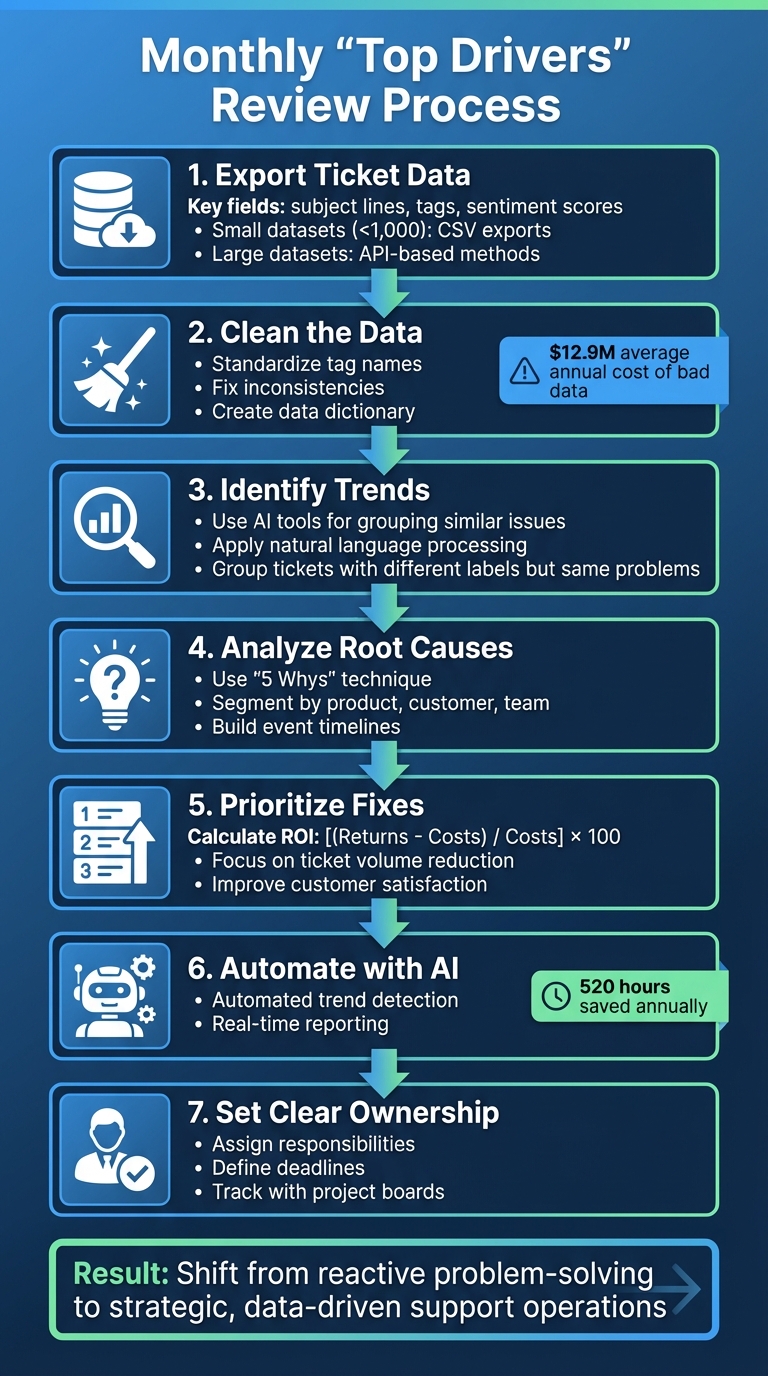
7-Step Monthly Top Drivers Review Process for Support Teams
Preparing Your Ticket Data for Analysis
Gather and Export Relevant Ticket Data
Start by pulling last month’s ticket data from your support platform. Focus on key fields like subject lines, resolution times, tags, customer segments, and sentiment scores. These details can reveal patterns that are easy to miss during manual reviews.
For smaller datasets (under 1,000 tickets), exporting a simple CSV file works well, as most platforms allow direct downloads from their analytics dashboards. If you’re dealing with larger datasets or need recurring exports, consider using API-based methods. These not only handle higher volumes efficiently but also include full ticket metadata, such as comments and attachments that standard exports might skip. For mid-sized datasets (1,000–10,000 tickets), tools like Swifteq’s "Advanced Search Plus" can help with more precise filtering compared to native search options.
"Relying solely on your SaaS provider for data security isn’t enough. Regular ticket exports serve as insurance." – Larry Barker, CX Leader
To streamline the process, set up automated monthly exports in your helpdesk settings. This ensures your data is ready for analysis at the start of each month with zero manual effort. With consistent exports in place, the next step is to clean and prepare your data for accurate analysis.
Clean and Standardize the Data
Raw ticket data often comes with inconsistencies. For instance, technicians might use different tag names, input duplicate records, or format dates inconsistently – all of which can clutter your analysis. Poor-quality data has a significant cost, with companies losing an average of $12.9 million per year due to bad data [2], and about 32% of business data being inaccurate [3].
To address this, standardize tag names by mapping similar terms (e.g., "Social Media", "Facebook", and "social") into a single category. Use spreadsheet formulas to convert dates to the MM/DD/YYYY format and standardize phone numbers. Instead of discarding incomplete records, try cross-referencing other sources or using AI tools to fill in missing details.
"Inconsistent data is a silent killer of efficiency. It creates confusion and delays decisions." – Improvado
Create a "golden record" by developing a central data dictionary. This document should outline the standard formats and acceptable values for every field in your dataset. To simplify analysis, use Pivot Tables in Excel or Google Sheets to group the cleaned data by assignee, tag, or organization. These steps make it much easier to identify key trends and drivers. Once your data is organized and standardized, you’re ready to dive into advanced analytical tools to uncover deeper insights.
sbb-itb-e60d259
Identifying Top Ticket Drivers
Use AI-Powered Trend Analysis Tools
Once your data is cleaned up, the next step is figuring out which issues are creating the most work for your team. This is where AI tools come in handy. By using natural language processing, these tools can group tickets that are labeled differently but describe the same problem (like "VPN failure" and "cannot connect to network" [1]) into clear, actionable patterns. What might seem like unrelated issues suddenly become part of a larger, trackable trend. This process works even better when both ticket subjects and bodies are analyzed through an API [1].
When selecting an AI tool for this task, look for features like confidence scoring. These scores indicate how certain the system is about its categorizations, which can help you rely on the data when making decisions [1]. The ultimate goal? Move away from constantly reacting to individual problems and start identifying recurring issues before they snowball into a backlog of unresolved tickets.
Rank Drivers by Volume and Impact
After grouping similar tickets, the next step is ranking your top issues based on two factors: how often they occur and how much they disrupt your business. Frequency shows you which problems come up the most, while disruption highlights their impact on operations – think downtime or stalled workflows [1].
Take a closer look at how recurring problems affect your team. Are technicians spending too much time re-solving the same issues instead of applying standardized fixes? These repeat problems can quietly rack up significant costs over time [1].
To dig deeper, break down your frequency analysis by categories like service type, customer segment, or specific business units [1]. This helps you zero in on the most critical areas where reducing ticket volume will have the biggest effect. With these insights, you’re ready to investigate the root causes in the next review phase.
Analyzing Root Causes of Top Drivers
Drill Down Using Root Cause Analysis
Once you’ve ranked the top drivers, the next step is figuring out why these issues persist. High-level metrics can sometimes mask deeper problems. For example, an average resolution time might look solid, but if customers are frequently escalating their issues, there’s clearly something amiss. To dig deeper, start by segmenting your data – break it down by issue type, channel, or queue. This helps you pinpoint exactly where delays or problems are cropping up.
A great method to get to the bottom of things is the "5 Whys" technique. It’s as simple as it sounds: keep asking "why" until you uncover the root cause [6][7]. Here’s an example: if password reset tickets suddenly spike, you might find that a recent policy change requiring more complex credentials – without offering a self-service reset option – has created the issue. In B2B support, account-based analysis is another powerful tool. By considering factors like annual recurring revenue, contract status, or the seniority of the contact, you can ensure your high-value accounts get the attention they need [5].
Don’t forget to check your data for accuracy. Technical glitches can sometimes create false spikes [6]. Once you confirm the problem is real, build a timeline of events – track code deployments, alert triggers, and any interventions. This timeline helps identify the triggers contributing to the issue. AI tools can also lend a hand by analyzing unstructured ticket data. These tools can spot patterns that manual categorization might miss, even detecting emerging problems at very low mention rates (as little as 0.5%) before they spiral out of control [4].
These steps will naturally guide you toward segmenting the issues across different areas of your business.
Segment Drivers by Business Unit or Product Line
Breaking down drivers by business unit, product line, or customer segment can uncover trends that might otherwise stay hidden. For example, if a particular customer segment is consistently submitting more tickets, it might point to a product limitation, unclear policies, or the absence of a self-service option – issues that require a proactive fix.
You can also segment resolution times by issue type to identify specific bottlenecks. Maybe approvals are taking too long, ownership is unclear, or workflows are broken. These friction points often become obvious when you compare how long it takes to resolve different types of issues. Similarly, workload reports segmented by team or unit can reveal uneven pressures, helping you redistribute tasks and avoid burnout. Tracking repeat contacts by segment is another way to identify recurring problems tied to specific customer groups or product lines.
Prioritizing and Implementing Improvements
Evaluate Improvement Options
Once you’ve pinpointed the root causes of your challenges, the next step is to prioritize solutions that address the most pressing issues. Not every fix has the same impact – some provide quick relief, like reducing ticket volume, while others require deeper coordination across teams to tackle systemic problems. To decide where to focus, calculate ROI using this formula: [(Returns – Costs) / Costs] x 100 [9]. In this context, "returns" include things like customer retention, reduced churn, and upsell opportunities, while "costs" factor in agent salaries, software expenses, training, and overhead [8][9].
Start by establishing benchmarks for metrics like Average Handle Time (AHT), First Contact Resolution (FCR), and CSAT [9]. For instance, automating repetitive tasks with AI tools can significantly cut costs per ticket. A great example comes from Love Your Melon, which, in 2023, automated 25% of its ticket volume. This change slashed their average first-response time from a sluggish 10 minutes to something much more manageable [14].
"The level of automation provided by Gorgias, like the Rules that can auto-close tickets, has been proven successful. Love Your Melon team has increased their productivity and efficiency thanks to Gorgias" [14]. – Berni De Kolar, Customer Service Director at Love Your Melon
When weighing your options, consider the trade-offs. Here’s a quick breakdown:
| Improvement Option | Pros | Cons |
|---|---|---|
| AI & Automation | Reduces agent workload, handles repetitive tasks 24/7, lowers costs [8][9]. | Requires upfront investment in tools and training data [8]. |
| Self-Service (Knowledge Base) | Instant resolutions for users, high deflection potential [8][9]. | Needs regular updates to keep articles accurate [8]. |
| Agent Training/Coaching | Improves resolution quality for complex issues, boosts team morale [10]. | Labor-intensive; takes agents away from the queue during sessions [8]. |
| Process Optimization | Removes bottlenecks, improves SLA compliance without extra tools [9][10]. | May require buy-in from other departments and careful change management [8]. |
Focus on solutions that impact Customer Lifetime Value (CLV) and retention, as these directly improve the "returns" in your ROI calculation [9]. It’s worth noting that 90% of shoppers rate customer service as a key factor in choosing to do business with a company, and the cost of acquiring new customers has jumped by 60% in recent years [9].
"Customer service is often viewed as a cost center, but measuring ROI proves it drives revenue" [9]. – Elise Kubicki, VP of Success & Support at Gorgias
Once you’ve evaluated your options, it’s time to assign responsibilities and set clear timelines.
Assign Ownership and Set Timelines
After selecting your improvement strategies, the next step is assigning ownership and defining realistic deadlines. Every task needs a clearly designated owner [12]. This person doesn’t have to carry out all the work themselves but is responsible for ensuring the task gets done.
"On project teams, it is essential that every deliverable, every task, is assigned an owner who’s responsible for completing it. This doesn’t mean that the owner is charged with doing all the work, but the task owner is who the project leader holds accountable for delivery" [12]. – Bryan Berthot, Project Manager and Scrum Master
Choose owners based on their expertise and familiarity with the process in question [11]. Before assigning tasks, check their current workload to ensure they have the capacity to take on additional responsibilities [12]. For more complex initiatives, bring in representatives from support, product, engineering, and revenue teams. This ensures the owner has the context and support they need to succeed [13]. Break larger projects into smaller, manageable steps, and agree on deadlines that are both clear and achievable [12].
Setting timelines upfront is essential for keeping things on track. Visual tools, like timelines or project boards, are more effective for tracking progress than simple date lists [12]. To maintain momentum, schedule weekly 45-minute check-ins with cross-functional teams. Use these sessions to review progress, address challenges, and plan next steps [13]. Keep a decision log to document each improvement, noting the date, owner, next action, and any supporting evidence [13].
Most importantly, don’t fall into the trap of "assign and forget." Project managers should follow up as deadlines approach to identify and address any blockers or issues.
"It’s not enough for a project manager to assign task ownership and forget about it. Once the task ownership and a baseline due date are established, the project manager must follow up" [12]. – Bryan Berthot, Project Manager and Scrum Master
Deep data insights & predictive models for service desk ticket data
Automating the Monthly Review Process with AI
Now that you’ve set the stage with data analysis and strategic planning, it’s time to take advantage of automation to simplify your monthly review process.
Use AI for Automated Trend Detection and Reporting
Manually conducting monthly reviews can be tedious and prone to errors. AI-powered systems take the hassle out of this process by quickly identifying recurring issues, product updates, or ongoing bugs – no need for analysts to sift through endless cases [18]. Instead of building reports manually, support leaders can now ask conversational questions like, "Why did refunds spike this month?" and get immediate, detailed answers from ticket data [15].
Modern AI tools go further than just categorizing data. They calculate week-over-week and month-over-month changes, spot spikes in volume, and tie trends to specific events [16]. When a trend is detected, the AI doesn’t just show the numbers – it explains the "why" by pulling relevant AI-driven summaries and customer quotes, complete with visual breakdowns [16]. This level of automation can save up to 520 hours of analyst work annually [16], freeing up your team to focus on solving problems rather than compiling data.
Take Everlane as an example: their AI tools managed 10% of chats on the very first day, improving over time as the system learned [15]. Similarly, Baleària, a maritime transport company, achieved a 96% customer satisfaction score by using an AI chatbot to handle routine inquiries, reducing the need for manual ticketing [19]. These examples highlight how AI not only identifies trends but also reduces the volume of issues requiring manual attention.
"The insights coming in through AI give us the chance to be better customer service agents and provide a better customer experience." – Billy Abrams, Executive Vice President of Distribution, Medline [19]
To make the most of AI, start by creating a clear tagging system. This allows the AI to flag critical topics or high-priority sentiments during each review cycle [17]. With this foundation, your monthly review process becomes more consistent, data-focused, and less reliant on manual effort. This shift aligns perfectly with reducing repetitive tasks and addressing queue debt while maintaining a strategic approach.
Once you’re armed with these automated insights, the next step is to establish ongoing workflows for continuous improvement.
Establish Recurring Workflows for Consistent Progress
After AI begins identifying trends, set up recurring workflows on a regular schedule – whether weekly or monthly – so stakeholders always have fresh insights at the start of each period [20]. The focus should be on analyzing customer messages directly, rather than relying solely on metadata like timestamps or submission methods. This method uncovers user intentions and confusion points that traditional dashboards might overlook [20].
Effective workflows avoid vague categories. Instead of flagging broad issues like "workflow questions", instruct AI to pinpoint specific concerns, such as "confusion about adding delay steps" [20]. Automated reports should include direct links to ticket examples, enabling managers to quickly review the underlying data [20]. Segment reports by urgency or customer tiers (e.g., VIP vs. general) to see how key drivers impact different groups. Include percentage changes week-over-week or month-over-month alongside raw numbers to distinguish between temporary spikes and real performance shifts [20].
For instance, Peek, which uses AI for workforce management, reduced tasks that once took four to five hours to just five minutes with automated forecasting and scheduling [19]. Similarly, James Villas implemented AI-based ticket triage during the COVID-19 pandemic, cutting reply times for urgent requests by 46% and boosting customer satisfaction scores by 11% [17].
Set up alerts to notify managers when ticket drivers exceed thresholds, such as a 30% increase in response time, and automatically create tasks in your project management tools [20]. Use AI not only to identify trends but also to suggest 2-3 actionable improvements for the product team to address recurring issues [20]. This approach ties directly to the prioritization framework discussed earlier, ensuring automation supports your broader strategic goals. Track metrics like "Tickets Handled by AI" to measure how effectively the system resolves cases without human intervention and where it delivers the most value [21].
Before fully automating the process, run one manual cycle of the AI reporting workflow to verify its integration and data quality [20]. This ensures your monthly reviews are reliable and accurate from the start.
Conclusion
A well-structured monthly review transforms ticket data into a clear plan of action, helping to lower support volume while improving customer satisfaction metrics like CSAT. By regularly collecting accurate data, spotting impactful trends, investigating root causes, and setting priorities for improvement, support teams can shift from reactive problem-solving to a more strategic approach. This means addressing the root issues behind recurring tickets instead of just managing the symptoms.
AI-powered tools make this process even more efficient. Features like automated trend detection, sentiment analysis, and natural language search allow support leaders to ask specific questions – like, "What caused the spike in billing inquiries this month?" – and get quick, actionable answers [15]. AI also automates tasks like ticket categorization and tagging, ensuring that monthly reviews are based on consistent, reliable data rather than manual guesswork [15][22]. These tools enhance the data-driven strategies discussed earlier.
Consistency is key to achieving lasting results. Regular reviews create a feedback loop that cuts through the noise, allowing decisions to be guided by objective insights [23]. This reduces guesswork and helps teams focus on sustainable improvements [23]. Over time, this approach not only speeds up resolution times but also fosters a culture of continuous learning and improvement, where every ticket contributes to better outcomes.
FAQs
What’s the minimum ticket data I need for a useful top drivers review?
To conduct a meaningful review of top drivers, you’ll need at least six months of ticket history. This timeframe allows you to spot trends and recurring issues effectively. Make sure you have access to essential details, such as issue descriptions, timestamps, and categorization or tags. These elements help group similar problems for easier analysis.
Leveraging AI tools can take this process to the next level. They can analyze the data to uncover patterns and highlight areas for improvement. This not only helps in prioritizing fixes but also reduces ticket volume, ultimately boosting the efficiency of your support team.
How do I validate AI trend groupings so I don’t chase false patterns?
To ensure AI-identified trends are accurate and not misleading, it’s important to cross-check them with manual reviews or other reliable data sources. Regularly assess grouped tickets to verify consistency over time and monitor key metrics, such as ticket volume trends and resolution success rates. This approach helps distinguish genuine issues from anomalies, enabling more precise root cause analysis and meaningful improvements in support processes.
How do I turn top drivers into fixes that actually reduce ticket volume?
Reducing ticket volume starts with pinpointing the main drivers behind customer inquiries. By leveraging AI-powered ticket analysis, you can identify recurring issues that generate the most support requests. Once you have a clear picture, tackle the root causes with targeted solutions. This might mean creating better documentation, rolling out product updates, or refining internal processes.
Make sure to document these fixes in a centralized knowledge base so your team and customers can easily access them. Clear communication is key – keep your team informed and share updates with customers to ensure everyone is on the same page. Use metrics like ticket deflection rates to measure the impact of your efforts and see what’s working.
Finally, treat this as an ongoing process. Regularly review your data and refine your strategies to keep improving over time.
Related Blog Posts
- How do you run a weekly support ops review that drives real improvements?
- How do you identify the top ticket drivers and turn them into a Product backlog?
- How do you reduce “where is my ticket?” follow-ups with proactive updates?
- How do you map Pylon tags, owners, and workflows to a more structured helpdesk?