


Support teams often focus on speed metrics like response time or ticket volume. But these metrics alone don’t show how support drives business growth. Shifting to outcome-driven OKRs can transform support into a growth engine by focusing on retention, revenue, and customer satisfaction. For example:
- Retention Impact: Reduce churn by engaging at-risk accounts and tracking saved revenue.
- Revenue Growth: Train agents to identify upsell opportunities, boosting support-influenced sales.
- Efficiency Gains: Implement automation to lower costs and improve resolution rates.
This approach aligns support goals with company priorities, measuring outcomes like reduced churn, increased renewals, and improved efficiency. By focusing on measurable results, support teams can directly contribute to growth and customer lifetime value.
Driving Customer-Centric Growth with OKRs
sbb-itb-e60d259
How to Connect Support OKRs to Company Growth Goals
Company Goals to Support OKRs Alignment Framework
What Growth Means for B2B Support Teams
In the world of B2B support, teams play a crucial role in safeguarding revenue by reducing churn, speeding up onboarding, and identifying upsell opportunities. Operating in silos can lead to scattered responsibilities, but aligning support efforts with broader company growth goals turns these teams into a powerful engine for increasing lifetime value (LTV), boosting repeat purchases, and driving expansion revenue.
Support teams are often the first to gather and relay customer feedback to product and marketing teams, creating opportunities for cross-functional growth. The key to transforming support from a perceived cost center into a growth driver is understanding what it can directly influence – such as minimizing churn, ensuring smooth onboarding, identifying upsell potential, and improving operational efficiency to scale the business without ballooning costs.
The next step is translating these growth opportunities into clear, actionable objectives for the support team.
How to Map Company Goals to Support Objectives
Start by identifying your company’s primary quarterly goal – whether it’s increasing revenue, scaling operations, or expanding into new markets – and pinpoint how support can contribute to that growth. For instance, support might focus on reducing churn, driving renewals, or generating expansion revenue.
From there, define 2–3 specific support objectives tailored to these goals. Pair each objective with 3–4 measurable key results that emphasize outcomes rather than tasks. For example, if the overarching company goal is "Revenue Growth", a support objective could be "Improve Customer Retention", with a measurable key result like "Reduce churn rate by 15% through proactive engagement with at-risk accounts".
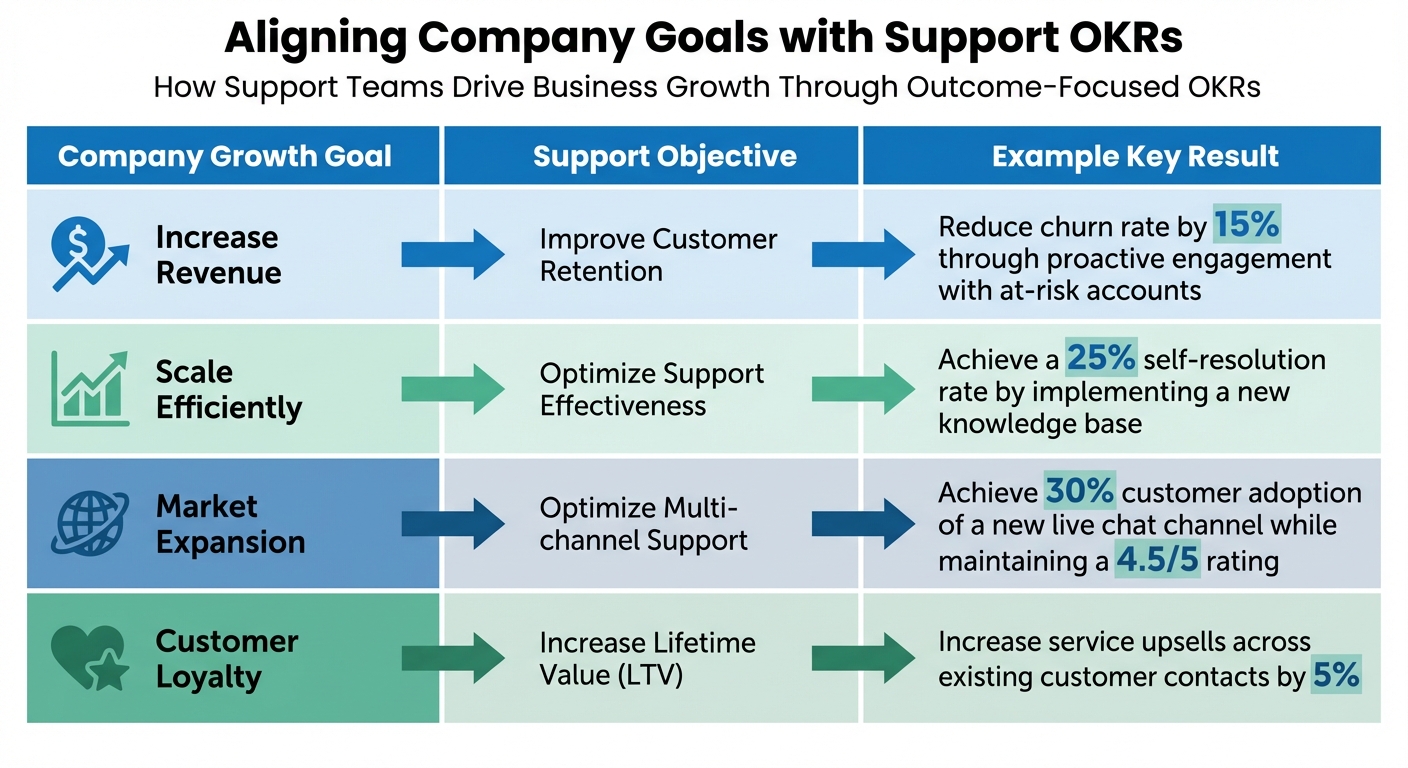
Here’s how this alignment might look:
| Company Growth Goal | Support Objective | Example Key Result |
|---|---|---|
| Increase Revenue | Improve Customer Retention | Reduce churn rate by 15% through proactive engagement with at-risk accounts |
| Scale Efficiently | Optimize Support Effectiveness | Achieve a 25% self-resolution rate by implementing a new knowledge base |
| Market Expansion | Optimize Multi-channel Support | Achieve 30% customer adoption of a new live chat channel while maintaining a 4.5/5 rating |
| Customer Loyalty | Increase Lifetime Value (LTV) | Increase service upsells across existing customer contacts by 5% |
Avoid setting vague objectives like "Be better at support" or "Provide great service." Instead, focus on precise, actionable goals – such as "Improve response times to reduce friction in the renewal process". Keep your objectives manageable by limiting them to 3–4, each with 3–4 key results, so you can stay focused on the metrics that truly impact growth.
Writing Key Results That Measure Outcomes, Not Activities
Let’s get into why focusing on outcomes, rather than just activities, can make a real difference for your business. The key question to ask is: Did the work deliver measurable results? Activity-based metrics, like "implemented a chatbot" or "trained 100% of agents", only confirm that tasks were completed. On the other hand, outcome-focused Key Results (KRs) demonstrate how those tasks created actual business value.
"By focusing on measurable results instead of just activities, support teams directly impact retention, revenue, and customer lifetime value." – Henrik-Jan van der Pol, CEO, Perdoo
When you craft Key Results around outcomes, your support team shifts from being task-focused to becoming a strategic driver of growth. For example, instead of counting tickets, measure revenue saved or upgrades influenced. This approach aligns your team’s work with larger company goals like retention and customer lifetime value. To make these KRs actionable, follow the SMART framework – Specific, Measurable, Achievable, Relevant, and Time-bound. Stick to 3–4 Key Results per Objective to keep your team focused on metrics that matter most.
Here’s how to move from activities to outcomes:
| Metric Category | Activity/Initiative Example | Outcome-Oriented KR Example |
|---|---|---|
| Retention | Create "rescue playbooks" for top churn triggers | Reduce churn for support-interacting customers from 5% to 3% |
| Expansion | Train 100% of agents on identifying expansion signals | Boost qualified leads by 15% |
| Quality | Develop solution templates for top 20 issues | Reduce follow-up tickets for the same issue by 40% |
| Efficiency | Implement a new automated chatbot | Reduce cost per ticket to $1 |
Now, let’s break down some specific KPIs that can illustrate these outcomes.
Protected Revenue: Measuring Retention Impact
Protected revenue highlights the dollar value saved by preventing customer churn, turning your support team into a retention powerhouse. Start by identifying at-risk customers who contact support, then track how many accounts are retained and the resulting reduction in churn. For example, if 100 customers are at risk and 80 stay, that’s $800,000 in protected Annual Recurring Revenue (ARR).
A strong Key Result could be: "Reduce monthly churn for support-interacting customers from 5% to 3%". This metric isolates the impact of your support team on retention, focusing specifically on customers who needed assistance.
To achieve this, create "rescue playbooks" for the top five churn triggers, like billing complaints or decreased product usage. Pair this with a closed-loop process, where customers are informed when their feedback leads to product changes. This not only reduces churn but also builds loyalty by showing customers their input matters.
Upgrades Influenced: Tracking Expansion Revenue
Every customer interaction is an opportunity to uncover expansion potential. Train your agents to recognize expansion signals, such as comments like "we’re growing fast" or "we need more seats". When agents spot these cues, they can tag tickets and pass qualified leads to your account management team.
An actionable Key Result here is: "Increase support-influenced renewals from 10% to 25%". Track how many upgrades or expansions originate from support interactions. You can also measure the attachment rate of complementary products or calculate incremental revenue from cross-sells initiated by support.
By making expansion a routine part of your team’s workflow, agents shift their mindset from simply resolving tickets to actively contributing to revenue growth.
Repeat Contact Reduction: Improving Resolution Quality
Repeat contacts not only frustrate customers but also drain your team’s resources. When customers have to reach out multiple times for the same issue, it’s a sign that the initial resolution wasn’t effective.
One key metric to watch is First Contact Resolution (FCR), which measures whether issues are resolved in a single interaction. High-performing teams aim for an FCR rate of 80% to 85%. Even more precise is repeat contact reduction, which tracks how often customers return with the same problem.
A powerful Key Result could be: "Reduce follow-up tickets for the same issue by 40%". To achieve this, create solution templates for your top 20 recurring issues. These templates provide agents with proven methods for resolving common problems, cutting down on repeat contacts.
This approach boosts customer satisfaction while freeing up your team to focus on revenue-generating activities.
Support Cases per ARR: Scaling Efficiency
As your business grows, your support costs shouldn’t grow at the same pace. The cases per ARR metric helps measure how efficiently you manage support volume relative to your revenue.
To calculate this, divide your total monthly support cases by your Annual Recurring Revenue (in thousands). For instance, if you handle 500 cases per month and have $5 million in ARR, your ratio is 100 cases per $1 million ARR. Over time, this ratio should decrease as you implement automation and refine processes.
Another useful metric is Cost Per Resolution (CPR), which is calculated by dividing your total support costs by the number of resolved inquiries. Both metrics demonstrate how well your support operations scale as the business grows.
A practical Key Result might be: "Reduce cases per $1M ARR from 100 to 75 by implementing AI-powered knowledge-centric solutions". This shows that your team is handling growth efficiently, without ballooning costs or headcount.
How to Build Growth-Focused OKRs: A Step-by-Step Process
Creating outcome-driven Key Results requires a clear process that connects strategic goals to actionable team efforts. Growth-focused OKRs thrive when the entire team is involved in setting them, fostering ownership and engagement from the start. Setting goals in isolation? That’s a missed opportunity to tap into your team’s insights and commitment.
Start by linking your Support objectives directly to the company’s priorities. Keep it simple: focus on two or three key objectives per quarter, each supported by two or three measurable Key Results. Overloading with too many goals can dilute focus and hinder progress.
In your planning sessions, encourage the team to identify the biggest customer pain points and turn those into measurable outcomes. For example, if customers frequently reach out about the same issue, a Key Result could aim to reduce repeat contacts on that topic. This ensures your OKRs are grounded in customer needs, not just internal assumptions.
"When done correctly, goal-setting can help improve employee engagement in a way which elevates performance and benefits organizations overall." – McKinsey
Once the OKRs are finalized, track progress through weekly check-ins. Use a color-coded system to monitor whether objectives are on track, at risk, or falling behind. This visual approach helps the team quickly identify and address challenges, ensuring strategic plans translate into actionable results.
Running OKR Planning Sessions with Your Team
Preparation is key to running a productive planning session. Before meeting with your team, map out how company goals align with Support objectives. For instance, if the company’s focus is on revenue growth, identify where Support can make an impact – whether it’s by improving retention, driving upgrades, or streamlining operations.
During the session, aim for precision. Instead of vague goals, set specific objectives like "Shorten VIP customer response times" or "Lower churn through proactive outreach." Use the SMART framework to ensure goals are clear and measurable.
Collaboration across departments is essential. Share draft OKRs with teams like Sales, Product, and Marketing to ensure alignment. When everyone is on the same page, Support’s contributions become more directly tied to larger business goals. Tools like strategy maps can also help visualize how everyday Support activities – like reducing repeat contacts – connect to broader outcomes like customer satisfaction, retention, and revenue protection.
Using Projects to Drive Key Results
Once objectives are set, focus on executing targeted projects to achieve them. Projects – or initiatives – are the specific actions taken to meet your Key Results. It’s important to distinguish between the two: a Key Result measures the outcome (e.g., reducing live chat response times), while a project outlines the work that makes it happen (e.g., implementing AI-driven ticket routing).
Testing projects on a smaller scale before rolling them out widely is a smart move. For instance, if you’re piloting a new SLA to prioritize VIP customers, route a portion of tickets through the updated system and compare response times to your standard process. Only scale initiatives that deliver measurable improvements.
Take intent-based auto-routing as an example. By using AI to classify tickets based on intent (e.g., billing, bugs, or onboarding) and urgency, you can route them to the right agent or team automatically. Before deploying such a system, analyze past tickets to identify common intents and regularly audit routing accuracy to refine the AI model.
For efficiency-focused goals, projects might include deploying AI-powered chatbots or updating your knowledge base. Track success by measuring metrics like deflection rates or bot containment – how many inquiries are resolved without human intervention. If your goal is to reduce support cases relative to revenue, consider launching FAQ responders powered by AI to address common questions.
When tackling high-stakes issues, set up an internal swarming process. For critical bugs or VIP-related blockers, create macros that automatically assemble a cross-functional team to resolve these issues quickly. This strategy supports outcomes like meeting resolution time targets for critical problems. Regularly tracking confidence levels can also help identify obstacles before they derail progress.
How to Measure Retention and Revenue Impact
Measuring retention and its effect on revenue gets challenging when customers can cancel without interacting with your team. Traditional churn metrics only highlight past problems – they don’t help you anticipate future risks. Instead, focusing on leading indicators provides actionable insights, aligning with an outcome-driven approach to OKRs.
Data shows that companies structuring OKRs around leading indicators see an annual improvement of 8–12 percentage points in Net Revenue Retention (NRR), compared to just 3–5 points for those focusing on lagging metrics. The trick lies in tracking behaviors tied to retention – like time to first value, feature adoption, and engagement frequency. For instance, customers who adopt three or more core features within their first quarter are 40% less likely to churn than those who adopt fewer features. This proactive tracking helps identify early signs of customer disengagement.
Tracking Retention When Customers Cancel In-App
When customers cancel through self-service options, behavioral signals can help predict churn before it happens. Key indicators include customer-led configurations, historical data imports, and third-party integrations. These actions often reflect a higher level of commitment.
For B2B businesses, embedding your product into the customer’s organization plays a critical role. If three or more users within a customer’s organization actively use your product, renewal rates increase by 45%. Similarly, customers who use your product at least twice a week experience 35% better retention compared to those whose usage is limited to a few monthly sessions.
To stay ahead of cancellations, combine product usage data, onboarding milestones, and feedback metrics like NPS or CSAT to create a customer health score. This score can trigger proactive outreach. For example, reduced login frequency or failure to adopt a second core feature within 30 days could flag an account for immediate attention. Reducing the time it takes for customers to achieve meaningful value by 30% can lower churn rates by 15–25% within the first year.
Once you’re tracking these retention signals, the next step is to measure how support impacts revenue.
Calculating Revenue Impact from Support Work
To quantify support’s financial impact, focus on two areas: saved accounts and expansion revenue. Start by identifying at-risk customers who stayed after receiving support. Compare churn rates between customers who interacted with support and those who didn’t to establish a baseline.
Expansion revenue comes from tracking how often customers purchase complementary products or upgrades after interacting with support. Training agents to recognize upgrade opportunities during troubleshooting sessions can directly boost expansion revenue. This reinforces the connection between outcome-focused support and company growth.
You can calculate NRR using the formula:
(Starting ARR + Expansion – Churn) / Starting ARR.
For example, improving NRR from 105% to 110% for a company with $50 million ARR could generate an additional $8 million in revenue over three years. If support-driven renewals or upsells contribute to this improvement, it clearly demonstrates your team’s role in driving financial success.
"Net retention >100% signals healthy expansion-led growth; high gross churn indicates product-market or onboarding problems that will throttle growth." – Mereo
Ready-to-Use OKR Templates for Support Teams
Here are some OKR templates designed to align support team efforts with goals like retention, efficiency, and revenue. Use them as a starting point in your planning sessions, and tweak the numbers to fit your specific needs.
Retention-Focused OKR
Objective: Reduce churn through proactive support efforts
Key Results:
- Lower churn rate for customers interacting with support from 5% to 3% monthly
- Address issues for 90% of accounts showing reduced usage
- Boost customer retention by 10% within six months
Efficiency-Focused OKR
Objective: Improve support team productivity and effectiveness
Key Results:
- Increase tickets resolved per agent from 20 to 25 daily while keeping CSAT above 90%
- Cut average resolution time from 36 to 24 hours
- Resolve 90% of cases within one business day
Revenue Growth OKR
Objective: Drive customer onboarding and revenue expansion
Key Results:
- Train support teams to identify upsell opportunities, leading to a 15% boost in support-influenced sales
- Convert 30% of potential business customer inquiries into closed deals
- Generate $100,000 in additional revenue through support-led cross-sells
Quality-Focused OKR
Objective: Set a new standard for response times
Key Results:
- Reduce average first response time from 8 hours to under 3 hours
- Improve first contact resolution rate from 70% to 85%
- Achieve a CSAT score of 95% or higher
Tips for Implementation
Limit your focus to 2–3 objectives per quarter, with 3–4 key results for each. For each Key Result, outline strategic initiatives – specific actions like "Launch a chatbot" or "Implement dynamic SLAs" – to clarify how you’ll achieve the desired outcomes.
Track your progress weekly using a red/yellow/green confidence score. Follow the "two yellow status" rule: if a Key Result shows "at risk" for two weeks in a row, it should either get back on track or be marked as off track by the third update.
"The #1 role of OKRs is to help you and your team focus on what really matters. Business-as-usual activities will still be happening, but you do not need to track your entire roadmap in the OKRs." – Tability
Lastly, tailor these templates by updating baseline numbers with your current metrics and setting realistic targets based on your company’s growth phase. Every Key Result should ultimately tie back to a customer-focused outcome, such as retention or lifetime value.
Conclusion
Shifting support measurements from task-based metrics to results-focused outcomes is key to driving long-term growth. Instead of simply tallying activities, the emphasis should be on whether those actions contribute to organizational progress and success. This approach ties every support interaction directly to metrics like retention, revenue, and customer lifetime value, positioning support teams as proactive contributors to business growth rather than just reactive problem-solvers.
When support goals align with broader company growth objectives, teams gain clarity and direction while maintaining the freedom to make informed decisions. By prioritizing outcomes such as safeguarding revenue, identifying opportunities for growth, and minimizing repeat issues, support leaders can clearly demonstrate their department’s value in measurable, financial terms.
"OKRs create clear alignment between customer service activities and business outcomes. By focusing on measurable results instead of just activities, support teams directly impact retention, revenue, and customer lifetime value." – Henrik-Jan van der Pol, CEO, Perdoo
This framework encourages ambitious goals, where even partial achievements represent meaningful progress. With regular check-ins and the ability to adapt to changing market conditions, support teams remain agile and focused on what matters most. By limiting quarterly objectives and channeling efforts into achieving measurable, customer-oriented results, support teams can establish themselves as indispensable drivers of business success. Incorporating these outcome-driven OKRs into everyday workflows ensures that support remains a pivotal part of the company’s growth strategy.
FAQs
What are the best ways for support teams to identify upsell opportunities?
Support teams can uncover upsell opportunities by aligning their efforts with revenue-driven objectives. The first step is to establish clear, outcome-focused OKRs. These should target goals like encouraging upgrades, safeguarding revenue, and minimizing repeat customer interactions. Such metrics help identify where additional products or services could meet customer needs.
It’s also important to monitor key indicators, like support cases per ARR or specific customer inquiries that highlight unmet needs. By studying these patterns, support teams can proactively suggest solutions that not only address customer challenges but also contribute to the company’s growth.
What are some examples of impactful Key Results for support teams?
Outcome-oriented Key Results for support teams aim to deliver measurable improvements that tie directly to business goals. Here are a few examples:
- Boosting customer retention rates by solving key issues that cause customers to leave.
- Lowering repeat contact rates, which enhances both operational efficiency and overall customer satisfaction.
- Encouraging upgrades or renewals through proactive and strategic support efforts.
These types of Key Results push support teams to focus on more than just traditional metrics like response times or resolution speeds. Instead, they emphasize driving growth and building stronger customer loyalty.
How can support teams measure their impact on customer retention and revenue?
Support teams can gauge their influence on customer retention and revenue by tracking outcome-focused metrics that connect their efforts to tangible business results. Some essential metrics include customer satisfaction scores (CSAT), Net Promoter Score (NPS), customer health scores, and retention rates. These indicators provide a clear picture of how support impacts customer loyalty and satisfaction.
To dive deeper, teams can monitor expansion revenue – such as upgrades or upsells influenced by support – and repeat contact reduction, which reflects the efficiency and effectiveness of issue resolution. For more nuanced insights, metrics like support cases per revenue unit (e.g., ARR) or examining the relationship between support interactions and churn prevention or renewal rates can be invaluable. These measurements help ensure support efforts align with company objectives and contribute to sustainable growth.