Most support teams rely on QA scoring to evaluate performance, but this method only reviews about 2% of interactions – leaving critical gaps in understanding customer experiences. High QA scores often fail to translate into satisfied customers because they focus on internal processes rather than outcomes like issue resolution or customer loyalty.
Instead of relying solely on QA scoring, here’s what you should track:
- Resolution Time & First Contact Resolution (FCR): Measures how quickly and efficiently issues are resolved.
- Customer Sentiment & Emotional Indicators: Tracks customer emotions during interactions, revealing frustration or satisfaction.
- Escalation Patterns: Identifies recurring issues that require higher-tier support, signaling training or documentation gaps.
- Customer Effort Score (CES): Evaluates how easy it is for customers to resolve issues, a better predictor of loyalty than traditional metrics.
AI tools can analyze 100% of interactions, predict satisfaction scores, and highlight problem areas in real time. This approach eliminates the guesswork of random sampling and helps teams focus on what truly drives customer satisfaction and retention.
Customer Service Quality Metrics That Actually Matter
Why Traditional QA Scoring Falls Short
Traditional QA scoring has been widely adopted, but it struggles to keep up with the demands of today’s fast-paced, complex support environments. For B2B support teams managing intricate customer journeys, these methods often fail to provide the clarity needed to improve outcomes for both customers and teams.
Subjectivity and Limited Sample Sizes
A staggering 82% of support teams rely on random sampling for their conversation reviews. Typically, a QA manager might review just four conversations per agent each week, then use these limited insights to judge performance across hundreds – or even thousands – of interactions. This creates a serious problem in high-volume settings, especially when cases involve multiple specialists or handoffs. Key interactions, like escalations or moments of customer frustration, are often overlooked.
Adding to the challenge is the subjectivity of QA graders. Variations in individual perspectives and biases lead to inconsistent scoring, which can frustrate agents and result in ticket appeals when they disagree with their evaluations. In environments where every customer touchpoint matters, relying on random sampling is like trying to solve a puzzle with most of the pieces missing.
QA Scores Don’t Predict Customer Outcomes
High QA scores don’t always mean happy customers. In fact, 78% of teams define "quality" based on whether agents followed internal processes, not on whether the customer’s issue was resolved. This disconnect often results in situations where QA scores soar above 90%, but customer satisfaction (CSAT) remains stubbornly low. As Berenika Teter from Zendesk puts it:
"If your IQS is high but your CSAT is low, it signals that improvements are needed in other business areas."
The problem lies in the focus of traditional QA scorecards. They prioritize metrics like process adherence (78%) and product knowledge (80%), while the actual customer experience takes a back seat. This misalignment highlights the need for evaluation methods that go beyond internal benchmarks and truly reflect the customer’s perspective.
QA Doesn’t Scale in High-Volume Environments
Manual QA processes become a bottleneck when support teams are managing thousands of tickets across channels like email, chat, phone, and social media. Reviewing just a handful of interactions per agent each week simply doesn’t provide the visibility needed for real-time coaching or meaningful improvements. The challenge is even greater in B2B support, where customer journeys often span multiple touchpoints. Limited sampling fails to capture the full scope of these interactions.
As Intercom aptly notes:
"You can’t improve what you can’t see. And for years, most support organizations have been making decisions based on only a tiny slice of their customer interactions."
This lack of visibility forces support leaders to make strategic decisions without truly understanding their customer interactions. Recognizing these shortcomings sets the stage for exploring AI-driven solutions that can analyze every interaction and provide actionable insights at scale.
What to Track Instead: 4 Metrics That Matter
If traditional QA scoring doesn’t give you the insights you need, what should you focus on? The answer lies in operational metrics – key indicators that directly reflect customer outcomes, team efficiency, and the effort required to resolve issues. These four metrics offer measurable, scalable insights that can complement – or even replace – manual QA reviews. They address the limitations of traditional QA by shifting the focus from internal benchmarks to the actual customer experience.
Resolution Time and First Contact Resolution (FCR)
These metrics highlight how efficiently your team resolves issues. Resolution time tracks how quickly tickets are closed, while First Contact Resolution (FCR) measures the percentage of issues resolved during the first interaction. For most support teams, FCR rates between 70–79% are common, though more complex B2B environments may see lower rates. However, emphasizing speed alone can sometimes backfire.
"If you’re focusing on time to close as your primary support KPI, it could inadvertently encourage your support reps to prioritize the fastest, easiest short-term solve – not necessarily the one with the greatest long-term result for the customer."
AI tools now validate whether closures are genuine first-touch resolutions, ensuring reported FCR metrics reflect reality.
Customer Sentiment and Emotional Indicators
While traditional QA evaluates tone and empathy through manual reviews (used by 84% of teams), this approach only covers a small fraction of interactions. Real-time sentiment analysis changes the game by evaluating 100% of conversations and identifying emotional cues like frustration, gratitude, or anger.
This matters because sentiment analysis reveals customer experiences that traditional QA might miss. For example, a customer may receive a technically correct answer but still feel dissatisfied if they had to repeat their issue multiple times or navigate unclear policies.
"Each conversation using a combination of sentiment, resolution, and support quality signals… capturing the nuance of how customers actually experience support – especially in moments where the outcome was technically correct, but the path to get there involved unnecessary friction."
AI can flag interactions with negative emotions or high customer effort for immediate review, helping managers intervene before customers churn or leave negative feedback. Notably, 58% of support leaders have reported improved CSAT scores after adopting AI-driven sentiment analysis tools.
Escalation Patterns and Frequency
While sentiment focuses on emotional tone, escalation patterns highlight operational challenges. Escalation rate measures how often tickets are passed to higher-tier agents or specialists. A rate below 5% is excellent, while anything above 20% suggests issues with triage, agent training, or documentation.
Tracking these patterns can reveal recurring problems early. For instance, frequent escalations related to a specific feature may point to gaps in documentation or insufficient agent training. In B2B settings, where relationships are more complex, spotting these trends can protect revenue and customer trust.
"A team could close 500 tickets this week, but if customers leave confused, agents burn out, and SLAs get breached without escalation, what did you achieve?"
Customer Effort Score (CES)
Customer Effort Score (CES) measures how easy it is for customers to resolve their issues and is a stronger predictor of loyalty than traditional CSAT. Research shows CES is 1.8x more effective at forecasting customer retention.
The numbers are telling: 94% of customers who experience low effort show increased loyalty, while 96% of those who face high effort become disloyal, with 81% sharing negative feedback. In B2B environments, where renewals and upsells depend on seamless interactions, CES is a critical metric.
CES can be gathered through a quick 7-point scale survey (ranging from "Very Difficult" to "Very Easy") or predicted using AI. By analyzing conversation patterns, AI can identify friction points like repeated explanations, multiple transfers, or hard-to-find information. This allows teams to reduce effort proactively, without waiting for survey responses.
| Metric | What It Measures | Why It Matters | Benchmark |
|---|---|---|---|
| Resolution Time & FCR | Speed and first-touch solve rate | Reflects team efficiency and capacity | FCR: 70–79% |
| Sentiment Analysis | Emotional state during interactions | Captures friction QA scores miss | 58% CSAT improvement with AI |
| Escalation Rate | Frequency of tier-two handoffs | Identifies training gaps and product issues | Below 5% is excellent |
| Customer Effort Score | Difficulty of resolving an issue | Predicts loyalty 1.8x better than CSAT | Varies by sector (4.5–5.5 avg) |
sbb-itb-e60d259
How AI Changes Support Quality Measurement
AI is transforming the way support quality is measured by addressing the limitations of traditional QA methods. By analyzing every customer interaction, AI eliminates the bias that comes with sampling only a small portion of data. This comprehensive approach uncovers patterns that might otherwise go unnoticed, such as recurring issues that frustrate customers or interactions that require excessive effort.
Review 100% of Interactions with AI
Traditional QA methods only review a fraction of support tickets, but AI changes the game by analyzing every single interaction. Modern platforms can evaluate conversations on key aspects like answer quality, customer effort, sentiment, and how well they align with the brand’s values. This thorough analysis helps managers identify coaching opportunities across the entire team, rather than focusing on a limited set of cases.
For instance, AI can highlight interactions where customers needed to repeat themselves or were transferred multiple times – both strong indicators of dissatisfaction. Salesforce saw a 56% decrease in escalation rates after implementing AI-driven quality measurement, demonstrating how early detection of these issues can lead to better outcomes.
Beyond offering full visibility, AI also steps in to predict customer satisfaction outcomes before surveys are even completed.
Predict CSAT, CES, and FCR Before Surveys
One of the biggest challenges for support teams is the low response rate to customer satisfaction surveys – only about 20% of customers typically respond. AI addresses this by predicting how customers would rate their experiences. Using a combination of sentiment analysis, metadata from interactions, and historical trends, AI can estimate metrics like CSAT (Customer Satisfaction Score), CES (Customer Effort Score), and FCR (First Contact Resolution) for every ticket.
"Low predicted CSAT or high predicted CES scores act as early warning signals for potentially at-risk customers. Instead of waiting for a negative survey… you can proactively intervene." – Eric Klimuk, Founder and CTO, Supportbench
This predictive power is especially critical in B2B settings, where losing a single customer can have a significant impact on recurring revenue. For example, if AI predicts a CSAT score of 2 or lower, managers can step in to address the issue before it escalates. Companies using AI for these predictions report an average return of $3.50 for every $1 invested.
Adjust SLAs Based on Case Context
AI doesn’t just analyze past interactions – it also helps refine Service Level Agreements (SLAs) by accounting for the unique context of each case. Unlike static SLAs that apply the same standards to all customers, AI enables dynamic prioritization. By evaluating factors like ticket content, customer value, and account status in real time, AI can tighten response times for high-priority cases. For example, it can prioritize tickets from strategic customers nearing a renewal date or when frustration levels are rising.
AI goes beyond simple keyword-based triggers by understanding the full context of conversations. A single mention of "cancel" might not be as urgent as repeated signs of unresolved frustration. As Matt Blair, SVP of Support at Databricks, explains:
"[AI can] look at the actual content, process it intelligently, and generate alerts and signals to intercept and intervene at the right time."
This dynamic, context-aware approach ensures that support teams focus their efforts where they matter most. This is increasingly important as 90% of customers expect an "immediate" response, with 60% wanting resolution within just 10 minutes.
Putting These Metrics to Work in Your Platform
Traditional QA Scoring vs AI-Driven Support Metrics Comparison
Understanding the key metrics is just the beginning; the real challenge lies in embedding them into your daily operations. Modern AI-powered platforms take the hassle out of manual tracking by automating quality measurement across all interactions. This means support leaders gain complete visibility without additional workload. Once you’ve identified actionable metrics, the next step is integrating them into an efficient, AI-driven support platform.
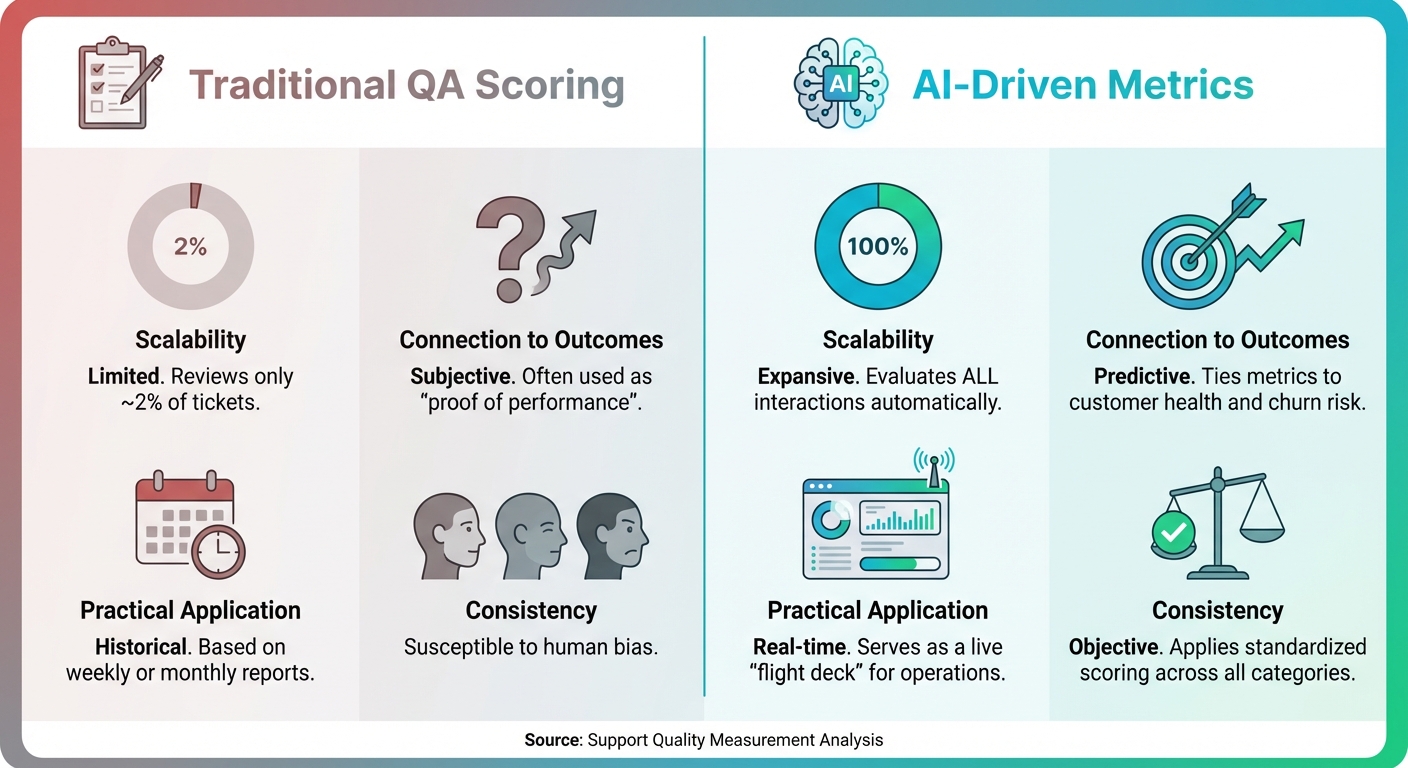
Traditional QA vs. AI-Driven Metrics: A Comparison
Traditional QA scores and AI-driven metrics differ significantly in scope and impact. While traditional methods rely on small, subjective samples, AI provides real-time analysis of every single ticket.
| Dimension | Traditional QA Scoring | AI-Driven Metrics |
|---|---|---|
| Scalability | Limited; typically reviews only ~2% of tickets | Expansive; evaluates all interactions automatically |
| Connection to Outcomes | Subjective; often used as "proof of performance" | Predictive; ties metrics to customer health and churn risk |
| Practical Application | Historical; based on weekly or monthly reports | Real-time; serves as a live "flight deck" for operations |
| Consistency | Susceptible to human bias | Objective; applies standardized scoring across all categories |
This shift from limited sampling to comprehensive analysis eliminates the guesswork in evaluating team performance. Instead of focusing on a small sample, you gain insights into every customer interaction, uncovering patterns that highlight coaching opportunities and operational inefficiencies that might otherwise go unnoticed.
Dashboards and KPI Scorecards for Full Visibility
AI platforms take these metrics and present them in intuitive, real-time dashboards. These dashboards allow leaders to monitor SLA breaches and adjust resources instantly. Tools like Supportbench consolidate data from email, chat, voice, and self-service channels into one interface, avoiding the siloed data issues that arise when using disconnected systems.
"If you’re only tracking how many tickets your team closed last week, you’re flying blind." – Eric Klimuk, Founder and CTO, Supportbench
KPI scorecards offer a clear view of team performance. Managers can identify which agents consistently resolve issues on the first contact, spot escalation trends that reveal knowledge gaps, and pinpoint product areas causing frequent customer frustration. By basing feedback on every interaction – not just a few cherry-picked tickets – coaching becomes more targeted and effective.
High-performing teams often achieve SLA compliance rates between 75% and 100%. Real-time dashboards help maintain this standard by alerting managers to potential risks as they arise.
Automate Workflows with AI
AI-driven platforms also streamline workflows by automating repetitive tasks that often bog down support teams. Automated triage instantly tags tickets with sentiment and intent, routing them to the right agent without manual effort. This ensures that urgent issues from high-value customers are prioritized, while simpler requests can be resolved through self-service or automation.
Supportbench’s AI takes prioritization a step further by factoring in contextual details, like upcoming renewals or signs of customer frustration. This ensures agents focus on high-impact cases first. AI can even draft consistent, on-brand responses based on historical tickets, reducing handle time while maintaining quality.
"The best metrics don’t just track history – they change what happens next." – Eric Klimuk, Founder and CTO, Supportbench
AI can also automate survey distribution. Instead of manually sending CSAT surveys for every ticket, the system can trigger them based on resolution type or predicted satisfaction levels. For teams handling high ticket volumes, this automation can mean the difference between being buried in administrative tasks and actually improving customer outcomes.
Choosing a platform with integrated, flat-rate capabilities ensures scalability without hidden costs.
Conclusion: Better Metrics Lead to Better Outcomes
Traditional QA methods fall short of addressing the full scope of customer support challenges. By sampling just 2% of interactions and relying on subjective evaluations, they fail to uncover the systemic issues that often lead to customer churn. Shifting to outcome-based metrics – such as Customer Effort Score (CES), sentiment analysis, escalation trends, and First Contact Resolution (FCR) – provides a more complete and actionable view of your support operations.
AI-powered platforms take this a step further by analyzing 100% of support interactions in real time. Instead of relying on outdated reports, these systems deliver live insights into customer health, agent performance, and operational inefficiencies. This enables you to intervene before Service Level Agreements (SLAs) are breached, coach agents based on real patterns rather than isolated examples, and address recurring issues in your product or documentation that lead to repeated customer contacts.
The numbers tell a compelling story: 96% of customers who experience high-effort interactions become disloyal, while 94% of those who encounter low-effort interactions show greater loyalty. By focusing on metrics that directly influence retention – like CES and sentiment – you’re not just improving support quality; you’re safeguarding your revenue.
Supportbench simplifies the process of tracking and acting on these advanced metrics. With tools like CES, sentiment analysis, escalation tracking, and FCR integrated into one platform, you gain the visibility and efficiency to make proactive decisions. Predictive features for CSAT, CES, and FCR ensure you can spot and address issues before they escalate into churn. These capabilities encapsulate the journey toward a more proactive, results-driven support strategy.
When you move beyond traditional QA scores and focus on the metrics that matter, support evolves into a key driver of customer retention and business growth. Better metrics don’t just inform – they empower teams to deliver meaningful, lasting improvements.
FAQs
How can AI help measure and improve support quality more effectively?
AI tools are reshaping how support quality is measured, offering insights that go far beyond the limits of traditional metrics. By analyzing every single customer interaction, they reveal areas that need attention – like gaps in training – and identify patterns in critical factors such as empathy, accuracy, and helpfulness. These are often overlooked with standard QA scoring methods.
On top of that, AI brings advanced capabilities like sentiment analysis, which provides a clearer picture of customer satisfaction and emotional engagement. Real-time dashboards make it easy to monitor key metrics like escalation rates, resolution times, and agent performance, allowing teams to address problems as they arise. Predictive analytics takes it a step further by forecasting outcomes such as customer satisfaction scores (CSAT) or customer effort scores (CES). This helps teams make smarter, data-driven decisions to improve the overall customer experience.
Why is Customer Effort Score (CES) more effective than CSAT for predicting customer loyalty?
Customer Effort Score (CES) stands out as a better predictor of customer loyalty because it zeroes in on how easy – or difficult – it is for customers to resolve their issues or complete a task. Studies reveal a clear trend: the less effort customers need to exert, the more likely they are to stick with a company and continue their relationship.
While Customer Satisfaction (CSAT) surveys gauge how happy customers feel immediately after an interaction, CES digs deeper. It pinpoints areas where customers encounter friction, offering a clearer picture of their overall experience. By focusing on reducing effort, businesses not only enhance satisfaction but also build stronger, longer-lasting relationships that encourage repeat business.
What are the drawbacks of relying solely on traditional QA scoring in high-volume customer support?
Traditional QA scoring struggles to keep up in high-volume environments. Why? It usually focuses on a small sample of interactions, which means you’re not getting the full picture of your support quality. Plus, the process can be slow and labor-intensive, making it tough to deliver insights quickly enough to make meaningful changes.
Another downside is its inability to pick up on larger patterns, like recurring problems or shifts in customer sentiment. This limits its usefulness when trying to understand overall performance. To truly raise the bar for support quality, it’s crucial to pair QA scoring with more dynamic metrics like resolution time trends, customer effort scores (CES), and sentiment analysis. These tools can offer more actionable and wide-reaching insights.