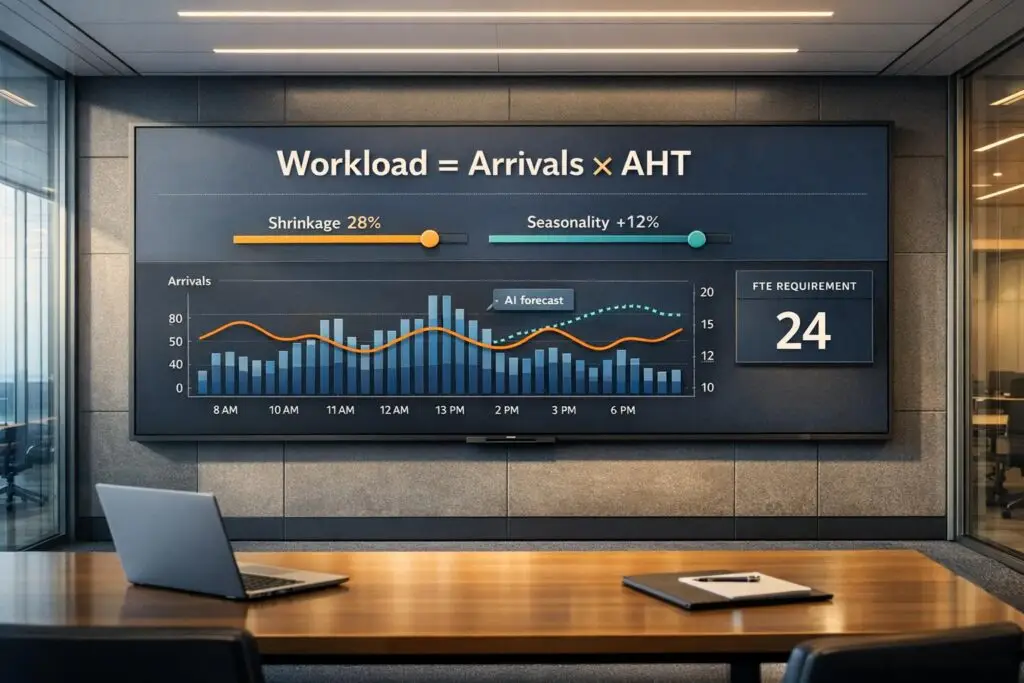
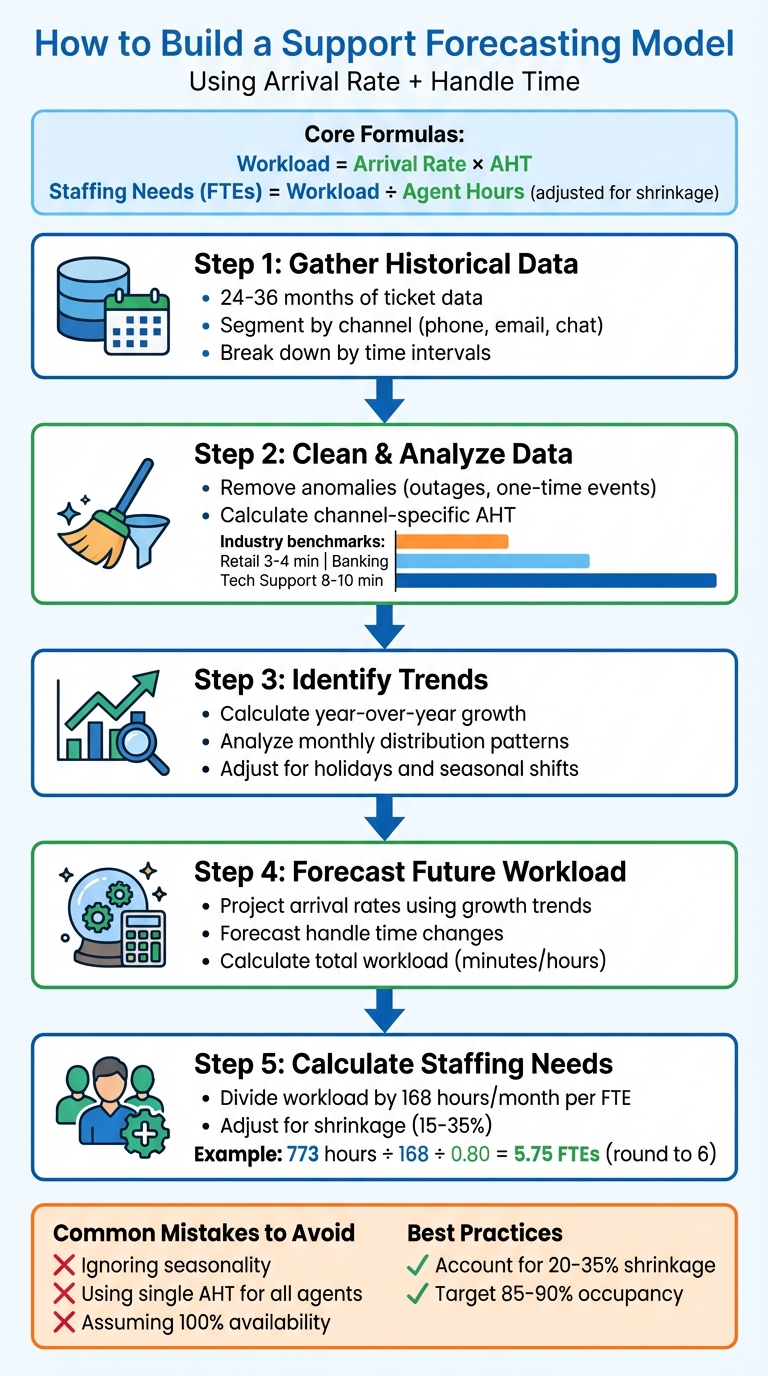
You can forecast staffing needs for support teams by combining two key metrics: arrival rate and average handle time (AHT). Here’s the simple formula:
- Workload = Arrival Rate × AHT
- Staffing Needs (FTEs) = Workload ÷ Agent Hours (adjusted for shrinkage)
For example, if your team handles 100 tickets daily, each taking 30 minutes, the total workload is 50 hours. Divide this by the monthly hours an agent works (e.g., 168 hours) and adjust for shrinkage (e.g., 20%) to determine how many agents you need.
Key Steps:
- Gather Historical Data: Collect 24–36 months of data on ticket volumes and handle times by channel (e.g., phone, email, chat).
- Clean Data: Remove anomalies like outages or one-time events.
- Identify Trends: Analyze growth rates, seasonality, and monthly patterns to forecast future ticket volumes.
- Forecast Metrics: Use historical trends to predict arrival rates and AHT for upcoming periods.
- Calculate Staffing Needs: Combine forecasts to determine workload and required Full-Time Equivalents (FTEs).
Common Mistakes to Avoid:
- Ignoring seasonality or growth trends.
- Using a single AHT for all agents or ticket types.
- Assuming 100% agent availability without accounting for shrinkage (15–35%).
For more precise forecasts, advanced methods like Erlang C or AI-driven tools can account for spikes, queues, and dynamic changes, but simple math works well for most B2B teams starting out.
Support Forecasting Model: 5-Step Process from Data Collection to Staffing Calculation
Step 1: Collect and Analyze Historical Data
Gather Historical Arrival Rate Data
To get started, gather 24 to 36 months of historical ticket data from your support platform. This longer timeframe helps you spot trends and seasonal patterns that shorter periods might overlook. Break down this data by channel – such as voice, chat, email, and social media – to account for variations in customer behavior and arrival patterns. Additionally, segment the data by time intervals: daily for long-term planning and hourly or 15-minute blocks for scheduling on a day-to-day basis.
For written channels like email, focus on tracking total outbound interactions rather than just counting "resolved" tickets. This approach captures the entire back-and-forth process required to resolve an issue. Clean your data by removing anomalies like system outages, one-off marketing campaigns, or feature retirements. These outliers can distort averages and make your projections less reliable.
Once your data is cleaned and segmented, you’re ready to calculate channel-specific Average Handle Times (AHTs).
Calculate Average Handle Time
AHT differs depending on the support channel. For phone support, calculate AHT using this formula:
(Total Talk Time + Total Hold Time + Total Follow-up Work) ÷ Total Number of Calls.
For email, include the time spent on conversations plus any wait times. In live chat, divide the total handle time by the chat volume. As a reference, industry benchmarks suggest AHTs of 3–4 minutes for retail, 4–6 minutes for banking, and 8–10 minutes for technical support.
Make sure to screen for outliers that could skew your averages. Review recordings or notes to confirm if higher-than-average AHTs are due to genuine complexity. Also, cross-check your reporting tools to ensure data consistency and accuracy.
Identify Trends and Patterns
Having clean data allows you to uncover trends that are essential for predicting future workloads. Start by calculating year-over-year growth by comparing the same periods across different years. Then, analyze monthly distribution by dividing each month’s average volume by the total annual volume. This helps pinpoint your busiest months.
Don’t overlook the impact of holidays and seasonal shifts. For holidays with changing dates, like Labor Day or Easter, manually adjust by analyzing ticket volumes in the weeks before, during, and after the holiday. Coordinate with teams like Finance and Sales to account for events that might influence future ticket volumes.
As Charles Watson aptly puts it, “Business Intelligence is any information you can get that explains why the future will be different from the past”.
Step 2: Forecast Future Workload
Forecasting Arrival Rates
To predict next year’s ticket volume, start by multiplying the total from the previous year by the average year-over-year growth rate. For instance, if your growth rates were 4.0% in 2023 and 3.8% in 2024, the average growth rate would be 3.9%. Using this, if you handled 54,000 tickets in 2024, you’d multiply 54,000 by 1.039 to estimate about 56,106 tickets for 2025.
Break this annual forecast into monthly estimates based on historical distribution patterns. For example, if January consistently represents 9.4% of your annual volume, you’d allocate roughly 5,268 tickets to January 2025.
It’s important to adjust these numbers based on input from marketing, sales, and product teams. Planned campaigns, billing updates, or new feature launches can significantly impact ticket volume. For instance, if a product launch in February is expected to increase demand by 5%, adjust February’s forecast accordingly. Document these changes so you can later compare forecasts to actual results.
Consistency is key, so apply similar methods to forecast handle time using historical trends.
Forecasting Handle Time
To predict Average Handle Time (AHT), examine how it has changed in previous years and apply the same growth trend. For example, if email AHT increased from 8.2 minutes to 8.5 minutes (a 3.7% rise), you might project it to reach 8.8 minutes next year.
AHT often fluctuates by month, so consider these variations in your projections. For example, a product launch might temporarily increase AHT, while updated documentation could reduce it. Keep separate calculations for different channels like phone, email, and chat to ensure accuracy.
Calculate Future Workload
Once you have your arrival rate and handle time forecasts, combine them to estimate the total workload. For example, if January’s ticket volume is projected at 5,268 and the AHT is 8.8 minutes, the total workload would be approximately 46,358 minutes – or about 773 hours.
To convert this workload into Full-Time Equivalents (FTEs), divide by the number of hours a single employee works in a month. In the U.S., a full-time employee typically works 40 hours per week or about 168 hours per month. Don’t forget to account for shrinkage – the time agents are unavailable due to breaks, training, or sick days. Shrinkage rates usually range from 15% to 35%.
For example, with 20% shrinkage, divide the total workload by 168 (monthly hours per FTE) and then by 0.80 (to adjust for shrinkage). Using the earlier workload of 773 hours, you’d calculate: 773 ÷ 168 ÷ 0.80 = approximately 5.75. This means you’d need about 6 agents scheduled to handle January’s workload.
Next, refine your model by reviewing common forecasting errors.
Assembled Office Hours: Demystifying Forecasting For Your Support Team
sbb-itb-e60d259
Step 3: Common Mistakes and How to Avoid Them
These frequent forecasting errors highlight why the groundwork laid in Steps 1 and 2 is so important. Missteps here can ripple across your entire operation.
Ignoring Seasonality and Trends
Assuming every month is the same can derail your forecast before you even begin. If your business sees predictable spikes – like during product launches, billing cycles, or the holidays – averages won’t capture these nuances. The result? You could end up short-staffed during busy periods and overstaffed when things slow down.
To avoid this, weed out one-time anomalies from your data. Events like system outages or one-off promotions can skew your numbers by as much as 20% to 40%. If your ticket volume is steadily growing, consider applying a growth ratio. For instance, divide your ticket count by a stable metric, like active users or shipments, and multiply that ratio by your projected growth.
If you have more than a year of data, advanced models like Triple Exponential Smoothing (Holt-Winters) can help. These models factor in level, trend, and seasonality automatically. Beyond that, don’t work in a silo – coordinate with marketing, sales, and product teams to account for upcoming campaigns or feature releases that historical data won’t reflect.
Handle time variations are another key factor to keep in mind.
Overgeneralizing Handle Time
Using a single average handle time (AHT) for everyone on your team oversimplifies reality. Newer agents often take longer to resolve tickets compared to their more experienced colleagues. If you’re planning to hire ahead of a volume spike, make sure to factor in the ramp-up period for new hires to maintain accurate staffing levels.
Also, not all tickets are alike. Complex issues naturally require more time than simpler ones, like password resets or billing inquiries. If you can, break down your AHT by ticket type or channel (phone, email, chat) for more precise workload estimates. For email and other asynchronous channels, it’s better to forecast based on total outbound interactions rather than just resolved tickets.
Beyond these nuances, the methods you use can also limit your forecasting accuracy.
The Limits of Simple Math
Basic math – like multiplying arrival rate by handle time – assumes a steady ticket flow, but that’s rarely the case. Support volume tends to be random and spiky. During peak hours, multiple tickets can arrive at once, creating queues and increasing wait times – something simple math doesn’t account for. This is especially critical for real-time channels like phone or live chat, where nearly two-thirds of customers will abandon a call after waiting just two minutes. More advanced models, like Erlang C, incorporate queuing theory and service-level targets, giving you a clearer picture.
Simple models also falter at scale. A 25% forecasting error might not sound huge, but it can leave you scrambling to cover shifts or lead to unnecessary hires. If you’re finding that spreadsheets aren’t cutting it for complex calculations, it may be time to involve cross-functional teams and explore more advanced forecasting techniques.
| Input Variable | Common Mistake | Recommended Adjustment |
|---|---|---|
| Arrival Rate | Ignoring abandoned calls | Include abandons to capture true demand |
| Handle Time | Using a flat average for all agents | Account for new hire ramp-up time |
| Staffing | Assuming 100% availability | Factor in 15–35% shrinkage |
| Occupancy | Targeting 100% productivity | Aim for 85–90% to prevent burnout |
Next, we’ll dive into how AI can bring dynamic, predictive insights to your forecasting process.
Step 4: Using AI to Improve Forecasting
AI takes forecasting to a whole new level by processing vast amounts of data and adapting in real time. Traditional methods often rely on averages and assumptions, which can lead to inaccuracies. In fact, only 15% of companies achieve forecast accuracy within 5% of actual results using manual methods, while AI-driven forecasts can hit up to 95% accuracy. Over half of B2B sales and support leaders admit they lack confidence in their manual forecasting systems. When staffing decisions hinge on unreliable predictions, you either struggle to cover gaps or end up overstaffed. AI changes this by automating processes and learning continuously from new data, enabling better analysis, trend predictions, and staffing optimization.
Automating Data Analysis
AI simplifies the heavy lifting of data preparation and analysis. Workforce management tools powered by AI connect directly to your CRM, clean up missing or inconsistent data, and process both structured and unstructured information using advanced algorithms like ARIMA and ETS. While traditional methods stick to structured data, AI incorporates unstructured inputs for deeper insights. These algorithms break down historical data into components, uncovering trends and seasonal patterns that basic averages can’t detect. Machine learning ensures the model evolves as customer behavior or market dynamics shift.
AI also excels at detecting anomalies. For example, if a sudden spike in handle time occurs due to a product issue or external event, AI flags it and adjusts future predictions accordingly. This level of precision is impossible to achieve with manual methods.
Predicting Dynamic Workload
AI doesn’t just analyze past trends – it forecasts future demands with incredible precision. For instance, a healthcare facility used AI-based time-series models to optimize staffing, boosting coverage by 30% during peak hours and improving patient-to-staff ratios. Advanced models like TiDE-RIN deliver R-squared accuracy scores of up to 75%, compared to just 16% for traditional ARIMA models.
These systems can incorporate external factors – like weather, economic trends, or even social media activity – alongside internal data to enhance predictions. They also provide detailed forecasts, breaking them down by channel (voice, chat, email), region, or specific customer segments.
"The advent of new technologies for AI and cloud-based computing has reduced the cost of deploying end-to-end, AI-driven solutions for optimizing schedules."
– McKinsey & Company
Modern AI platforms use an MLOps approach to retrain models weekly with fresh data, avoiding "concept drift" – a loss of accuracy over time due to changing conditions. This dynamic adjustment ensures forecasts remain relevant and actionable, forming the backbone of an efficient, AI-driven support system.
Optimizing Staffing with Predictive Insights
AI doesn’t just predict demand – it offers actionable staffing recommendations. Platforms like Supportbench analyze real-time and historical data to suggest precise staffing adjustments, considering factors like occupancy, shrinkage, SLA targets, and average handle time. Instead of guessing, AI uses advanced models like modified Erlang C to calculate exact Full-Time Equivalent (FTE) needs.
One telecommunications provider achieved 80% to 85% forecast accuracy by using AI to create daily forecasts. This allowed them to reassign technicians and resolve issues remotely during a surge in demand, reducing both customer churn and employee burnout. Similarly, a utility service center saw emergency disruptions drop by 75% and job delays cut by 67% with AI-optimized scheduling.
Supportbench’s AI tools go beyond forecasting. They offer features like auto-tagging, priority detection, and predictive First Contact Resolution (FCR) scoring, which directly impact how handle time is managed. AI can also predict when a ticket is likely to close or the probability of resolution, helping managers assign tasks more effectively.
Combining AI with human expertise is key. Use AI as a foundation, but let managers adjust forecasts based on qualitative insights, like an upcoming product launch or marketing campaign. Incorporate business intelligence that historical data can’t account for. Start small – test AI forecasting models on specific regions or support tiers to validate their accuracy before scaling up. This blend of AI-driven insights and human judgment creates a reliable and adaptable forecasting system.
| Feature | Traditional Forecasting (Simple Math) | AI-Powered Forecasting |
|---|---|---|
| Data Handling | Manual spreadsheets and YoY growth averages | Automated API integration and real-time data streams |
| Accuracy | Low (often misses complex patterns) | High (uses TCN, TiDE-RIN, and MLOps) |
| Adaptability | Static; requires manual updates | Dynamic; adjusts for anomalies and concept drift |
| Staffing | Approximate guesses or fixed ratios | Precise optimization using advanced models |
| Bias | Influenced by human judgment | Data-driven, minimizing subjective bias |
Conclusion: Building a Reliable Support Forecasting Model
Creating a dependable support forecasting model boils down to combining precise data, straightforward calculations, and continuous fine-tuning. To get started, gather at least a month’s worth of historical data on arrival rates and handle times – though having two years’ worth is ideal for identifying long-term patterns. Clean up your dataset by excluding anomalies from one-off events like system outages or special marketing pushes. With this foundation in place, you can tackle the variables that directly impact forecast accuracy.
One of the biggest hurdles is accounting for human factors. Since salaries make up about 80% of your support budget, you’ll need to factor in 20–35% shrinkage and aim for 85–90% occupancy. Adjust your forecasts to accommodate major events, such as product launches or seasonal spikes, and plan your hiring timelines to allow for proper ramp-up periods.
AI has revolutionized forecasting by turning it into a dynamic, real-time process. It automates data analysis, flags anomalies, and provides probabilistic forecasts. This leads to a more flexible operation that balances cost control with maintaining high-quality service.
"Accurate workforce forecasting is good for employee morale. According to a recent SWPP survey, forecast accuracy is actually the #1 measure that affects team satisfaction."
– Ryan Wang, Co-founder and CEO, Assembled
FAQs
What is shrinkage, and how does it affect staffing in support forecasting?
Shrinkage happens when agents aren’t available to assist customers. This could be due to breaks, training sessions, meetings, or even absenteeism. It’s a key factor in workforce planning because it directly impacts how many team members are actually available to handle customer inquiries.
If you overlook shrinkage in your forecasting, you risk running into issues like understaffing, longer wait times, and unhappy customers. By including shrinkage in your calculations, you can better estimate how many agents you’ll need to keep up with demand while maintaining strong service levels.
What are the drawbacks of using simple math for support forecasting?
Using just basic math for support forecasting – like focusing solely on arrival rates and handle times – can lead to overly simplistic and unreliable outcomes. This method tends to overlook critical factors such as fluctuating contact volumes, seasonal trends, or sudden spikes in activity. It also assumes that handle times and arrival rates remain constant, which ignores real-world dynamics like agent breaks, training sessions, or varying types of customer inquiries.
On top of that, simple models fail to take advantage of historical data or advanced algorithms that could improve accuracy over time. This can result in major inefficiencies, like being understaffed during busy periods or overstaffed when things are slow. To create a more dependable forecast, it’s smart to include additional variables and consider using AI-powered tools. These tools can analyze patterns and predict future needs with greater precision, helping you stay ahead of demand.
How does AI enhance support forecasting accuracy?
AI takes support forecasting to the next level by analyzing historical data with machine learning to identify patterns and trends that traditional methods often overlook. Instead of just relying on basic metrics like arrival rates and handle times, AI incorporates additional factors such as seasonality, special events, and customer behavior shifts. This approach leads to much more precise predictions.
Another advantage is AI’s ability to continuously learn from new data. This adaptability ensures forecasts stay aligned with ever-changing support demands. AI can also spot anomalies and filter out outliers, keeping predictions accurate and dependable. By handling complex calculations and enabling real-time updates, AI simplifies the forecasting process. The result? Better staffing plans, reduced costs, and smoother customer experiences in today’s fast-paced support environments.