Sentiment tracking in customer support is a game-changer for B2B businesses. It uses AI to analyze customer emotions in real time, helping companies spot dissatisfaction early and take action before issues escalate. Unlike traditional metrics like CSAT, CES, or NPS, which measure past experiences, sentiment analysis focuses on the current mood of customers. This proactive approach can reduce churn, improve satisfaction, and even boost sales opportunities.
Key Takeaways:
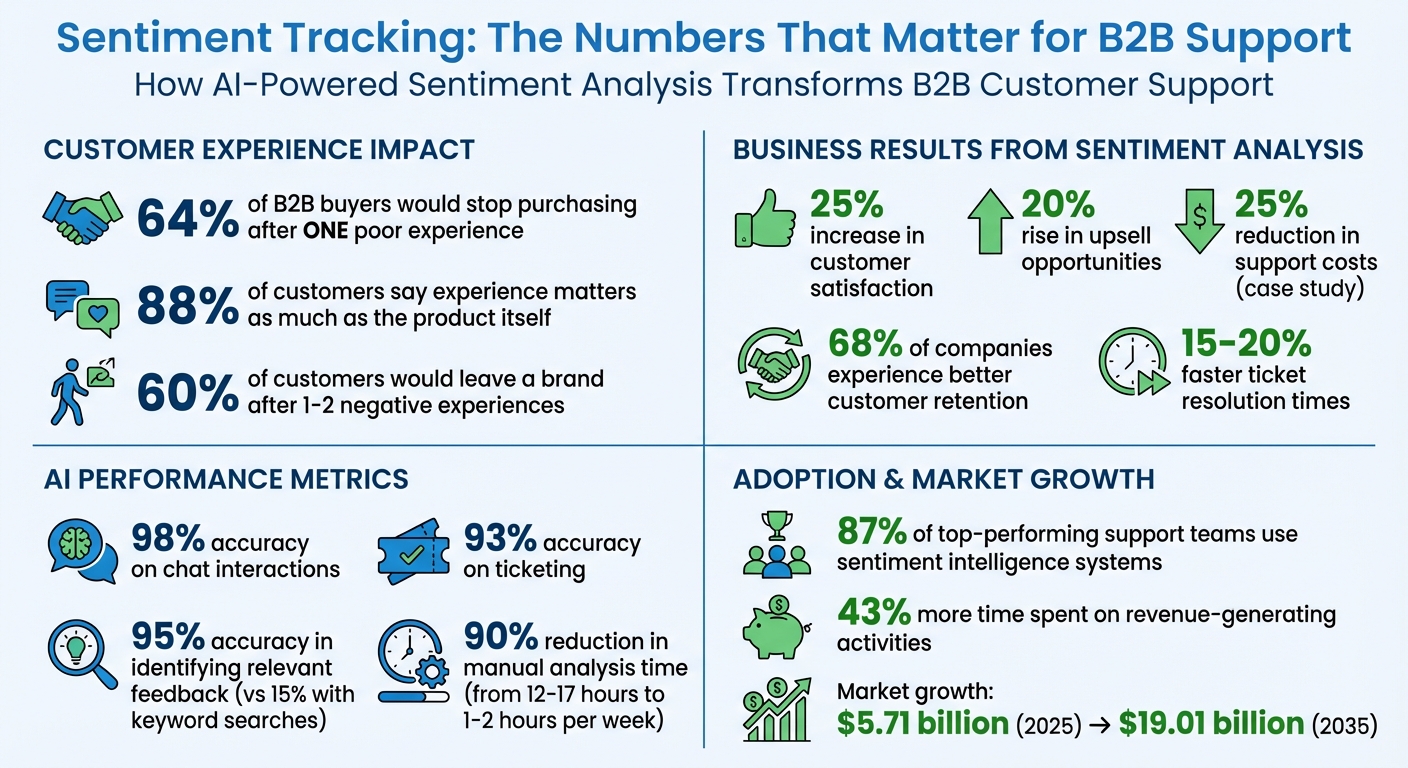
- Why it matters: 64% of B2B buyers would stop purchasing after one poor experience. Sentiment tracking helps prevent this by identifying hidden frustrations.
- How it works: AI tools analyze text and tone from emails, chats, calls, and surveys, detecting subtle signs of dissatisfaction (e.g., formal tone shifts, shorter responses).
- Benefits: Companies using sentiment analysis report a 25% increase in customer satisfaction and a 20% rise in upsell opportunities.
- Tools & Techniques: NLP-based AI systems process sentiment data with up to 98% accuracy, offering actionable insights and automating workflows.
- Visualization: Dashboards and charts (line graphs, heatmaps, bar charts) make it easier to track trends and communicate findings.
By integrating sentiment tracking into your workflows, you can transform customer support from reactive problem-solving to proactive relationship management. This approach doesn’t just resolve issues – it strengthens customer loyalty and drives business growth.
Sentiment Tracking Impact: Key Statistics for B2B Customer Support
Customer sentiment analysis AI explained
sbb-itb-e60d259
Step 1: Collecting Sentiment Data from Customer Interactions
To truly understand your customers, you need to capture sentiment data from every interaction. This ensures there are no blind spots – areas where dissatisfaction might quietly grow without detection.
Where to Collect Sentiment Data
In B2B support, sentiment data comes from various touchpoints: support tickets, email threads, live chat transcripts, voice call recordings, and messaging platforms such as WhatsApp, Slack, Instagram, and Facebook [1][3][4]. Structured feedback tools like CSAT, NPS, and CES surveys also provide direct insights by asking customers to rate their experiences [1][3]. Beyond these, in-app feedback, mobile app reviews, and comments on your Knowledge Base can reveal hidden friction points that might otherwise go unnoticed.
The key is centralizing all these sources into one platform. When sentiment data is scattered across multiple tools, it becomes nearly impossible to follow changes in customer mood throughout their journey [1].
Using AI Tools to Capture Sentiment Data
Once you’ve pinpointed your data sources, AI can simplify the process of capturing and analyzing sentiment. Without automation, analysts spend 12–17 hours every week manually tracking sentiment. AI slashes this workload to just 1–2 hours by automatically processing data, identifying sentiment, and summarizing findings [5].
Platforms like Supportbench use Natural Language Processing (NLP) to classify messages as positive, neutral, or negative. But they don’t stop there. Advanced AI models can pick up on passive aggression, sarcasm, and subtle tone shifts – signs of frustration that may not be immediately obvious when customers remain polite [1]. For voice channels, AI analyzes tone and intent in real time, achieving up to 98% accuracy on chat interactions and 93% on ticketing [4].
AI-generated summaries are particularly helpful when customer histories span months or even years. Instead of combing through dozens of past tickets, agents receive a concise overview that highlights sentiment trends and emotional context – giving them a clearer picture of both events and the customer’s feelings [1]. Modern AI tools can also identify relevant feedback with 95% accuracy, a huge leap from the 15% relevance rate of traditional keyword searches [3].
"The real insights come from looking at what customers say when they need help, especially in support conversations."
– Sharad Khandelwal, CEO, SentiSum [3]
Step 2: Analyzing Sentiment with AI-Powered Tools
After gathering sentiment data, the next challenge is transforming raw text into meaningful insights. AI-powered tools excel at processing vast amounts of customer feedback quickly, helping businesses understand not just how customers feel – happy, upset, or neutral – but also why they feel that way and what steps to take next.
Using NLP Models for Sentiment Scoring
Natural Language Processing (NLP) models are designed to clean up raw text, stripping away irrelevant elements like HTML tags or email signatures, and then analyze linguistic cues such as word choice and punctuation. These models classify sentiment as positive, negative, or neutral, and can even trigger specific actions like escalating an issue or routing it to the right team based on the sentiment scores [7].
Modern transformer-based systems like BERT take sentiment analysis to the next level by understanding the context of a message in real time. For example, if a customer writes, "Great, another delayed shipment", the system recognizes the sarcasm and flags the sentiment as negative – despite the presence of the word "great." This contextual understanding enables support teams to act immediately, preventing frustration from escalating. These advanced tools evaluate multiple signals simultaneously, including word-level sentiment, contextual phrases like "not satisfied", and structural indicators of frustration [7].
The sentiment analytics market is expected to grow significantly, with a valuation of $5.71 billion in 2025 projected to reach $19.01 billion by 2035 [7]. High-performing AI models typically achieve 90% accuracy in sentiment detection and 85% precision in categorization. Companies using these tools often report improvements of 20% to 32% in metrics like customer satisfaction (CSAT) and cost efficiency [5][7].
"CX leaders rank AI-inferred sentiment of customer interactions as the single biggest driver of CSAT improvements."
– Metrigy 2025 Study [7]
Advanced techniques like Aspect-Based Sentiment Analysis (ABSA) take this further by analyzing specific features or topics within a message. For instance, in feedback such as "The new dashboard is fantastic, but the mobile app keeps crashing", ABSA assigns positive sentiment to the dashboard and negative sentiment to the mobile app [8]. This level of detail provides actionable insights that help businesses address specific pain points.
Adding Predictive Metrics to Your Workflows
By combining these scoring techniques with predictive analytics, businesses can anticipate future sentiment trends and take proactive measures. Metrics like CSAT and Net Promoter Score (NPS) can serve as early warning signs, flagging potential dissatisfaction even before customers complete surveys [2]. Tools like Supportbench integrate AI Predictive CSAT and Customer Effort Score (CES) directly into workflows, offering insights into satisfaction levels and resolution ease without relying solely on survey feedback.
AI can also predict churn risk by analyzing trends in negative sentiment alongside factors like product usage and account details. For example, if a customer’s sentiment shifts from neutral to frustrated over several interactions, the system flags the account for proactive outreach. Companies that actively monitor and respond to sentiment trends report an average 25% boost in customer satisfaction [2].
Emotional intensity scoring adds yet another layer by assigning numerical values to emotions like frustration, anxiety, or relief. This allows support teams to prioritize tickets based on emotional urgency rather than just arrival time [7][5]. Some tools even re-evaluate sentiment with each new customer reply, alerting teams to significant mood shifts as they happen [6].
AI-driven workflows also enable smarter SLA (Service Level Agreement) management. For instance, tickets flagged with high frustration levels might automatically receive tighter response deadlines, ensuring urgent issues are addressed promptly [10]. This is especially important in B2B settings, where proactive sentiment management can prevent escalations and strengthen long-term relationships. With 60% of customers stating they would leave a brand after one or two negative experiences [7], these predictive insights shift support from being reactive to strategically proactive.
Step 3: Visualizing Customer Mood Trends
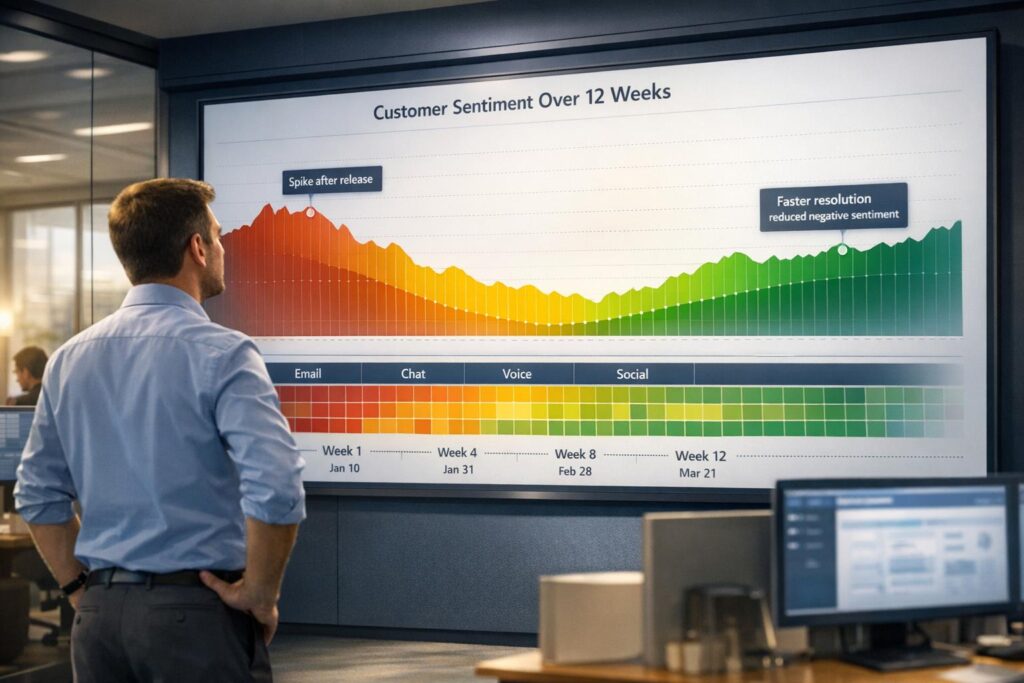
Turning sentiment analysis into visuals makes it easier for decision-makers to grasp key insights. While raw sentiment scores in a spreadsheet might be hard to interpret, a clear chart highlighting a sharp drop in customer mood after a product update can drive action.
The type of visualization you choose should align with your analysis goals. Line graphs are ideal for tracking sentiment trends over time, helping to identify spikes or prolonged dips [13]. Bar charts are great for comparing sentiment across categories like product features, customer groups, or regions, making it easier to pinpoint areas that need attention [13]. For more complex patterns, heatmaps can show sentiment intensity across two dimensions, such as time of day and issue type, revealing "hotspots" of customer frustration [11][12].
For B2B teams, stacked bar charts break down positive, neutral, and negative sentiment across segments like enterprise accounts versus mid-market clients [13]. Word clouds offer a quick visual summary of recurring themes in customer feedback, such as "slow response" or "billing confusion." While word clouds don’t provide precise measurements, they’re excellent for identifying major pain points at a glance [12].
"A good visualization is a spotlight, not a verdict. It tells you where to look, not what to think."
– BrandJet [13]
Be cautious about overreacting to daily fluctuations. Applying a 7-day rolling average to line graphs smooths out noise and highlights real trends [14]. Also, keep dashboards simple – use standard color coding (green for positive, red for negative, gray for neutral) so stakeholders can quickly interpret the data [13].
Choosing the Right Visualization Type
The key is to match the visual to the decision it needs to support. For example, if you’re evaluating how a software update impacts customer mood, a line graph tracking sentiment over time is your go-to [13]. It shows whether sentiment improved, worsened, or remained steady after the update. On the other hand, if you’re comparing customer reactions to different product features, a bar chart helps identify which features drive satisfaction and which cause frustration [13].
Heatmaps are especially useful when analyzing patterns across multiple variables. For instance, plotting sentiment by day of the week and ticket category might reveal that billing complaints spike on Mondays, while technical support issues trend more negative on Fridays [11][12]. Insights like these can guide resource allocation more effectively.
In B2B environments, interactive dashboards are invaluable. They allow stakeholders to filter data by account tier, region, or timeframe and dive into specific datasets [12]. Instead of creating multiple reports, focus on building one adaptable dashboard. Platforms that integrate AI-driven sentiment analysis with visualization tools make it easier to create "decision-ready" visuals [13].
Comparing Visualization Methods
Each visualization technique has its strengths and limitations. Here’s a quick guide to help you choose the right one:
| Technique | Best Use Case | B2B Advantage | Pitfalls |
|---|---|---|---|
| Line Graph | Tracking change over time [13] | Monitors the impact of feature launches or updates [13] | Noise from daily fluctuations without smoothing [14] |
| Bar Chart | Comparing categories [13] | Highlights sentiment differences across regions or features [13] | Can get cluttered with too many categories [13] |
| Heatmap | Multi-dimensional analysis [14] | Identifies specific time/location "hotspots" [13] | Requires more effort to interpret than simpler charts [14] |
| Word Cloud | Spotting common themes [13] | Surfaces frequent pain points or feature requests [14] | Lacks precise numerical data; purely qualitative [14] |
| Divergent Stacked Bar | NPS or segmented data [14] | Visualizes Promoter vs. Detractor ratios over time [14] | May confuse those unfamiliar with NPS centering [14] |
For the best results, combine multiple visualization types on a single dashboard. For instance, use a line graph to show overall sentiment trends, a bar chart to break down sentiment by product feature, and a word cloud to highlight common customer complaints. This layered approach provides both a broad overview and detailed insights, helping leaders make well-informed decisions.
Step 4: Building Dashboards and Reports
Setting Up Real-Time Dashboards
A real-time dashboard gives support leaders an immediate view of customer sentiment, helping them stay on top of trends and issues. To make this work, you need a system that continuously processes data from sources like support tickets, chat logs, email threads, and voice recordings. Tools like AWS Kinesis or REST APIs can help streamline this process, feeding sentiment scores into a central dashboard that updates as new interactions come in.
Start with a high-level sentiment summary showing the distribution of positive, negative, neutral, and mixed responses from the past 24 hours. A donut chart can be a great choice here – it’s simple, quick to interpret, and highlights mood shifts at a glance. Pair this with a line graph tracking sentiment over time (hourly, daily, or weekly) to identify patterns, such as a sudden drop in sentiment following an update or outage.
Adding granular filters takes the dashboard to the next level. Allow filtering by customer tier, region, product category, support channel, or even individual agents. For instance, if sentiment among enterprise accounts dips, leaders can drill down and act quickly. Integrating this dashboard with your CRM system ensures the insights are accessible to the teams responsible for customer satisfaction.
Another valuable feature is tracking sentiment at the agent level. By analyzing individual sentiment scores, leaders can compare how human agents and AI agents handle interactions. Monitoring sentiment across every reply – not just at the start of a conversation – can reveal whether agents are effectively calming frustrated customers.
For B2B teams, topic and entity extraction is a game-changer. Dashboards should highlight recurring phrases or entities tied to negative sentiment, such as "billing", "shipping", or "login issue." This helps pinpoint operational bottlenecks or product bugs that need immediate fixes. Alerts based on spikes in negative sentiment around specific topics can prompt managers to intervene quickly.
These real-time insights set the stage for creating reports that provide a broader, strategic view.
Creating Exportable Reports for Leadership
Dashboards are great for real-time monitoring, but leadership often needs exportable reports to assess the bigger picture. These reports should combine sentiment trends with key performance metrics like SLA compliance, First Contact Resolution, and CSAT scores, giving a complete view of support operations.
To make reports actionable, categorize sentiment drops into areas like product issues, operational inefficiencies, and knowledge gaps. Dive deeper by evaluating customer sentiment alongside agent performance and the effectiveness of AI tools.
Take this example: In March 2026, a large online trading platform handling over 300,000 tickets annually adopted Robylon’s sentiment and automation tools. Within 15 days, 83% of tickets were automated with an initial accuracy rate of 93%. Over six months, the platform reduced support costs by 25% and achieved nearly 100% accuracy with human-in-the-loop validation [4].
"Support teams do not struggle because they lack data. They struggle because they cannot interpret it at scale."
– Dinesh Goel, Chief Executive Officer, Robylon
For faster report generation, consider using materialized views in SQL environments like Databricks. This approach eliminates the need to recompute data each time a report is accessed, speeding up load times. Hourly aggregation counters can also ensure queries run quickly, even with large volumes of feedback.
Lastly, make sure reports can be exported in formats that include full transcripts and audit logs. This is especially critical for industries with strict compliance requirements. Providing interaction-level details alongside aggregate sentiment scores helps leadership better understand trends. Aligning reporting tools with standards like SOC 2, GDPR, and HIPAA ensures data governance and audit readiness are up to par.
Step 5: Using Sentiment Trends to Improve Customer Experience
Understanding sentiment trends doesn’t just streamline support processes – it strengthens the bond you have with your customers.
Identifying and Addressing Sentiment Drops
Sentiment tracking sheds light on customer pain points, even when tickets are marked as resolved. Weekly AI-driven analysis categorizes recurring problems into three main areas: product defects, operational delays (like slow second-response times), and knowledge gaps (such as outdated pricing details in your help center). By breaking down sentiment data this way, you can turn insights into concrete solutions.
Pay close attention to customers who consistently show signs of frustration across multiple interactions. These patterns often signal a high risk of churn, even if their tickets appear resolved. Similarly, monitoring sentiment after escalations can help confirm whether high-touch interventions successfully eased customer frustrations.
Connecting Sentiment to Performance Metrics
Tie sentiment data to performance metrics like First Contact Resolution (FCR) and case escalations to detect hidden friction points. For example, a ticket might be marked "resolved", but if the process caused frustration, the experience still falls short. When 88% of customers say their experience matters as much as the product itself, bridging this gap becomes essential [10].
Track sentiment changes before and after each agent response to identify which team members excel at calming frustrated customers. This "sentiment delta" offers valuable coaching opportunities, especially around empathy and tone. If your FCR rates look solid but negative sentiment persists, it’s a red flag for process inefficiencies – tickets may close quickly, but the handling leaves customers unsatisfied.
Automating Actions Based on Sentiment
Once you’ve gathered these insights, automation can help you act quickly and effectively. Modern tools like Supportbench integrate sentiment analysis directly into workflows, turning emotional cues into triggers for action. For instance, you can set rules to escalate tickets automatically when sentiment drops below a certain threshold during a conversation, ensuring senior agents step in before the issue escalates further. Dynamic SLA management can also prioritize faster responses for tickets flagged with high negative sentiment, bypassing static priority levels.
In live chat scenarios, AI can detect rising frustration in real time and notify a human agent to step in before the situation worsens. If customers use phrases like "cancelling" or "switching providers", automated alerts can prompt your Customer Success team to intervene immediately. This proactive strategy helped a large online trading platform reduce support costs by 25% over six months while managing over 300,000 tickets annually [4]. Automation turns sentiment insights into real-time action, stopping problems before they spiral out of control.
Conclusion: Using Sentiment Tracking to Get Ahead of Customer Issues
Sentiment tracking provides a proactive way for B2B support teams to identify and address customer concerns before they escalate into larger problems. Instead of waiting for cancellations or complaints, this approach helps teams catch issues early, preserving relationships and improving overall customer satisfaction. By capturing data and automating responses, sentiment tracking streamlines the support process and enhances customer engagement.
The numbers speak for themselves. 87% of top-performing customer support teams use sentiment intelligence systems [15]. Those who adopt these tools see 15–20% faster ticket resolution times [15] and report that 68% of companies experience better customer retention after implementing feedback intelligence software [15]. Considering that 88% of customers value the experience as much as the product itself [1], the competitive advantage of sentiment tracking becomes undeniable.
Beyond improving customer relationships, AI-driven sentiment analysis also saves time. Automated sentiment processing reduces manual analysis time by about 90% [5], allowing teams to focus on more impactful tasks. In fact, support teams using these tools spend 43% more time on revenue-generating activities rather than being bogged down by manual data processing [9]. This shift enables a move from reactive support to a proactive, customer-first approach.
"AI-driven sentiment analysis is no longer optional for customer support – it’s a practical way to improve service quality, customer retention, and team performance." – Eric Klimuk, Founder and CTO, Supportbench [1]
To get started, focus on one high-traffic channel. Set up automated alerts for VIP accounts showing negative sentiment and create workflows to escalate cases with concerning language. Once this process is working smoothly, expand to other channels and incorporate sentiment data into your performance metrics. By doing so, your team will transform from simply reacting to problems into delivering proactive, high-quality customer care.
FAQs
How do I pick a sentiment threshold for escalations?
To establish an effective sentiment threshold for escalations, start by examining historical data. Look for sentiment scores that correlate with previous escalations or instances of customer churn. Leverage AI tools to track real-time sentiment indicators – such as tone, word usage, and phrasing – to identify signs of dissatisfaction early on. AI models that adapt to changing trends and context can fine-tune these thresholds over time, enabling quicker escalations and improving both support efficiency and the overall customer experience.
How can we validate sentiment accuracy for our industry language?
To ensure sentiment analysis aligns with the language of your industry, start by using training data tailored to your field. Regular updates are crucial to keep up with shifts in terminology. Test your model’s outputs against manually reviewed datasets to spot any bias or inaccuracies. Additionally, fine-tune pre-trained models by incorporating your industry’s specific vocabulary. Consistent performance monitoring is key to maintaining precision. These practices help your sentiment analysis stay in sync with the unique expressions and nuances of your industry.
How can sentiment trends be linked to churn risk and revenue?
AI-powered sentiment analysis is a game-changer for spotting early signs of dissatisfaction and emotional shifts that could lead to customer churn. By tracking changes in sentiment over time and pairing this data with behavioral insights like usage patterns, businesses can predict churn with greater precision and act before it’s too late. With automated workflows, support teams can focus on high-risk accounts, potentially cutting churn rates by 25-40% and protecting valuable revenue streams.