
Escalation reporting often prioritizes urgency over actual impact, leading to inefficiencies, burnout, and unresolved systemic issues. This approach wastes resources, pulls engineers into repetitive tasks, and discourages frontline agents. Instead, focus on building reports that highlight patterns, measure decision delays, and track root causes to improve processes and prevent recurring problems.
Key takeaways:
- Impact over urgency: Prioritize issues affecting the most users or causing repeat escalations.
- Track decision latency: Measure how long it takes to act on escalations and reduce delays.
- Analyze patterns: Use trends to address systemic problems instead of isolated incidents.
- Empower frontline agents: Equip them with better tools and context to resolve issues earlier.
- Leverage AI: Automate data analysis, identify root causes, and streamline reporting.
Do you have a culture of escalation?
sbb-itb-e60d259
Why Escalation Reporting Matters in B2B Support
Escalation Reporting Metrics: Reactive vs Root Cause Focus Outcomes
Escalation reporting isn’t just about tracking issues – it’s about understanding the story behind them. When done right, it shifts your team from constantly putting out fires to thinking strategically. It helps you see if engineering resources are being used wisely, whether agents have the tools they need, especially when managing software and cloud services, and if customers are consistently getting the support they deserve. This approach can turn your support team into a driver for product improvement rather than just a cost center.
Without a standardized way to report escalations, you’re flying blind. Engineering teams might focus on high-profile incidents instead of tackling the problems that genuinely affect the most users [2]. This can create a culture where urgency overshadows importance, leaving recurring issues unaddressed while isolated incidents grab all the attention.
Balanced reporting sheds light on the bigger picture. It shows whether problems are concentrated in specific industries, among high-value accounts, or at certain stages of the customer lifecycle. It can also reveal gaps in agent knowledge that lead to unnecessary escalations to subject matter experts (SMEs) [3]. By identifying patterns in escalations, you can address systemic problems, freeing up senior engineers to focus on long-term goals.
The financial benefits are real. Take Cynet, a cybersecurity company that implemented an AI-driven platform in 2025 to reduce escalations. By centralizing knowledge and giving agents immediate access to answers, they resolved 47% of tickets at Tier 1 without needing to escalate. This also cut resolution times in half [3]. These results highlight how effective escalation reporting can make a measurable impact.
The Risks of Rewarding Panic
When escalation metrics focus too much on urgency or SLA risks, they can encourage the wrong behaviors. Teams may prioritize the loudest issues instead of the ones with the greatest overall impact. This can lead agents to escalate problems prematurely rather than using better tools or documentation to resolve them themselves.
The hidden costs of this approach stack up quickly. SMEs are pulled away from important work to repeatedly handle the same issues, which can lead to burnout and turnover. Meanwhile, frontline agents may feel discouraged from tackling complex problems, believing they don’t have the resources to succeed [3].
Tina Grubisa, a Value Consultant at Mosaic AI, sums it up well:
Escalations have a much more significant impact than they realize. It’s a bottleneck that can be removed rather easily [3].
The problem isn’t that escalations happen – it’s that reactive reporting makes them inevitable. By shifting focus from urgency to root causes, you can turn escalations into opportunities for improvement rather than recurring headaches.
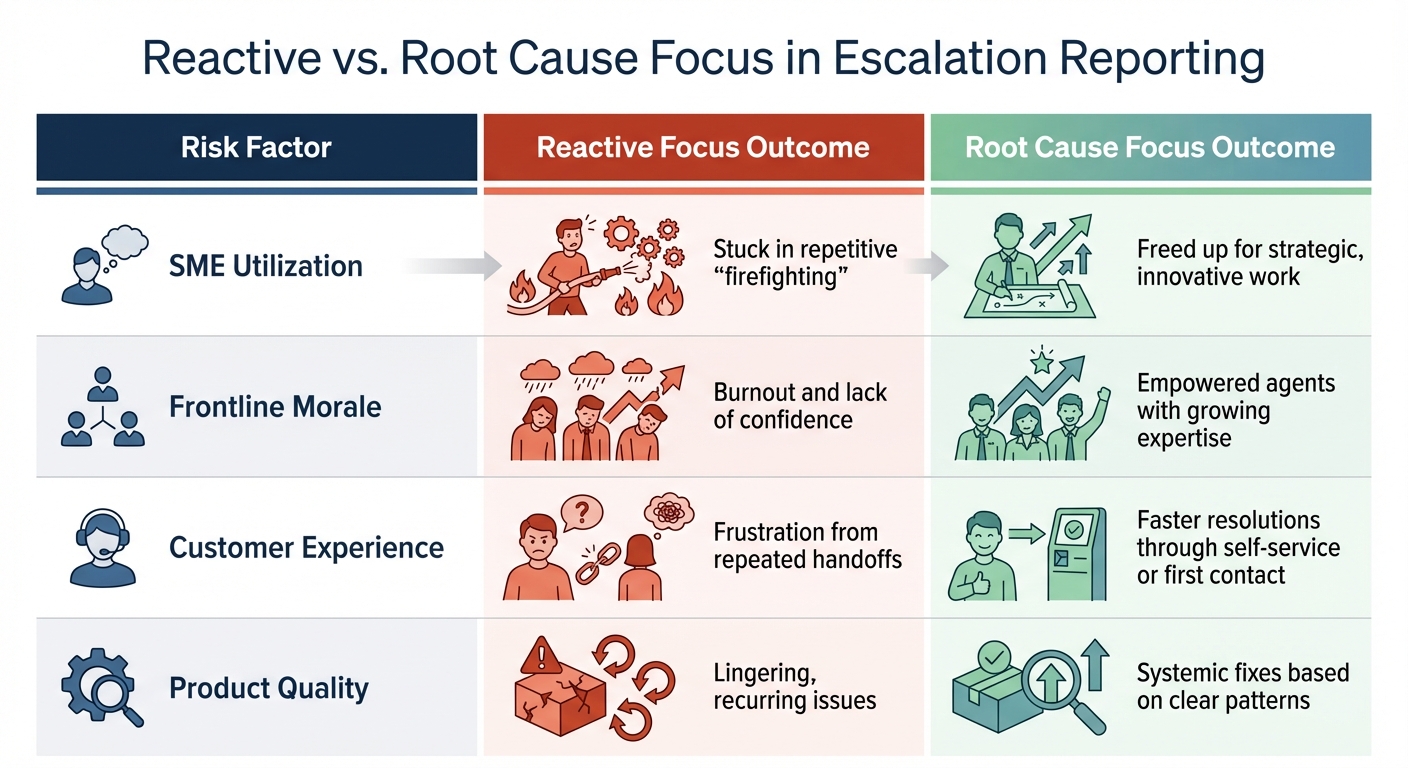
| Risk Factor | Reactive Focus Outcome | Root Cause Focus Outcome |
|---|---|---|
| SME Utilization | Stuck in repetitive "firefighting" | Freed up for strategic, innovative work |
| Frontline Morale | Burnout and lack of confidence | Empowered agents with growing expertise |
| Customer Experience | Frustration from repeated handoffs | faster resolutions through customer self-service or first contact |
| Product Quality | Lingering, recurring issues | Systemic fixes based on clear patterns |
The Value of Root Cause Analysis
Panic-driven reporting can distort priorities, but focusing on root causes provides a clearer path forward. Effective escalation reporting doesn’t just ask, “How quickly can we resolve this?” Instead, it asks, “Why did this escalate in the first place?” This shift from reacting to preventing is where real operational improvements take root [3].
Root cause analysis uncovers trends that individual incidents might hide. By spotting recurring issues, you can create a feedback loop – capturing solutions from escalations and sharing them with frontline agents to prevent similar problems in the future [3]. Using objective criteria like the number of affected users, problem frequency, and the difficulty of workarounds ensures that prioritization is fair and transparent. Tracking metrics like "SME time protected" shifts the focus from firefighting to proactive, strategic work [3].
Key Components of a Balanced Escalation Report
A well-rounded escalation report goes beyond just identifying issues – it pinpoints process failures and helps prevent them from happening again. The focus should be on metrics that highlight operational inefficiencies, not just speed or volume. Richie Aharonian, Head of Customer Experience & Revenue Operations at Unito, describes this approach as "breakpoint diagnostics":
Traditional escalation metrics track outcomes… But escalations fail at structural breakpoints: handoff delays between teams, context lost in transitions, priority downgraded when crossing tools [4].
Metrics That Focus on Efficiency
The right metrics reveal where time and context slip through the cracks during escalations. For example:
- Time-to-escalate measures how long agents manage a ticket before escalation, exposing potential bottlenecks [4].
- Handoff delay time tracks the gap between when a ticket is escalated and when the next team begins work. High delays often point to routing or notification issues, rather than workload problems [4].
- Decision latency measures the time from escalation to a concrete decision, such as approving a rollback or engaging a vendor. For Severity 1 incidents, this should stay under 30 minutes [1].
- Escalation bounceback rate shows how often tickets are returned to the previous tier for clarification. A healthy rate is 5-10%, while rates above 20% suggest missing or unclear escalation details [4].
- Context loss incidents count cases where engineers have to re-request information already gathered. This highlights integration gaps between tools and leads to "invisible rework", costing teams time and efficiency [4].
Data shows organizations can lose 3-6 hours per person per week due to manual data updates – time spent copying information between systems [4]. Tracking the SLA breach rate on escalated tickets separately from general tickets also helps identify whether the escalation process itself is causing SLA failures [4].
| Metric | What It Diagnoses | Target Benchmark |
|---|---|---|
| Handoff Delay | Routing and notification issues | < 30 minutes (High Priority) [4] |
| Bounceback Rate | Incomplete or unclear escalation forms | 5-10% [4] |
| Context Loss | Tool integration gaps and rework | < 10% of escalations [4] |
| Decision Latency | Bottlenecks in approvals or ownership | < 30 minutes (Sev1 incidents) [1] |
These metrics go beyond diagnosing inefficiencies – they provide the foundation for identifying trends and making meaningful improvements with the right KPIs.
Highlighting Trends Over Individual Incidents
Focusing on individual escalations only tells part of the story. Patterns, on the other hand, reveal the root causes. As Tina Grubisa, Value Consultant at Mosaic AI, explains:
Individual escalations are symptoms. Escalation patterns uncover root causes [3].
By analyzing trends, teams can shift their focus from fixing isolated tickets to identifying recurring issues that require proactive solutions. Weekly reviews with a standardized taxonomy of 8-12 consistent escalation reasons can help track trends and re-escalation rates, turning scattered data points into actionable insights [1].
High-performing teams often dedicate 30 minutes each week to reviewing KPI trends – like p90 time-to-escalate regressions – alongside deep dives into a few incidents that highlight broader patterns [1]. Tracking re-escalation rates (the number of escalation events per incident) is also critical for identifying loops or unclear ownership that might go unnoticed in individual ticket reviews.
By prioritizing trends over isolated cases, your report can move from reactive problem-solving to proactive prevention – a key principle of effective AI-driven B2B support.
Emphasis on Long-Term Resolution Strategies
Every report should end with one or two long-term actions, with clear ownership and deadlines assigned. This ensures that improvements – whether in help content, automation, or product features – are implemented and sustained. As EverWorker AI puts it:
Escalation excellence isn’t about moving faster in chaos – it’s about designing a system that prevents chaos from forming [5].
A practical step is requiring fields in your ticketing system to log "Decision Type" and "Decision Owner" for every escalation. This ensures that each resolution leads to a documented improvement in policy, product, or process. AI tools can also cluster tickets to identify recurring escalation drivers, such as outdated help articles. Saving even 15 minutes per escalation can add up to significant productivity gains across teams [5].
Adding a brief interpretation for each metric helps clarify trends and shifts your organization from simply explaining what went wrong to creating reports that guide automation and workflow adjustments before problems arise again.
How to Build an Effective Escalation Reporting Process
Creating a system that captures useful data, spots escalation trends, and promotes long-term solutions is essential for efficient issue resolution. Here’s a guide to structuring a process that reduces panic and improves outcomes.
Step 1: Define Clear Escalation Criteria
To avoid confusion and ensure consistency, establish objective criteria for escalations. A severity matrix can help, using measurable factors like:
- SLA breaches: For example, tickets nearing 90% of their SLA limit.
- Business impact: Issues disrupting core operations for customers.
- Account tier: Escalations for Enterprise or at-risk accounts.
- Technical complexity: Problems requiring engineering or product team involvement.
- Sentiment analysis: AI tools flagging keywords such as "unacceptable", "legal", or "cancel" as potential escalation triggers [6].
Include an "Effort Summary" in reports to outline troubleshooting steps taken before escalation. This ensures context is preserved. Each report should also specify a clear request, like “Need developer review” or “Need executive outreach,” to prompt action rather than just logging the issue.
Step 2: Standardize Reporting Templates
Using standardized templates ensures context is maintained and decision-makers have the information they need to act quickly. Organizations with clear escalation procedures often see up to a 23% improvement in customer satisfaction (CSAT) scores [6]. Templates should include:
- Root cause categories: Examples include Bug, Feature Gap, or User Error.
- Handoff notes: For smooth transfers between teams.
- Decision tracking: Fields to specify decision type and owner for accountability.
"Standardized handoff protocols with comprehensive documentation requirements… ensure context preservation across all transfers." – Eljohn Macaranas, Content Writer, CX Foundation [6]
Incorporate ticket tagging to organize escalations by root cause. This simplifies trend analysis and highlights recurring problems that need systemic solutions. An escalation matrix within the template can outline authority levels, such as refund limits or approval tiers, to ensure issues are immediately routed to the right person [6].
Step 3: Use AI for Data Analysis
AI tools can analyze historical escalation data to uncover patterns, such as recurring "Problem Clusters" or systemic failures. These insights help teams address underlying issues before they escalate further.
AI also enhances escalation thresholds with sentiment analysis and emotional intelligence. For example, it can prioritize high-value or frustrated customers, routing them to human experts faster and reducing churn risk. By clustering related escalations and eliminating duplicates, AI minimizes "alert fatigue" and allows teams to focus on resolving root causes rather than symptoms. Some AI platforms even reduce token usage by as much as 95% through efficient data processing [7].
Additionally, AI automates much of the administrative work in escalation reporting. It can generate summaries of escalated cases, complete with sentiment analysis and prior resolution attempts, so customers don’t have to repeat themselves. Machine learning further refines escalation triggers and routing accuracy over time by analyzing the outcomes of past cases. This creates a continuous improvement loop that makes the process more efficient and effective.
Examples of Balanced Escalation Reports
These reports demonstrate how focusing on meaningful insights rather than reactionary metrics can lead to long-term improvements. By examining these examples, it becomes easier to create reports that encourage actionable outcomes.
Example 1: Tracking Escalation Trends
A trend report identifies a noticeable increase in escalations during the first week of March 2026. Rather than detailing every individual ticket, the report categorizes incidents by their root causes using a standardized taxonomy, such as Bug, Feature Gap, Integration Issue, or User Error. The analysis reveals that 18 out of 27 escalations are linked to a single integration failure affecting customers using a specific API version. To prioritize actions, the report employs an impact score that combines factors like frequency, the value of affected accounts, and the severity of available workarounds. This rubric-based approach helps direct engineering efforts effectively[2].
The report also cross-references these escalations with existing knowledge base articles. This analysis uncovers a gap – there is no documentation addressing error handling for the API version in question[3].
With these findings in mind, the next example demonstrates how efficiency metrics can be leveraged to improve resolution quality.
Example 2: Highlighting Resolution Efficiency
An efficiency-focused report shifts the narrative from the sheer number of escalations to the quality of their resolutions. For instance, a quarterly report tracks decision latency – the time between an escalation and the corresponding documented decision[1]. It identifies the top 10 incidents with the longest delays, shedding light on cases where extended decision times caused inefficiencies. The report also monitors the re-escalation rate, pinpointing situations where unclear ownership led to multiple escalations for the same issue[1].
Instead of celebrating low escalation numbers, the report highlights the reduction in senior engineers’ workload. For example, a 47% ticket deflection rate demonstrates how Subject Matter Experts (SMEs) were able to focus on complex issues instead of routine escalations[3]. This mirrors the success of a cybersecurity company in 2025, which achieved a significant lift in customer satisfaction – raising their CSAT score by 14 points (from 79 to 93) – while maintaining a 47% deflection rate by emphasizing resolution quality over speed[3].
Both examples showcase how actionable insights can replace reactive responses, driving systemic improvements and fostering long-term success.
Conclusion
Effective escalation reporting goes far beyond just tracking urgent tickets. It’s about creating systems that minimize unnecessary escalations while ensuring critical ones are handled with the attention they deserve. By zeroing in on actionable data – like identifying root cause patterns and tracking repeat escalation frequency – support teams can move away from constant firefighting and focus on solving problems before they arise. This shift protects your most valuable resource: the time and expertise of Subject Matter Experts, allowing them to prioritize innovation rather than repeatedly addressing the same issues. Plus, this proactive mindset aligns seamlessly with AI-powered analytics, driving continuous improvement.
AI plays a key role in this transformation. By late 2025, 88% of organizations were already leveraging AI in at least one business function [8]. AI has proven its ability to uncover critical patterns in massive datasets, streamline knowledge capture and article creation, and provide immediate context to frontline agents. As seen with Cynet’s results [3], AI-driven tools can deliver measurable outcomes that enhance escalation management.
When used effectively, escalation reporting offers long-term benefits that extend beyond traditional efficiency metrics. Reports that highlight trends and resolution quality – rather than just speed – create a feedback loop that strengthens support operations and empowers agents on the front lines. By focusing on root causes and resolution strategies, operational hurdles can be transformed into opportunities for strategic growth.
"The goal isn’t zero escalations – it’s ensuring every escalation is necessary while preventing those driven by information gaps or insufficient agent support." – Mosaic AI [3]
FAQs
Which escalation metrics prevent panic-driven prioritization?
Escalation metrics help keep prioritization grounded, avoiding decisions driven by panic. Instead of focusing solely on outcomes, they emphasize structural and process-based factors. Key metrics include:
- Time-to-escalate: Tracks how quickly issues are raised, ensuring timely attention.
- Re-escalations: Monitors repeated escalations, highlighting unresolved or recurring problems.
- Decision latency: Measures delays in decision-making after escalation, pinpointing bottlenecks.
These metrics ensure that prioritization aligns with actual customer impact and process efficiency, rather than reactive urgency.
How do I measure and reduce decision latency in escalations?
To effectively measure decision latency, focus on tracking key performance indicators (KPIs) like time-to-escalate and decision latency. Start by standardizing escalation tags to maintain consistency across your data. Then, create timestamped event tables to log every step of the decision-making process. Use dashboards to monitor trends over time and spot areas for improvement.
If reducing latency is your goal, clear workflows are essential. Define roles and responsibilities so everyone knows what to do and when. Leverage AI tools to pinpoint delays and identify patterns causing slowdowns. Make it a habit to review escalation data weekly – this helps uncover bottlenecks and ensures timely adjustments.
These steps pave the way for faster decisions, leading to better support efficiency and a smoother overall process.
What’s the fastest way to start root-cause trend reporting with AI?
The fastest way to dive into root-cause trend reporting with AI is by leveraging AI tools to sift through ticket data for recurring problems. Begin by organizing escalation intake using structured fields – this creates a consistent framework for analysis. Next, apply AI-powered pattern detection to uncover trends. By automating this process within your support platform, you’ll speed up root-cause analysis, cut down on manual work, and focus on actionable insights that boost resolution efficiency.