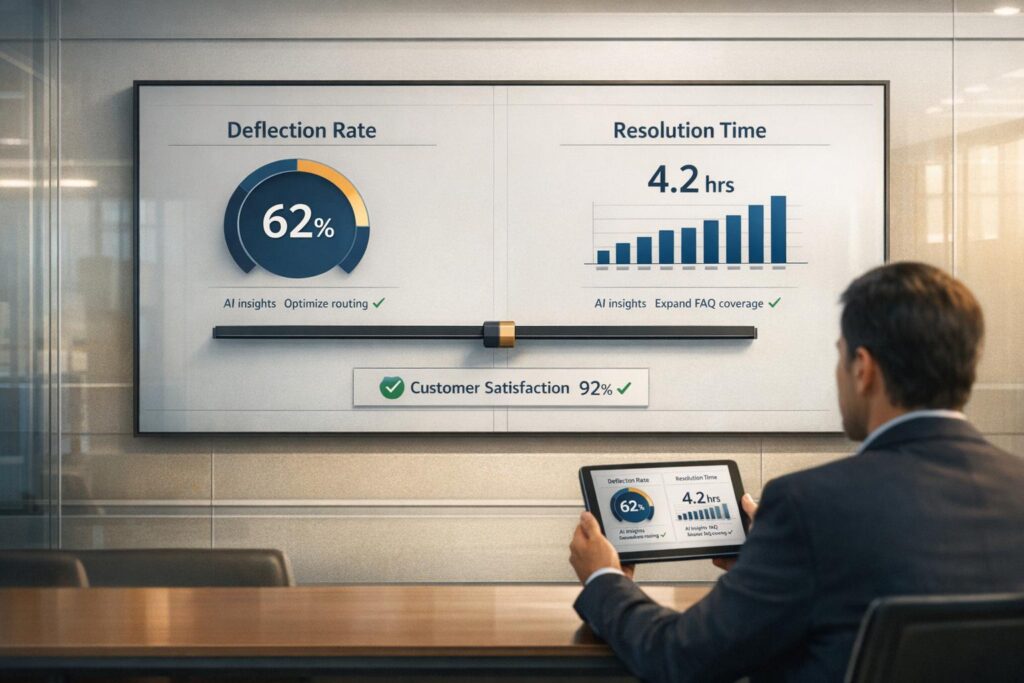
Measuring portal success boils down to balancing two key metrics: deflection rate and resolution time. Deflection rate shows how many customer inquiries are resolved through self-service tools, while resolution time measures how quickly human agents close tickets. Here’s what you need to know:
- Deflection Rate: Tracks the percentage of issues resolved without human intervention. For example, if 7,500 out of 10,000 inquiries are resolved via self-service, the deflection rate is 75%.
- Resolution Time: Measures the average time it takes to resolve tickets requiring human support, from ticket creation to closure.
- Balance is Key: High deflection rates save costs but can frustrate customers if self-service fails. Similarly, rushing to resolve tickets can harm quality.
By 2026, AI deflection rates are expected to hit 50%, cutting costs by up to 90%. However, false deflections – when customers abandon self-service and escalate later – can disrupt efficiency. To succeed, track both metrics together, validate self-service effectiveness, and ensure seamless handoffs to human agents when needed.
Key Takeaways:
- Cost Savings: AI-driven interactions cost $1.40–$1.84 per ticket vs. $22–$42 for human agents.
- Industry Benchmarks: Aim for deflection rates of 20–40% and resolution times under 11 hours for SaaS.
- Best Practices: Use AI tools for case summaries, monitor customer experience metrics like CSAT, and maintain an accurate knowledge base.
Balancing deflection and resolution ensures efficient support while keeping customers satisfied.
Understanding Deflection Rate and Resolution Time
What is Deflection Rate?
Deflection rate measures how often customer support issues are resolved using self-service tools – like AI chatbots, knowledge bases, or portals – without needing human assistance [7]. Here’s the formula:
(Number of issues resolved via self-service ÷ Total support inquiries) × 100
For example, if your portal handles 10,000 inquiries in a month and 7,500 are resolved through self-service, your deflection rate is 75%. To count as "deflected", the customer must avoid contacting a human agent about the same issue within a 24- to 72-hour period.
But not all deflections are created equal. It’s crucial to validate them using engagement signals – like time spent on a page, scrolling behavior, or positive feedback – to confirm the self-service interaction actually resolved the issue. Otherwise, you might misinterpret incomplete interactions as successes.
What is Resolution Time?
Resolution time tracks the average time it takes to close tickets that require human intervention after failing to be resolved through self-service [7]. This metric covers the entire ticket lifecycle, from when it’s opened to when it’s closed [9].
In B2B support, resolution time is especially important because it reflects how well teams handle complex workflows and high-priority issues. It’s also a key factor in meeting Service Level Agreements (SLAs) [9].
A long resolution time might point to areas needing improvement, such as agent training, access to better resources, or the quality of the internal knowledge base. However, speed isn’t everything. Rushing to close tickets can lead to errors or repeat follow-ups, which ultimately harm customer satisfaction [9].
How These Two Metrics Interact
Now let’s look at how these two metrics work together to shape support efficiency. Deflection rate and resolution time are linked in a way that directly impacts operations. When self-service tools effectively handle simple, repetitive inquiries, they free up agents to focus on more complex, high-value tickets. This filtering process reduces overall ticket volume but often leaves agents with more challenging cases, which may take longer to resolve [7].
However, false deflections can disrupt this balance. These occur when customers abandon ineffective self-service attempts and escalate their issues later, creating delays in resolution [12].
"Successfully deflecting routine questions allows your support team to dedicate their bandwidth to complex, high‐impact issues that genuinely require human nuance."
– Rohit Joshi, YourGPT [5]
To avoid such pitfalls, clean handoffs are essential. When self-service tools can’t solve a problem, they should seamlessly pass the conversation – including transcripts and context – to a human agent. This ensures customers don’t have to repeat themselves, speeding up resolution times and improving the overall experience [12].
sbb-itb-e60d259
How AI is Changing Support KPIs in 2026 with Eric Nelson, Stylo
How to Measure Portal Metrics: Step-by-Step
Measuring portal metrics accurately is key to balancing cost efficiency with high-quality support. Below, you’ll find step-by-step guidance on tracking deflection rates and resolution times effectively.
How to Calculate Deflection Rate
Start by categorizing customer requests into three groups: those fully handled by AI, those resolved through the knowledge base, and those escalated to human agents [1]. Use a standard formula to calculate deflection, ensuring that the total number of requests includes both self-solved cases and submitted tickets – not just web sessions [5].
To avoid inflating your numbers, rely on unique identifiers like user IDs or cookies [5]. Track two types of deflection:
- Explicit Deflection: When users abandon a ticket form after engaging with suggested articles.
- Implicit Deflection: When users find solutions via search.
However, don’t stop at measuring deflection alone. Pair it with AI-handled customer satisfaction (CSAT) scores to verify whether issues are truly resolved. For instance, a high deflection rate paired with a CSAT below 60% likely indicates quality problems, not effective portal use [1]. Take Forma as an example: between October 2024 and March 2025, the platform improved its deflection rate from 30% to 39% by resolving over 5,000 inquiries through AI support, out of a total of 13,800 [4].
To dig deeper, segment your data by customer tier (e.g., transactional vs. retainer), issue type (e.g., password resets vs. technical bugs), and the specific portal features used. This helps pinpoint which areas of self-service are most effective [3][4]. Also, compare deflection rates within the same channel type – such as chat AI versus email AI – since their cost structures differ significantly [1].
Once you’ve nailed down self-service performance, shift your focus to resolution time for a complete understanding of your portal’s efficiency.
How to Calculate Resolution Time
Resolution time measures how long it takes to fully resolve a ticket, starting from its creation and including any escalations [1]. Self-service attempts that don’t escalate are excluded from this metric. Begin tracking from the moment a ticket is created (following a failed self-service attempt) until the issue is confirmed as resolved.
AI-driven case classification can help here by automatically categorizing tickets at creation, improving routing accuracy and providing clean data to analyze resolution trends by issue type [6].
Keep an eye on your deflection failure rate – cases where customers attempt self-service but still need live agent support. This can reveal where delays begin [13]. Set alerts for tickets that remain unresolved for more than 48 hours, as these may highlight bottlenecks in your escalation process [1]. When analyzing resolution time, use median values instead of averages, as complex cases can skew results by as much as 20–40% [1].
Industry Benchmarks for B2B Portals
With your deflection and resolution metrics in hand, compare them against industry standards. For B2B portals in 2026, aim for a deflection rate between 20% and 40% [3]. The median AI deflection rate is expected to hit 50% by 2026, up from 18% in 2024 [1]. Generally, an AI deflection rate above 30% is needed to justify investment in advanced AI tools [1].
| Industry | Median Resolution Time | Top Decile (Best-in-Class) | Red Flag Threshold |
|---|---|---|---|
| SaaS/Software | 11 hours | < 2 hours | > 48 hours |
| E-commerce | 6 hours | < 1 hour | > 48 hours |
| Financial Services | 24 hours | < 6 hours | > 72 hours |
| Telecom | 18 hours | < 4 hours | > 48 hours |
Source: Customer Support Benchmarks 2026 [1]
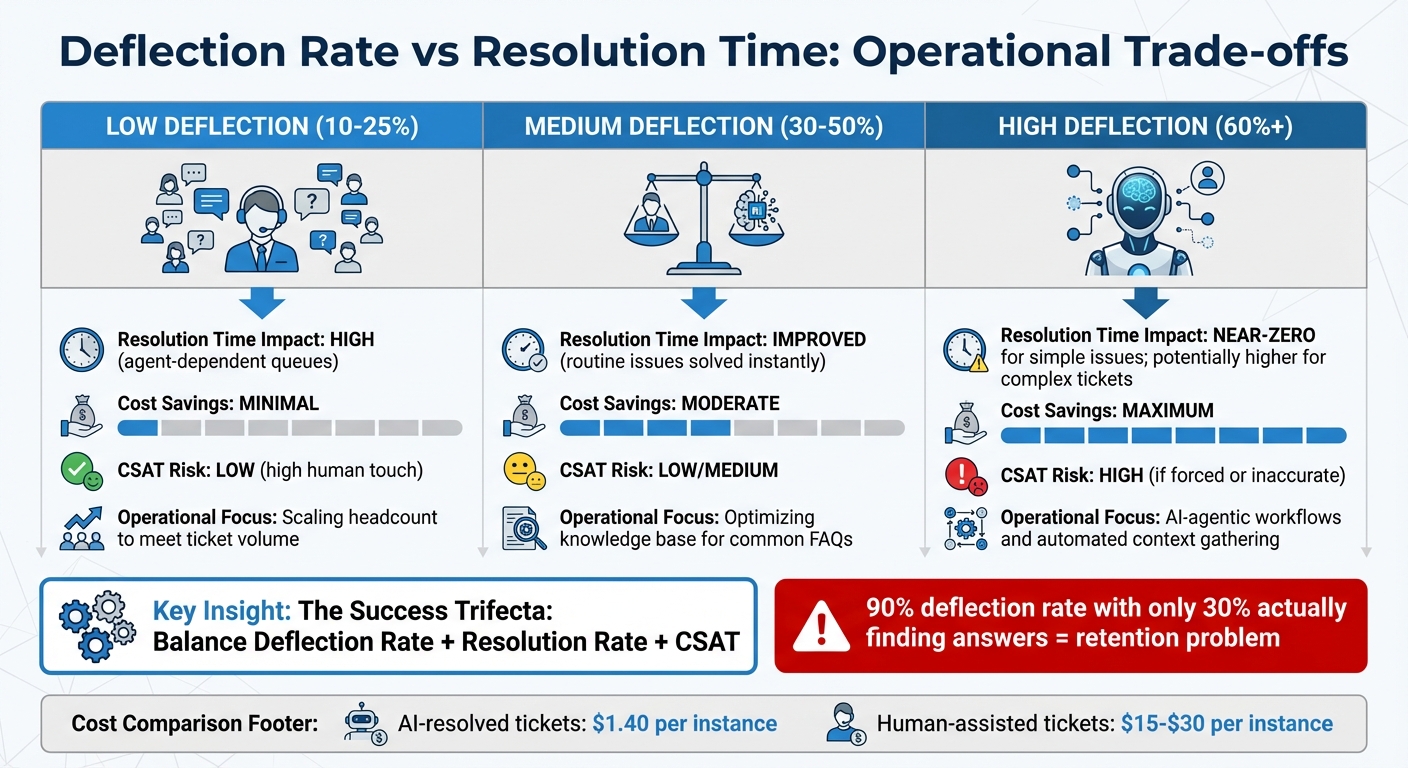
AI-resolved tickets are far more cost-effective, averaging $1.40 per instance compared to $15–$30 for human-assisted tickets [1]. Teams with AI deflection rates above 40% have seen their blended cost-per-ticket drop by 15–25% annually [1]. For example, in the SaaS/Software sector, the median cost per ticket is $22.00, but highly efficient teams reduce this to under $12.00 by leveraging strong deflection rates [1].
Analyzing the Trade-Offs Between Deflection Rate and Resolution Time
Deflection Rate vs Resolution Time Trade-offs in Customer Support
When evaluating deflection and resolution, it’s important to understand how these factors interact and influence overall operations. A higher deflection rate doesn’t automatically translate to better support. The real question is whether customers are resolving their issues or simply giving up in frustration. As Matthew Plotkin from Inkeep explains:
"Deflection is useful, but it does not capture the biggest cost. The better question is: did we reduce the time to diagnose and resolve complex tickets?" [2]
The distinction between effective self-service (good deflection) and abandonment (bad deflection) is critical. Good deflection occurs when customers quickly find accurate answers on their own. In contrast, bad deflection happens when customers abandon their search due to inaccessible or unhelpful support options, often resulting in "silent churn" [5]. Rohit Joshi from YourGPT highlights this issue:
"High deflection numbers paired with low customer satisfaction indicate a misplaced focus on deflection over resolution." [5]
How Different Deflection Levels Impact Operations
Deflection levels directly shape operational dynamics. At lower deflection rates (10–25%), customer support teams focus heavily on handling ticket queues. While this approach minimizes cost savings, it fosters stronger customer relationships through high-touch support. Medium deflection rates (30–50%) strike a balance by resolving routine issues more efficiently, but they also introduce the risk of customers abandoning their efforts if the self-service options fall short [12]. High deflection rates (60%+) can deliver maximum cost savings but require precision to avoid negative outcomes like poor customer satisfaction when support feels overly automated or inaccessible [5].
Here’s a breakdown of how deflection levels influence key operational metrics:
| Deflection Level | Resolution Time Impact | Cost Savings | CSAT Risk | Operational Focus |
|---|---|---|---|---|
| Low (10–25%) | High (agent-dependent queues) | Minimal | Low (high human touch) | Scaling headcount to meet ticket volume |
| Medium (30–50%) | Improved (routine issues solved instantly) | Moderate | Low/Medium | Optimizing knowledge base for common FAQs |
| High (60%+) | Near-zero for simple issues; potentially higher for complex tickets | Maximum | High (if forced or inaccurate) | AI-agentic workflows and automated context gathering |
The key to success lies in balancing what experts refer to as the "Success Trifecta": Deflection Rate, Resolution Rate (did the AI or self-service actually solve the issue?), and CSAT [5]. For example, a 90% deflection rate sounds impressive, but if only 30% of users actually find answers, it signals a potential retention problem [5]. Additionally, in Tier 2 or Tier 3 support, even effective deflection might not eliminate delays caused by the need to gather more context for resolving complex issues [2].
Strategies to Improve Both Metrics
Improving both deflection rates and resolution times requires a well-thought-out approach that integrates AI-powered tools effectively. Successful organizations tend to focus on three main areas: smarter self-service options, faster agent support, and consistent tracking of key metrics. Let’s break these down.
Increase Deflection with AI-Powered Knowledge Bases
AI-driven knowledge bases can deliver tailored content dynamically, helping customers find answers quickly. Advanced AI systems boast resolution accuracy rates as high as 97% and policy compliance close to 99% [16]. These capabilities lead to better customer outcomes and lower support costs.
Take Curology, for example. By leveraging Decagon AI agents, they cut customer support costs by over 65% [17]. These AI agents handle routine tasks – like password resets or billing updates – using Agent Operating Procedures (AOPs), which are step-by-step workflows enabling AI to execute actions directly within the system.
However, the effectiveness of AI deflection depends on the type of inquiry. For simple, repetitive tasks like order tracking or password resets, deflection rates often range from 80–90%. Moderately complex issues, such as billing or subscription management, see rates closer to 60–70% [17]. High-value or emotionally sensitive matters, though, are best handled by human agents to maintain trust.
"A high CSAT is possible when customers know upfront that they are interacting with a bot and are given a clear, easy path to a human agent if their issue is too complex." [17]
To get the most out of AI deflection, focus on keeping your knowledge base accurate and up-to-date. AI can help identify outdated or underperforming articles that need revisions [15]. Providing multilingual support also makes your resources accessible to a global audience [14][15]. And, of course, offering clear escalation paths ensures customers can reach human agents when needed [17].
Reduce Resolution Time with AI Case Summaries
When tickets escalate to human agents, AI can still play a crucial role by speeding up resolution times. AI-driven case summaries and intelligent routing ensure that agents start with all the context they need, cutting down on back-and-forth exchanges.
For instance, Retool integrated Risotto‘s conversational AI into their Slack-based ticketing system. By doing so, they reduced their average SLA resolution time from 2 days to less than 1 day [19]. The AI analyzed screenshots and error logs submitted by users, embedding valuable insights directly into case summaries.
"Risotto started answering complex product questions even I didn’t know off the top of my head… It was pulling insights from our own past Slack conversations, surfacing knowledge that would have otherwise been buried." – Phillip Rickett, VP of IT, Fundrise [19]
To maintain efficiency, use "living playbooks" that update in real time, creating a feedback loop for continuous improvement. Synchronizing AI-driven summaries and conversation logs with your ticketing system ensures a single source of truth [19]. Intelligent routing also plays a big role – directing complex issues to the right specialist based on expertise and past resolution data. High-performing AI agents, like Fin, achieve resolution rates averaging 65%, with some configurations reaching up to 93% [18].
Track Related Metrics to Maintain Balance
Balancing deflection rates and resolution times requires careful monitoring of metrics to avoid unintended consequences. The "Success Trifecta" – Deflection Rate, Resolution Rate, and Customer Satisfaction (CSAT) – is a common benchmark for B2B support teams [5]. High deflection numbers only matter if they reflect effective problem-solving, not customer frustration.
Grammarly offers a great example. Between April and September 2025, they integrated Forethought‘s AI platform, achieving an 87% deflection rate and a CSAT score of 4.2 out of 5 [20]. They also tracked whether deflected customers returned with the same issue – an indicator of whether automated solutions were effective [21].
"At Grammarly, delivering an intelligent and personalized customer experience is critical to our mission. Forethought’s multi-agent, omnichannel AI platform has transformed our support operations – achieving a deflection rate of 87%… and a CSAT score of 4.2." – Jakub Kepczynski, Head of Care, Grammarly [20]
Monitoring First Contact Resolution (FCR) ensures that speed improvements don’t come at the expense of quality [18][8]. Regular quality assurance checks on unresolved or escalated tickets can reveal content gaps or recurring issues [20][5]. Reviewing support tickets periodically also helps identify the most common customer questions, allowing teams to prioritize creating better help content [5].
Companies with containment rates above 70% can save millions, while those below 40% often face negative ROI and poor customer experiences [21]. Automated resolutions save between $5 and $15 per interaction compared to human-led support [21]. Striking the right balance is key – encourage self-service by making your knowledge base easy to find, but always leave the door open for customers to reach a human agent when needed [5].
Tools and AI Methods for Measuring and Improving Portal Metrics
Tracking deflection rates and resolution times effectively requires the right tools. To truly improve portal performance, it’s not just about measuring metrics – it’s about leveraging advanced AI tools that fine-tune both deflection and resolution processes. Today’s B2B support platforms are equipped with AI-powered analytics, providing actionable insights that help teams optimize these metrics simultaneously.
AI Deflection Detection and Insights
Traditional tracking methods often misinterpret abandoned sessions as successful deflections. For example, if a customer leaves after failing to find an answer, some systems still count this as "deflected", even though the customer left unsatisfied. AI-driven deflection tracking introduces "Resolution Rate with Verification", ensuring that the AI or knowledge base actually resolved the issue rather than just ending the interaction [10].
The difference between containment and resolution rates highlights where customers face challenges. For instance, if your containment rate is 75% but your resolution rate is only 45%, that 30% gap reflects customers who didn’t get the help they needed and abandoned the process [10]. Modern AI tools analyze conversation patterns, customer sentiment, and follow-up behavior to determine if self-service options were genuinely effective.
Here’s a compelling stat: for every $1 spent on AI-powered customer service, companies see an average return of $3.50 [22]. However, achieving that return hinges on accurate measurement. New AI tools can even track whether deflected customers return with the same issue – something many older systems fail to detect.
With these precise deflection insights, real-time monitoring takes support responsiveness to the next level.
Real-Time Monitoring with Predictive AI Metrics
Real-time monitoring allows teams to act quickly, reducing delays that can lead to First Contact Resolution (FCR) issues. AI-powered platforms now offer real-time monitoring with predictive CSAT (Customer Satisfaction), FCR detection, and SLA alerts, which help identify and address problems before they escalate.
Supportbench, for instance, includes AI Predictive CSAT and AI Predictive CES (Customer Effort Score) within its case management tools. These features predict customer satisfaction levels even before surveys are completed. The platform also uses AI First Contact Resolution detection, a historically tricky metric to measure, by analyzing patterns in case histories.
AI anomaly detection adds another layer of sophistication by accounting for seasonal trends and only flagging genuine deviations [23]. For example, if resolution times unexpectedly spike on a typically stable Tuesday afternoon, the system can correlate that anomaly with other data points, like increased CPU usage or error rates, to pinpoint the root cause faster than manual analysis [23].
Every 1% improvement in FCR translates to a 1% reduction in operating costs and a similar boost in customer satisfaction [10]. These predictive metrics, combined with real-time monitoring, empower teams to take immediate action when issues arise.
Dashboards for Tracking Deflection and Resolution Trends
Metrics only make sense in context. A 47% deflection rate could be great – or problematic – depending on your industry, customer demographics, and past performance. Well-designed dashboards provide targets, historical comparisons, and industry benchmarks, helping teams assess whether they’re hitting their goals [24][26].
Supportbench’s dashboards consolidate data from cases, knowledge bases, and customer interactions into a single, user-friendly interface. Teams can filter data by time frame, service type, or user role to pinpoint where self-service falls short or where complex cases are slowing down resolution [24][25].
Effective dashboards use visual hierarchies to make trends easy to spot. For example:
- Line charts can reveal how deflection rates change over time.
- Bar charts compare resolution performance across support tiers or agents.
- Progress gauges show how close current performance is to set targets.
- Meter gauges with color-coded bands (e.g., green for good, red for critical) highlight resolution times against SLA thresholds [26].
What’s more, AI-powered dashboards can now answer questions directly. A team member might ask, "Why did resolution time increase this week?" and receive a concise, AI-generated explanation [24]. This feature puts insights directly into the hands of non-technical staff, enabling faster, data-driven decisions without needing an analyst’s help.
Conclusion: Finding the Right Balance for Portal Success
Creating a successful portal hinges on understanding the interplay between deflection rate and resolution time. These metrics can’t stand alone – high deflection means little if customers leave frustrated, and quick resolutions fall short if they don’t fully address the problem.
Support teams need to resolve issues swiftly but without compromising quality. Research highlights how moving from "satisfied" to "delighted" customers can increase revenue by 8% to 12% [9]. However, it’s crucial to avoid the pitfall of focusing too narrowly on metrics – this can lead to prioritizing numbers over genuine problem-solving [11]. Setting SMART goals (Specific, Measurable, Attainable, Realistic, Time-bound) ensures your metrics drive real progress rather than superficial gains [11].
Key Takeaways
Here are the main points to keep in mind:
- Track deflection rate and resolution time together to get a complete picture.
- Use AI-powered tools to confirm that deflected interactions actually resolve customer issues, rather than just cutting them short.
- Monitor additional metrics like Customer Effort Score (CES), Net Promoter Score (NPS), and First Contact Resolution (FCR) to ensure a well-rounded view of portal performance.
AI-driven automation can handle repetitive inquiries, freeing your team to focus on more complex challenges [9]. By leveraging technologies like NLP and Generative AI, portals can offer personalized self-service experiences that genuinely resolve issues [9]. Striking the right balance between automation and human support not only reduces costs but also enhances customer satisfaction, ensuring both metrics work in harmony.
FAQs
How do I tell real deflection from customer abandonment?
Real deflection occurs when customers successfully solve their problems on their own using tools like FAQs or AI chatbots, without needing to contact support. On the other hand, customer abandonment happens when customers give up before resolving their issue – like hanging up while waiting in a queue. To tell the difference, monitor self-service resolution rates and compare them to abandonment rates. Deflection reflects successful self-service, while abandonment signals unresolved problems.
What’s the best deflection target without hurting CSAT?
The best deflection target strikes a balance between a high self-service resolution rate and strong customer satisfaction. The goal is to empower customers to resolve issues on their own while still offering easy access to human support when necessary. While the exact target may vary depending on your industry and support objectives, the priority should always be creating a positive experience for your customers.
How should I report deflection and resolution time together?
To present deflection and resolution time effectively, treat them as two sides of the same coin. The deflection rate indicates the percentage of inquiries resolved through self-service options, while average resolution time measures how quickly escalated issues are handled. By using visual dashboards or combined reports, you can display these metrics side-by-side. This approach helps stakeholders evaluate the interplay between operational efficiency and the quality of resolutions, ensuring customer satisfaction remains a priority.