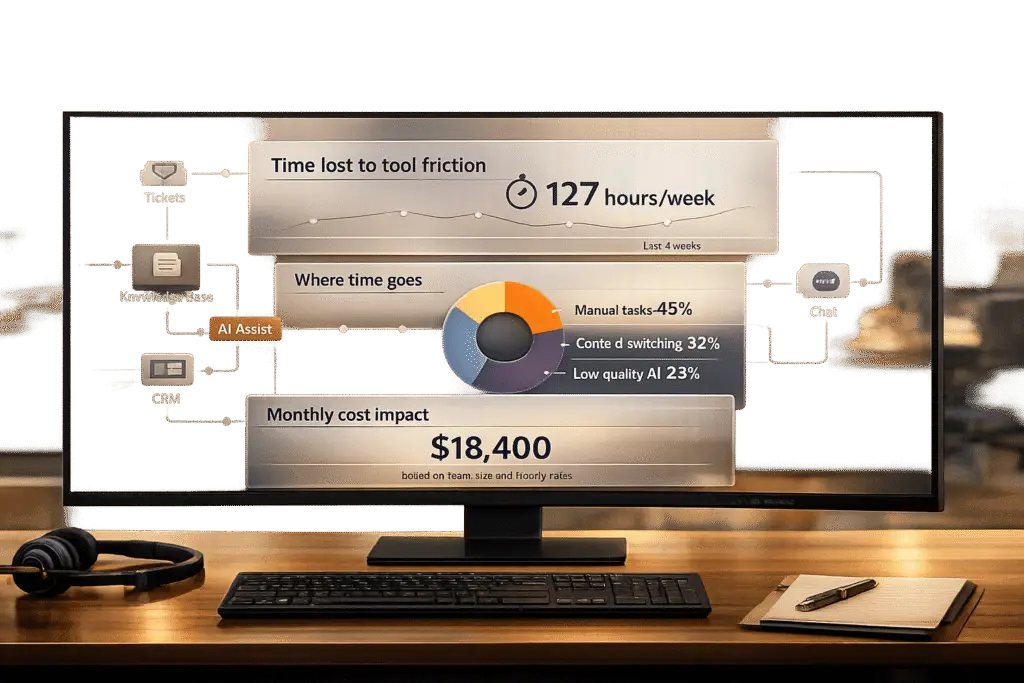
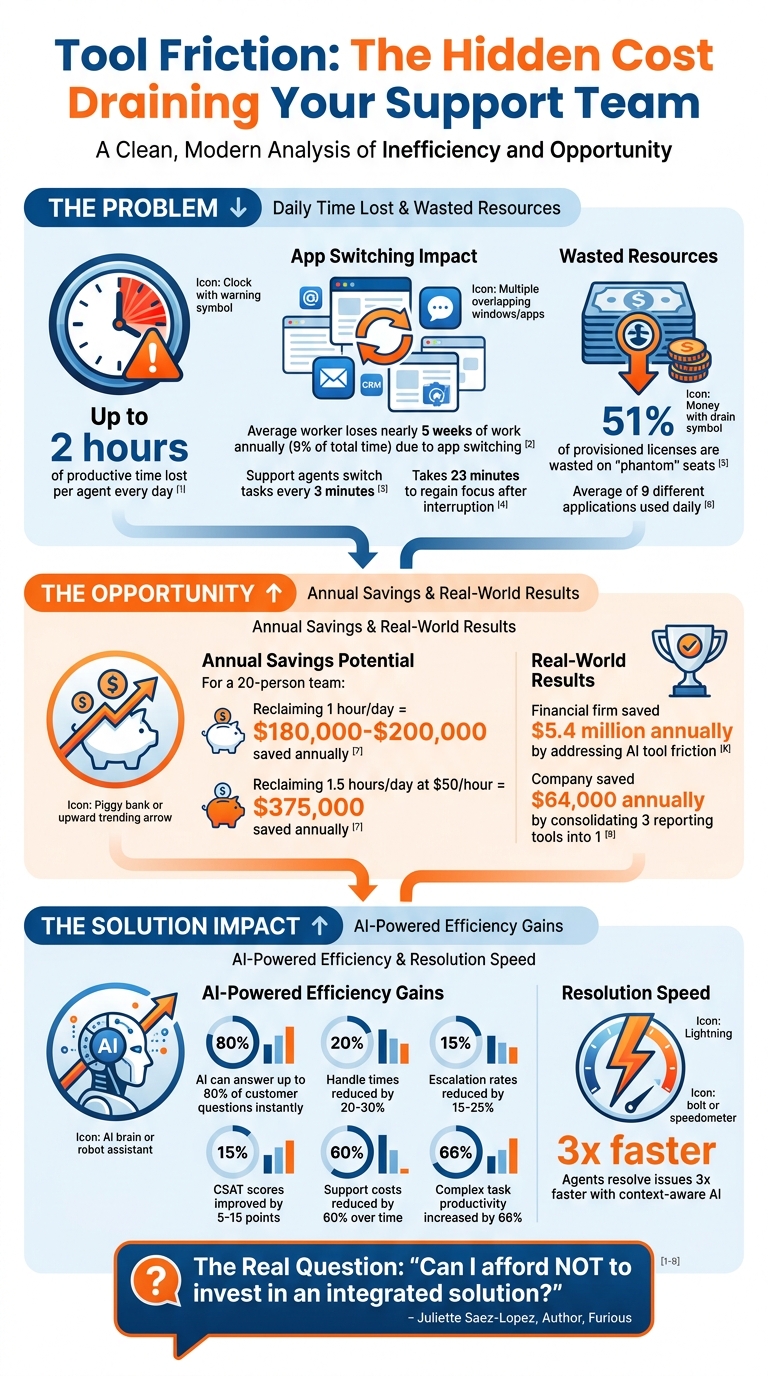
Your support team could be losing up to 2 hours of productive time per agent every day due to inefficient tools. This "tool friction" – caused by disconnected systems, repetitive manual tasks, and underperforming AI – drives up costs, overwhelms teams, and frustrates customers. For a 20-person team, even reclaiming one hour per day could save $180,000–$200,000 annually.
Here’s how to measure and reduce time lost to tool friction:
- Track time on tasks: Define the ideal workflow, compare it to actual processes, and identify delays or inefficiencies.
- Analyze workflow drop-offs: Use analytics to find abandoned tasks or bottlenecks in processes.
- Calculate costs: Multiply hours lost per agent by their fully-loaded hourly rate to quantify the financial impact.
- Address common issues: Focus on reducing manual data entry, fragmented customer information, and AI inefficiencies.
The Cost of Tool Friction in Support Teams: Key Statistics and Savings
How to Measure Time Lost to Tool Friction
This section lays out a practical method to identify and measure the time wasted due to tool friction in support workflows. Instead of relying on vague complaints about "slow systems", this approach helps quantify the seconds, minutes, or even hours lost each day.
Track Time Spent on Routine Support Tasks
Start by defining the "happy path" – the ideal workflow an agent should follow to resolve a ticket. Break down every step in the process, from logging in to updating the ticket’s status. For every click, scroll, or modal interaction, assign a one-second friction point. This "happy path" becomes your baseline for comparison with actual workflows.
For example, in December 2023, Lucid Software‘s UX Designer Leigh Lyman conducted a friction analysis of the Lucidchart payment page. The team identified 26 steps in the process and assigned friction points to each. By cutting the friction score from 26 to 19 – a 26.92% reduction – they boosted annual plan signups by 3.5% [1]. Lyman explained:
"Friction analysis… clarifies interaction delays. It helps people using your product get things done faster. It convinces stakeholders working alongside you of the severity of a problem" [1].
Support teams can apply the same strategy to ticket resolution workflows. Each delay – no matter how small – adds up. Compare the actual time spent on tasks to the baseline to uncover where agents lose time. Then, pinpoint where tasks break down or escalate, revealing areas of friction.
Find Workflow Drop-Offs and Escalation Points
Drop-offs occur when agents abandon tasks mid-process, often because the workflow is too complex or the tools don’t meet their needs. Use analytics to measure how many agents start an action but fail to complete it. A sharp drop-off between two steps often signals tool friction [3].
Tools like session replays and heatmaps can help identify problem areas. For instance, repeated clicks on an unresponsive button or excessive back-and-forth navigation between screens are clear signs of friction [3].
To isolate delays, break down metrics like Time to First Response (TFR) into detailed stages: Created to Assigned, Assigned to First View, and First View to Response [7]. Instead of focusing only on averages, measure the 90th percentile (P90) of task completion times. As the Teammates.ai Editorial Team points out:
"If you report average TFR, you are measuring the wrong thing. Customers experience the tail, not the mean. The difference between ‘median 2 minutes’ and ‘P90 6 hours’ is the difference between stable retention and a silent churn leak" [7].
Once you’ve identified friction points, calculating their cost can illustrate their impact on your operations.
Calculate the Labor Costs of Friction
To determine the financial impact, multiply the total hours lost per agent by the fully-loaded labor cost (including salary, benefits, and overhead). Then, scale this across your team for the year [2].
For instance, if each agent loses 1.5 hours daily, and the fully-loaded hourly rate is $50, a 20-person team working 250 days a year incurs an annual loss of $375,000. Use this formula:
(Hours of lost focus per day) × (Hourly labor rate) × (Number of employees) × (Working days per year) [4].
In January 2025, a financial firm used FOUNT to analyze its IT division’s AI tool adoption. Despite implementing chatbots and code assistants, productivity didn’t improve. The analysis revealed that junior developers faced delays because chatbots lacked access to critical data, and AI-generated code required manual reviews. By addressing these friction points, the firm saved $5.4 million annually [2]. David Gill, VP and Enterprise HR Officer at Northwell Health, noted:
"That data pinpointed exactly where bottlenecks occur, which segments have the most challenges, and the relative severity of each friction point. This clarity has been invaluable in helping us to prioritize our improvements to maximize impact" [2].
sbb-itb-e60d259
Common Tool Friction Scenarios in B2B Support
Now that you’ve learned how to measure friction, it’s important to understand where it tends to surface the most. These issues can eat away at your team’s productivity, costing hours every week. Below are three common examples of inefficiencies that plague support teams.
Disconnected Systems and Manual Data Entry
When support tools don’t integrate, agents waste time manually transferring information between systems. Research shows that the average worker loses nearly 5 weeks of work annually – about 9% of their total time – due to inefficiencies caused by switching between applications [8]. On top of that, support agents switch tasks every three minutes [8], and it can take 23 minutes to regain focus after an interruption [8].
Take Tim, the Manager of Customer Support at Cars Commerce (Cars.com), as an example. In April 2026, Tim shared how his team struggles with duplicate tickets. Dealers often contact support through multiple channels, and automated "ticket received" messages from other vendors generate redundant cases. Senior team members have to clear these duplicate tickets so frontline agents can focus on actual issues [6]. As Tim explained:
"The challenge is that duplicate tickets rarely feel expensive in the moment. They’re common, so they get treated as background noise rather than a measurable cost" [6].
Even seemingly minor duplicate tickets take 1 to 3 minutes each to identify, read, and merge [6]. Over time, this adds up, highlighting the need for better workflows to eliminate these inefficiencies.
Another related issue is fragmented customer data across multiple platforms.
Fragmented Customer Context Across Platforms
When customer information is spread across different systems, agents often have to ask customers to repeat themselves or spend time searching for details that already exist. This constant toggling between tools disrupts workflows [8]. As a result, handling times increase, escalation rates climb, and agents face a higher risk of errors and burnout due to mental strain [8].
This isn’t just about wasted time – it’s about the mental effort required to juggle incomplete information. Agents are forced to keep multiple versions of the same problem in their minds, which adds to their cognitive load [6]. Eric Bodnar from PixieBrix summed it up perfectly:
"Context switching is quietly killing productivity, driving up costs, and contributing to burnout" [8].
Pinpointing where this fragmentation happens allows teams to streamline data access and reduce unnecessary mental fatigue.
AI Tools Without Context Awareness
AI tools are supposed to save time, but when they lack access to full case histories or customer data, they can actually create more work. Without the right context, AI outputs often require manual corrections, making automated processes more of a burden than a help [2].
Incomplete or irrelevant AI suggestions force agents to step in, slowing down workflows instead of speeding them up. However, using context-aware AI tools can significantly improve efficiency. These tools have been shown to cut handle times by 20% to 30% and reduce escalation rates by 15% to 25% [8]. On top of that, companies that adopt context-aware AI often see customer satisfaction (CSAT) scores improve by 5 to 15 points [8].
Identifying AI tools that lack proper context is a critical step in prioritizing integrations that can boost productivity and enhance the customer experience.
How to Reduce Tool Friction in Support Workflows
Once you’ve pinpointed areas of friction and assessed their impact, the next step is to address them. Using the measurable insights from earlier analyses, the strategies below focus on minimizing friction while demonstrating tangible time and cost savings.
Consolidate Systems to Improve Data Connectivity
Juggling 6–12 disconnected platforms forces agents into tedious manual tasks that slow everything down[9]. These fragmented workflows can quickly become a major obstacle.
The solution? Bring together knowledge, support, and enablement tools into a single unified platform[9]. Centralizing content, projects, and customer data ensures everything is accessible in one place. With a unified inbox that supports both internal collaboration and external customer communication, AI can tap into the same knowledge base for consistent and efficient responses[9]. This eliminates redundant data retrieval and streamlines operations.
Here’s the payoff: AI-driven platforms pulling from a single source of truth can instantly answer up to 80% of customer questions[9]. Agents equipped with context-aware suggestions can resolve issues three times faster, cutting support costs by 60% over time[9]. Every resolved issue also strengthens the system, enhancing the overall data framework.
Once systems are consolidated, AI-powered automation can take efficiency to the next level.
Use AI-Driven Support Features
AI thrives when it has full access to data. This enables tools to handle tasks like automated case summaries, knowledge base suggestions, and dynamic SLAs, significantly reducing the need for manual input. For example, AI assistants can suggest ticket responses the moment they arrive, saving agents from repetitive research[9]. AI can also automate case prioritization, assign issue types, and tag tickets, further cutting down on manual categorization.
When implemented effectively, AI tools can boost productivity for complex office tasks by as much as 66%[2].
The key to long-term success, however, lies in continuously refining these workflows.
Monitor and Improve Workflows Over Time
Eliminating friction isn’t a one-and-done task – it requires ongoing attention. Conducting quarterly audits helps support teams stay aligned with evolving tools and vendor updates[5]. Regular evaluations and pulse surveys can measure tool effectiveness, ensuring they remain optimized for core processes. Assigning tools an Impact Score (1–5) based on their importance can also prevent the removal of essential systems[5].
For instance, in early 2026, a 120-person company audited their 18 software subscriptions. By consolidating three reporting tools into one BI platform, they saved $64,000 annually and reduced reporting labor by 0.8 FTE. Additionally, they negotiated seat pooling for their CRM, cutting variable costs by 15%[5].
Conclusion
Tool friction is a silent drain on your support team’s resources – eating away at time, budget, and morale. When agents are forced to juggle an average of nine different applications daily, it’s no surprise that they lose 23 minutes regaining focus after each context switch. Add to that the 51% of provisioned licenses wasted on "phantom" seats, and the costs quickly pile up[4]. For a 20-person team, reclaiming just one hour of focus per day could translate into $180,000–$200,000 in annual productivity gains[4].
The solution? Start by measuring the friction. Audit license usage, track the time spent on manual data re-entry, and pinpoint duplicated work. By translating inefficiencies into financial and operational metrics, you create a clear picture of where your team is losing ground. These numbers don’t just highlight problems – they make a compelling case for change.
"The real question is no longer ‘Can I afford to invest in an integrated solution?’ but rather ‘Can I afford NOT to?’" – Juliette Saez-Lopez, Author, Furious[4]
Streamlining tools into a unified platform can eliminate repetitive IT tasks that don’t add value for customers. Even better, AI-powered solutions built on a single source of truth can resolve up to 80% of questions instantly and reduce support costs by 60% over time[9]. The benefits are real – faster resolutions, lower overhead, and teams freed up to focus on what truly matters.
FAQs
What’s the fastest way to measure tool friction without new software?
The easiest way to gauge tool friction without investing in additional software is by conducting a focused audit of your existing tools and workflows. Set aside just 90 minutes each month to pinpoint issues like underused tools, redundancies, and inefficiencies.
Here’s how to approach it:
- Review support channels and workflows: Look for delays, duplicated efforts, or bottlenecks in processes.
- Examine ticket handoffs: Analyze how tickets move through the system to identify areas where context is lost or rework occurs.
- Map ticket journeys: Visualizing the flow of tickets can uncover hidden friction points and help you see where time is being wasted.
This method offers a straightforward, low-cost way to spot inefficiencies and start reducing friction in your tools and processes.
How do I calculate the real dollar cost of time lost to tool friction?
To figure out how much time lost to tool friction is costing you, start with your cost per ticket. You can calculate this by dividing your total support costs – this includes agent salaries, overhead, and tool expenses – by the number of tickets handled. Next, estimate inefficiencies by tracking the extra time agents spend dealing with delays or redundancies. Take that wasted time, multiply it by your agents’ hourly wages, and then scale it across your total ticket volume. This will give you the overall financial impact in dollars.
Which support workflow steps usually create the most tool friction?
When it comes to tool-related challenges, the biggest headaches often arise during handoffs and rework. Think about situations like tickets bouncing back and forth between teams, customers having to repeat their issues multiple times, or triage processes that lack consistency. These delays usually happen because important context gets lost along the way, forcing agents to re-explain problems or manually shuffle tickets to the right place.
On top of that, manual tasks like digging through spreadsheets or constantly switching between tools that don’t connect well can add even more frustration. The absence of automation and proper system integrations only makes these inefficiencies worse, slowing everything down and creating unnecessary friction.