When your support team is overwhelmed, unrealistic SLAs (service level agreements) can hurt both customer satisfaction and agent morale. Instead of sticking to aggressive targets that don’t match your team’s capacity, you need to recalibrate based on data, severity levels, and achievable goals. Here’s how:
- Audit Capacity: Measure ticket volume and agent workload to identify bottlenecks.
- Align SLAs with Severity: Prioritize issues based on their impact (e.g., outages get faster responses than minor bugs).
- Simplify SLA Tiers: Avoid overcomplicating with too many factors like customer tiers or channels.
- Use Data for Targets: Base response times on what your team can realistically handle, using historical performance data.
- Track Team Health: Monitor workload, backlog, and stress levels to prevent burnout.
- Test Before Committing: Run a 30–60 day pilot to validate new SLAs before rolling them out to customers.
- Communicate Clearly: Set transparent expectations with customers about severity levels and response timelines.
This approach ensures SLAs are realistic, manageable, and designed to protect both your team and customer satisfaction.
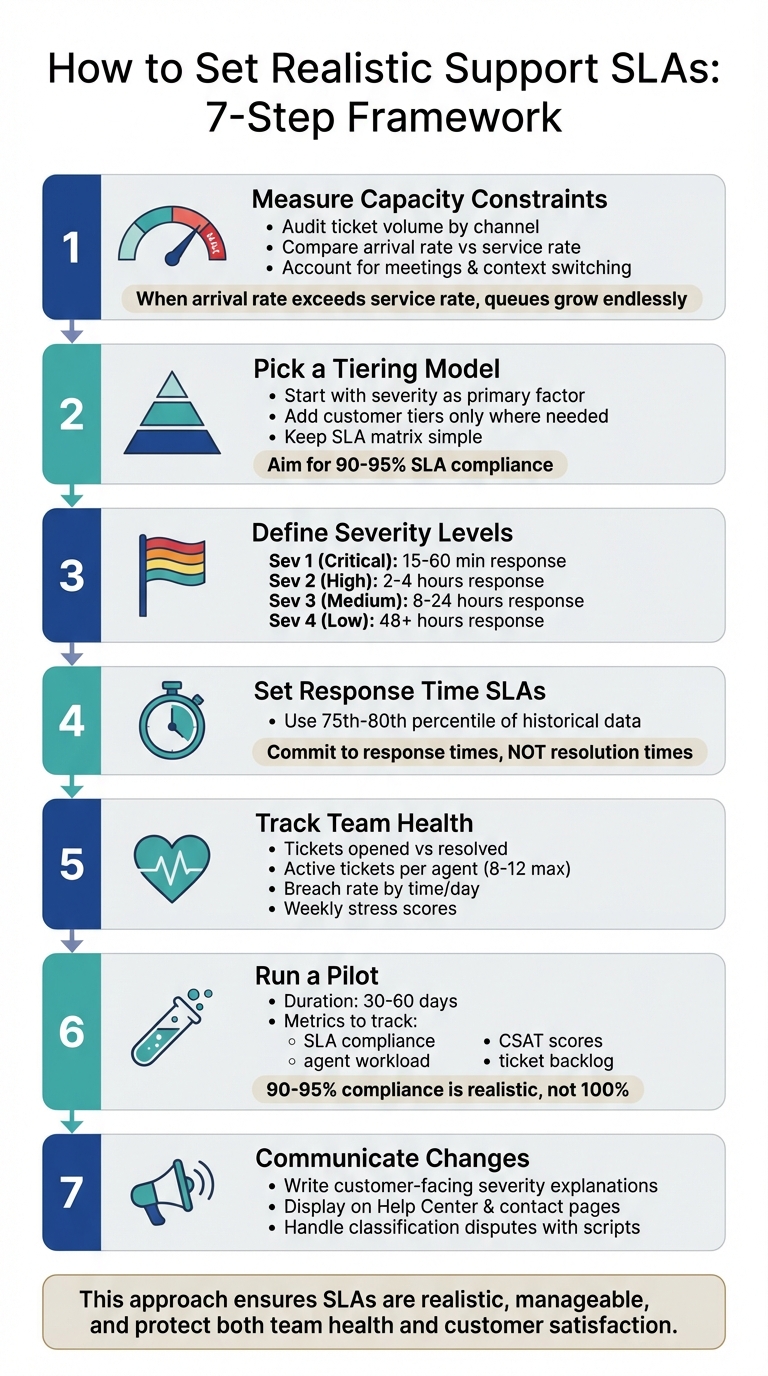
7-Step Framework for Setting Realistic Support SLAs at Capacity
Step 1: Measure Your Actual Capacity Constraints
To set support SLAs that align with your team’s reality, you first need a clear picture of where your bottlenecks lie. This involves analyzing data on ticket volume, agent capacity, and non-ticket responsibilities like meetings, training, and follow-ups. This groundwork ensures your SLAs reflect the actual workload your team is handling.
Audit Ticket Volume by Channel and Time
Start by breaking down incoming tickets by channel – whether it’s email, chat, Slack, or phone – and by time of day. Not all channels demand the same level of effort. For instance, real-time channels like Slack require immediate attention and frequent task-switching, while email allows for batch processing. By generating hourly and daily ticket reports, you can identify when ticket surges occur and where staffing gaps might exist.
Use category tags to pinpoint which products or issues drive the most tickets. For example, if 40% of your tickets stem from a single integration issue, it might be time to improve documentation or escalate the problem for a product fix. The goal is to identify high-demand areas so you can allocate resources more effectively.
Compare Arrival Rate to Service Rate
This is where queueing theory comes into play. Your arrival rate is the number of tickets coming in per hour, while your service rate is how many tickets your team can resolve in the same timeframe. To calculate arrival rate, divide the total number of tickets by the observation time. For example, if you receive 50 tickets over 10 hours, your arrival rate is 5 tickets per hour. For service rate, measure the average time an agent spends actively resolving a ticket. If the average handle time is 12 minutes, your service rate is 5 tickets per hour per agent.
When your arrival rate exceeds your service rate, your ticket queue will grow endlessly. Even if you’re close to capacity – say, operating at 85% – wait times don’t just increase slightly; they spike exponentially as you approach your limit.
"When arrival rate exceeds service rate, either the queue ‘explodes’ (keeps growing) or customers balk… or renege." – prubin, Operations Research Expert
Keep an eye on the trend lines for "tickets opened vs. tickets solved." In a balanced system, these lines should run parallel. If the number of solved tickets consistently lags behind opened tickets, it’s a sign that your capacity is insufficient. No SLA adjustment can fix that without addressing the underlying capacity issues.
Account for Meetings and Context Switching
Agents don’t spend all their time resolving tickets. They also have non-ticket responsibilities like team standups, 1:1s, training sessions, and internal communications. Add to that the "After Conversation Work" (ACW) – tasks like updating notes or logging follow-ups after closing a ticket.
To get a clear picture of your team’s capacity, calculate agent utilization as the ratio of support task time to total work hours. If your team is operating at 90% or higher utilization, they have no buffer for unexpected surges or complex issues. Include non-ticket activities in your calculations to understand how much "available" service time remains. For instance, if agents spend 2 hours a day in meetings, that’s 25% of their capacity gone before they even start working on tickets.
Track "Agent Work Time", which includes the total time a ticket spends in "New" and "Open" statuses, excluding "Pending" or "On-hold". This gives you a clearer view of the actual effort required per ticket and helps identify when context switching or meeting overload is eating into your team’s productivity.
Step 2: Pick a Tiering Model You Can Manage
After identifying your capacity limits, the next step is to decide what factors will shape your SLA targets. A common pitfall is overcomplicating the process with a matrix that combines severity, customer tier, and communication channels into countless variations. This can lead to confusion, missed deadlines, and stress for your team. Instead, start with a straightforward framework, adding complexity only when it clearly benefits your business. A simple foundation makes it easier to refine and optimize later.
Start with Severity as Your Primary Factor
Severity should be the cornerstone of your SLA framework because it objectively measures the impact of an issue on the customer’s business. For instance, a major system outage affecting all users requires a faster response than a minor design flaw, no matter who reports it. By focusing on severity, you can align your response time with the actual urgency of the issue.
"The severity label is used to indicate the actual or potential impact of a security incident. This label is the single source of truth for determining the required response urgency, communication plan, and resource allocation." – GitLab Handbook
Define severity levels using clear, measurable criteria like the number of affected users, availability of workarounds, impact on revenue-generating activities, and data integrity. For example:
- Severity 1: Complete system outage with no workaround.
- Severity 4: Minor cosmetic issue with no business impact.
This objective system avoids the "Priority Paradox", where everything is labeled urgent, making prioritization meaningless.
To keep things manageable, choose one resolution time metric – such as Requester Wait Time, Agent Work Time, or Total Resolution Time. Using multiple metrics can create unnecessary complexity and confusion for your team.
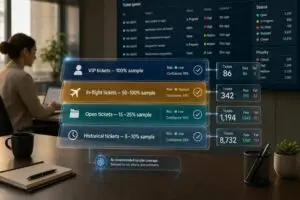
Add Customer Tiers Only Where It Makes Sense
Customer tiers should act as a secondary layer, applied only when there’s a clear difference in business value or resource requirements. If two issues are handled the same way, they should share the same SLA to keep things simple.
A good approach is a multilevel SLA structure, where a general SLA applies to all users, with additional agreements for high-value accounts. For instance, Enterprise customers might get faster responses for Severity 1 and 2 issues, but the same response times as other users for lower-severity issues. This keeps the framework manageable while rewarding premium customers.
Automate VIP ticket handling. Tickets from Enterprise or Premium customers should bypass standard queues and go directly to senior agents or a dedicated team. If VIP tickets sit in the same queue as others, the tiering system loses its purpose. Use percentage-based alerts (e.g., escalate at 25%, 75%, and 90% of SLA time used) instead of fixed reminders. This ensures automation works across different severity levels and customer tiers.
Keep Your SLA Matrix Simple
Once you’ve defined severity and tiering, aim for simplicity in your overall SLA matrix. Avoid combining severity, customer tier, and communication channels into an overly complicated system. Each additional variable increases the need for monitoring, escalation, and resource planning.
"An overambitious SLA with ridiculous requirements and benchmarks will lead to failure." – Stella Inabo, Contributing Writer
Strive for 90–95% SLA compliance. Achieving 100% is unrealistic due to factors outside your control, like unexpected ticket surges or complex edge cases. Building a 5–10% buffer allows your team to handle surprises without constant pressure.
Before committing to any SLA in a customer contract, test it internally for 30–60 days. This trial period helps you see if your team can consistently meet the targets without burning out. If your team is already operating at 90% capacity, adding stricter SLAs without additional resources will lead to missed deadlines and staff turnover. Use internal "Group SLAs" or Operational Level Agreements to track hand-offs between teams (e.g., Support to Engineering) and identify bottlenecks before making promises to customers.
Step 3: Define Clear Severity Levels and Update Schedules
Once your tiering model is in place, the next step is to define severity levels that reflect the actual impact of issues. Avoid using vague terms – stick to measurable criteria that help classify problems objectively. This approach ensures you can set precise update schedules that match the severity of each issue.
Establish Severity Definitions and Examples
Start by analyzing 30–60 days of ticket data. Group issues by type, such as product bugs, billing problems, or account access challenges. Use this data to create four well-defined severity levels. Each level should include a clear explanation, examples specific to B2B SaaS, and a target response time.
Here’s an example of standardized severity levels:
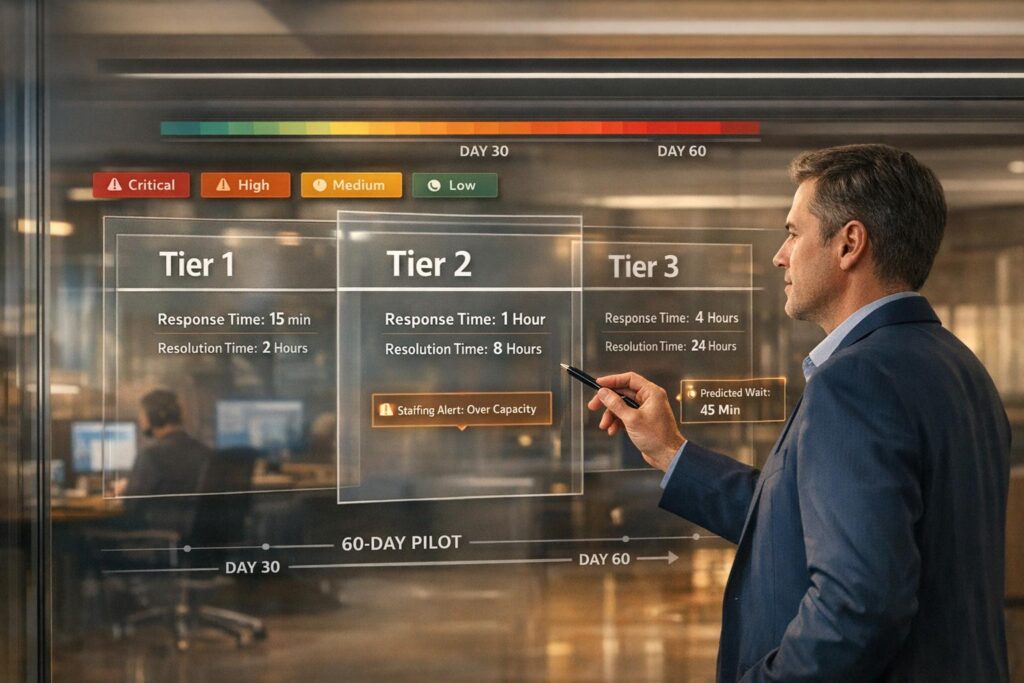
- Severity 1 (Critical): These are the most urgent issues, like production outages, security breaches, or a complete loss of service. For instance, if users are unable to log in due to an authentication failure, it qualifies as a Sev 1. Response time should be within 15–60 minutes, with updates every 30–60 minutes.
- Severity 2 (High): Issues that significantly disrupt functionality, such as billing failures or account access problems, fall into this category. An example would be a broken checkout process preventing new sign-ups. Aim for a response within 2–4 hours, with updates every 4–8 business hours.
- Severity 3 (Medium): These include partial functionality issues, onboarding questions, or non-critical bugs. For example, if a feature is functional but confusing due to a poor user interface, it would be classified as Sev 3. Response times should be within 8–24 hours, with daily updates.
- Severity 4 (Low): This level is for general support inquiries, feature requests, or minor issues like typos in documentation. Response times can extend to 48+ hours, with updates every 2–3 days or upon resolution.
Set Update Frequency by Severity
While response times are crucial, keeping customers informed throughout the resolution process is equally important. Periodic Update SLAs establish a consistent communication rhythm, providing reassurance during lengthy investigations.
Configure your helpdesk to send alerts at 25%, 75%, and 90% of the SLA period instead of relying on fixed intervals. For example, with a Sev 1 ticket that has a 1-hour update target, alerts would trigger at 15 minutes, 45 minutes, and 54 minutes. Similarly, for a Sev 3 ticket with a 24-hour update target, alerts might occur at 6 hours, 18 hours, and approximately 21.6 hours.
Additionally, ensure the update clock pauses when a ticket is marked as "Waiting on Customer" or "Waiting on Third Party." This way, only the time your team can control is measured. Use Calendar Hours (24/7) for critical issues, while lower-severity tickets should follow Business Hours to avoid penalizing agents for delays outside normal working times.
Step 4: Set Response Time SLAs Using Your Own Data
Using the insights from your capacity audit, establish your SLA targets based on historical response data. Keep in mind that averages can be deceptive – just a few quick responses can distort the numbers. For instance, in one dataset, the average response time was calculated as 6 hours and 48 minutes, yet 60% of customers experienced delays beyond that timeframe.
Use the 75th Percentile Method
Start by gathering 30–60 days of historical response time data from your helpdesk. Plot this data on a histogram to visually understand how response times are distributed across all tickets. Focus on the 75th to 80th percentile range – this represents the response time frame in which 75-80% of your customers are currently served. This range will serve as your baseline SLA target.
Here’s an example: If 80% of your customers receive a response within 8 hours, then 8 hours becomes a reasonable starting point for your SLA. This approach ensures you’re not overpromising but instead formalizing what you’re already achieving for the majority of customers. To account for unexpected challenges, aim for 90-95% achievement rates.
Once you’ve set this baseline, refine it gradually. For instance, reduce the target from 8 hours to 7.5 hours over time. Avoid making drastic shifts – like cutting the target from 6 hours to 1 hour – as this can undermine trust. Additionally, configure your helpdesk to flag tickets once they hit 75% of their SLA threshold. This allows your team to step in proactively and prevent breaches.
With these targets in place, shift your focus to committing exclusively to response times.
Commit to Response Times, Not Resolution Times
Building on your percentile analysis, it’s smarter to commit to response time SLAs rather than resolution times. Why? Your team has direct control over response times, but resolution times often depend on external variables like issue complexity or third-party involvement. A response time SLA ensures that customers feel acknowledged promptly, addressing one of the main causes of dissatisfaction: feeling ignored.
"An SLA is a clearer indicator of whether customers are receiving poor service. You set a baseline for your overall level of service and provide that level of service for as many customers as possible." – Geckoboard
Instead of locking yourself into rigid resolution times in contracts, focus on response time SLAs and treat resolution timelines as flexible internal goals. For instance, your policy could state: "We respond to Sev 1 issues within 1 hour and provide updates every hour until the issue is resolved. Resolution generally occurs within 4-8 business hours, depending on the complexity." This approach sets clear expectations while avoiding unmanageable contractual commitments.
sbb-itb-e60d259
Step 5: Track Team Health to Prevent Burnout
Creating realistic SLAs helps balance customer expectations with agent well-being. But no SLA adjustment can fix a team that’s stretched too thin. To truly support your agents and maintain strong customer outcomes, you need to monitor team health metrics alongside response time data. These metrics act as early warning signs, giving you the chance to step in before burnout takes hold. Let’s dive into the key indicators to watch.
Measure Key Burnout Indicators
In addition to tracking capacity metrics, it’s crucial to keep an eye on stress indicators for your team. Start by comparing the number of tickets opened versus resolved each week. Ideally, these numbers should stay aligned. If new tickets consistently outpace resolutions, it’s a sign that your team is understaffed – something no process tweak can resolve.
Another critical metric is the current active ticket count per agent – the number of tickets each agent is handling at any given moment. This provides a clearer picture than a simple round-robin system, which doesn’t account for individual workloads. Set a maximum limit for active tickets (commonly 8–12 per agent, depending on ticket complexity). Once an agent hits their limit, new tickets should automatically redirect to others on the team.
You should also track your breach rate by time and day to identify specific coverage gaps. For example, if SLA breaches frequently occur between 2–4 PM on Tuesdays, a simple schedule adjustment – like shifting one agent’s hours – could solve the issue without adding more staff. Be mindful of after-hours load as well. SLA timers running during off-hours can create "false breaches", which undermine trust in your metrics.
Finally, incorporate a weekly stress score into your one-on-one meetings. Ask agents to rate their workload on a scale from 1 to 10, and monitor the trends. If scores consistently hit 8 or higher, it’s a clear signal that burnout is on the horizon.
Show Leadership the Early Warning Signs
Once you’ve identified these early warning metrics, it’s essential to present them to leadership in a way that drives action. Frame the data as risk mitigation, not complaints. Highlight how these metrics serve as leading indicators that safeguard customer satisfaction and long-term profitability. Research shows that companies fostering supportive work environments see better quality, higher retention rates, and stronger profits.
One key metric to share is the tickets at risk count – these are tickets nearing their SLA deadlines but not yet breached. This serves as a powerful early warning system. Use breach clusters to pinpoint specific gaps in coverage, demonstrating that small adjustments, like shifting schedules, can address issues without major staffing changes. If backlogs are growing, present them as capacity constraints that, if ignored, could harm customer satisfaction and retention.
"Burnout is primarily a consequence of certain working conditions, not an individual’s personality traits." – Laschinger et al.
This approach ties team health metrics to broader business goals. For example, Continental Stock Transfer & Trust boosted their SLA adherence from 70–80% to 99% by implementing real-time monitoring of response times and workload distribution. They succeeded by treating team capacity as a strategic factor rather than a staffing complaint. Use this type of data to make your case: healthy teams are essential for sustainable operations. Whether it’s adjusting SLAs, increasing staffing, or improving automation, the numbers will guide leadership toward the right decision.
Step 6: Run a Pilot and Get Internal Approval
Now that you’ve collected the data, defined severity levels, and pinpointed team health risks, it’s time to test your revised SLAs. This step takes your earlier capacity and severity assessments and puts them into action, but on a smaller scale. The goal is to gather evidence that supports these changes while minimizing any potential disruptions to customer satisfaction. Think of it as a trial run to ensure long-term success.
Design a 30–60 Day Pilot with Clear Metrics
Using the insights you’ve already gathered, run a controlled pilot to test your proposed SLAs. Start by treating these SLAs as internal goals before committing to them externally with customers. To set a baseline, analyze metrics from the past 30–60 days of ticket data. For instance, if your current average response time is six hours, setting a one-hour SLA right away will likely lead to failure.
Instead, aim for incremental progress. If your team averages five-hour response times, begin by extending the SLA target to six hours. From there, gradually tighten the target as performance improves. Be sure to define clear entry and exit criteria for the pilot, keeping operational realities in mind.
Throughout the pilot, monitor both customer outcomes and team health. Key customer metrics include SLA compliance rates, first response times, CSAT scores, and first-contact resolution rates. On the team side, track agent workload, ticket backlog, breach rates by time of day, and tickets at risk. For example, Continental Stock Transfer & Trust implemented real-time SLA tracking and automated routing in 2025, boosting SLA adherence from 70–80% to 99% and increasing response completion rates by over 50%.
To identify and address root causes of SLA breaches, conduct weekly audits. Break down breaches into categories like "unassigned too long", "waiting on internal team", or "agent overloaded". If most breaches fall into the "unassigned too long" category, the issue might be staffing or routing, not agent performance.
Set realistic compliance targets of 90–95%, rather than aiming for perfection. Unexpected events like system outages or sudden surges in demand can make 100% compliance unrealistic. For example, Noble Schools achieved 100% compliance with their two-business-day response SLA in 2025 by leveraging real-time analytics for personalized coaching, proving that achievable goals lead to success.
Frame the Change as Protecting Long-Term Outcomes
When presenting these changes to leadership, avoid framing them as a need to "slow down." Instead, position the adjustments as a way to ensure sustainable and reliable service. Overly ambitious SLAs can cause agents to ignore breaches, which undermines the system’s purpose as a decision-making tool.
"If you’ve ever seen an SLA breach and ignored it, you probably did the right thing… Once that happens, SLAs stop guiding day-to-day decisions." – Ritu John, Hiver
Here’s an example of how you might present this to stakeholders:
"Our customer outcomes are strong – retention and CSAT scores are solid – but the current workload is putting a strain on the team. We propose adjusting SLAs to align with actual capacity, monitoring both customer outcomes and team health over the next 30–60 days. If customer outcomes decline, we’ll explore additional staffing or process improvements as the next step."
Highlight the "Tickets at Risk" metric – tickets approaching their SLA deadlines but not yet breached. This proactive metric helps leadership see where targeted interventions can prevent failures. By analyzing patterns in breaches, you can identify specific gaps, such as coverage issues, and demonstrate how small adjustments (like schedule changes) might solve the problem without significant staffing increases.
Emphasize that this approach is about managing risk, not lowering standards.
"An overambitious SLA with ridiculous requirements and benchmarks will lead to failure." – Stella Inabo, Zendesk
Make it clear that realistic SLAs reveal genuine challenges – like staffing shortages or process inefficiencies – rather than creating false alarms. For instance, Kiwi.com‘s partner operations team introduced a 24-hour internal SLA in 2025, using automated routing and clear ownership markers to achieve a 100% success rate on internal targets while managing over 1,500 critical emails each month.
Finally, stress the importance of predictability over speed. Customers value consistent, dependable service more than sporadic bursts of rapid response. The goal isn’t to slow down support but to create a system that delivers reliability while safeguarding the well-being of the team behind it.
| Pilot Metric Category | Primary Metric | What It Tells Leadership |
|---|---|---|
| Customer Outcome | SLA Compliance Rate | Whether new targets are realistic |
| Customer Outcome | CSAT Score | How longer SLAs affect customer sentiment |
| Team Health | Agent Workload | Whether the new model reduces stress |
| Team Health | Ticket Backlog | Whether the team can keep up with demand |
| Operational | Breach Rate by Hour | When additional staffing may be needed |
Step 7: Explain SLA Changes to Customers
When introducing new SLAs, clear communication with customers is essential. Explaining how severity levels work – and why they are structured this way – helps build trust and reduces misunderstandings when response times don’t match a customer’s immediate expectations. As outlined in Step 3, your severity framework now needs to be translated into customer-friendly language that sets realistic expectations while aligning with your operational capabilities.
Write Customer-Facing Severity Explanations
Start by drafting severity definitions that are clear, specific, and include precise timeframes. Avoid vague terms like "immediately" or "as soon as possible." Instead, use measurable timeframes such as "within 4 business hours" or "by the next business day". A HubSpot survey revealed that 90% of customers value an "immediate" response, with 60% defining "immediate" as within 10 minutes. By using concrete terms, you can manage these high expectations effectively.
Your severity guide should explain the impact of each level, provide real-world examples, and outline response times. For instance, describe a Sev 1 issue as "Production is down with no workaround: response within 1 business hour and updates every 2 hours." A Sev 3 issue could be defined as "Minor problem with a workaround available: response within 8 business hours."
Ensure these definitions are easily accessible by displaying them prominently on your Help Center, "Contact Us" page, live chat widget, and even in email signatures. For example, include business hours in your website header and use chat widgets to clarify response times, such as "Typically replies in a few hours." This visibility helps prevent confusion, like customers submitting tickets late on a Friday and expecting a resolution before Monday.
If your SLAs are based on business hours, make it clear that "3 days" includes weekends if the ticket is submitted on a Friday afternoon, even though actual work time might only be 8 hours. Also, briefly explain when the SLA clock pauses, such as when awaiting customer responses or during third-party investigations.
"When you’re transparent about your service, you build your credibility, and customers trust you more." – Christelle Agustin, Content Writer, Gorgias
These clear definitions lay the groundwork for addressing any disputes over severity classifications.
Handle Severity Classification Disputes
Even with clear severity definitions, disputes may arise when customers feel their issue deserves a higher priority. Equip your team with a standard script that references your published definitions and outlines an escalation process. For instance:
"I understand this issue is urgent for your team. Based on our severity definitions, we’ve classified this as Sev 2 because your system is still operational with a workaround. This means we’ll respond within 4 business hours and provide updates every 8 hours. If the workaround stops working, we can immediately escalate this to Sev 1."
If external factors, like vendor input, delay resolution, communicate the adjusted timeline: "This issue requires input from our vendor, which is beyond our standard SLA. We’ll provide daily updates and escalate internally to expedite the process."
Always offer a direct path to a supervisor or lead for further review if needed. This approach balances customer expectations with your operational realities while maintaining trust.
"When you miss an SLA deadline, acknowledge it quickly and communicate transparently with the customer. Let them know you’re aware of the delay, provide an updated timeline for resolution, and escalate the issue internally if needed." – Navya M, Content Marketer, Hiver
During busy periods, be upfront about longer wait times instead of trying to hide them. Use automated after-hours responses to set expectations immediately, such as: "Our team will be back at 9:00 AM EST. Your ticket has been logged as Sev 2 and will be reviewed first thing in the morning". This approach reduces unnecessary follow-ups and reassures customers while preserving their trust.
Conclusion: Your 7-Day Action Plan
Building realistic SLAs helps protect your team from burnout while maintaining customer trust. Achieving this balance requires analyzing real data, defining clear severity levels, and communicating any updates effectively. To turn this into action, here’s a practical 7-day checklist to guide you.
Week 1 Implementation Checklist
Days 1-2: Audit Your Data
Start by reviewing 30–60 days of ticket data, broken down by ticket type. Calculate the average response and resolution times for each severity level. Keep your SLA matrix manageable by limiting ticket categories to 5–8 types. Pinpoint the single hour with the highest breach rate – this will highlight when and where to adjust staffing.
Day 3: Draft Your SLA Matrix
Create a straightforward SLA matrix with four severity categories. Use the 75th percentile of your current performance as a baseline and set targets slightly tighter than these benchmarks. Include two tiers for each metric: a baseline goal (e.g., 95% of tickets resolved in under 8 hours) and a stretch goal (e.g., 50% resolved in under 7 hours). Keep in mind that aiming for 90% or higher compliance is realistic, but setting a 100% target can lead to unnecessary stress for your team.
Day 4: Configure System Rules
Update your ticketing system to reflect business hours, time zones, and holidays, ensuring SLA timers align with actual coverage. Add "pause" conditions for situations where tickets are waiting on customers or third-party vendors – delays outside your team’s control shouldn’t count against SLA metrics. Enable auto-assignment to minimize delays between ticket creation and agent ownership.
Day 5: Set Up Alerts and Automation
Implement a three-stage alert system to trigger notifications at 25%, 50%, and 75% of SLA thresholds. Build a real-time dashboard to track "at-risk" tickets. If any ticket category shows a breach rate higher than 10%, flag it immediately for process adjustments.
Day 6: Internal Review and Team Alignment
Share the proposed SLA matrix with your support agents and leadership to confirm benchmarks and targets. Present the changes as a way to ensure long-term success: "Our customer outcomes are strong (retention/CSAT), but the current workload is pushing the team too hard. By adjusting SLAs, we’ll monitor outcomes and team stress, and reassess in 30–60 days."
Day 7: Launch and Communicate
Roll out the new SLAs by publishing severity definitions and enabling automated after-hours responses. Track SLA compliance, breach patterns, and ticket ratios daily. Make your severity definitions easily accessible by posting them on your Help Center, "Contact Us" page, and email signatures. Monitor the pilot phase closely to address any issues as they arise.
"What gets measured gets done." – Stella Inabo, Contributing Writer, Zendesk
This week-long plan lays the groundwork for ongoing improvement and performance tracking. By acting swiftly and staying realistic about your team’s capacity, you can avoid overpromising and ensure sustainable success.
FAQs
How can we set realistic SLAs that match our team’s capacity?
To create SLAs that truly match your team’s abilities, start by diving into your current workload and performance data. Look at how many tickets come in versus how many your team can resolve without feeling overwhelmed. Key areas to monitor include channel volume, peak activity times, and how complex the tickets are – these factors can reveal bottlenecks and patterns you need to address.
Consider using percentile-based SLAs to set achievable goals. For instance, calculating response times at the 75th percentile can give you a realistic target that reflects what your team can consistently deliver, rather than aiming for perfection. Tools like response time histograms or agent median data can help pinpoint these benchmarks. This method keeps your SLAs practical and reduces breaches, while also easing the pressure on your team.
Finally, make it a habit to revisit and tweak your SLAs as your team’s capacity changes. This way, you can strike a balance between meeting customer expectations and protecting your team’s well-being, ensuring steady, high-quality support.
Why should severity levels be the main factor when setting support SLAs?
Using severity levels as the main criterion in setting SLAs ensures support teams focus on issues based on their real-world impact. This method is straightforward and avoids the added complexity of factoring in elements like customer tiers or communication channels. By concentrating on severity, teams can direct their resources to tackle the most pressing problems first, leading to quicker responses for urgent matters and better alignment with customer expectations.
On top of that, severity-based SLAs simplify the process by establishing clear and consistent prioritization rules. This approach helps streamline workflows, minimizes confusion, and builds customer confidence, as they witness critical issues being resolved promptly, while less urgent concerns are addressed in due course.
How can we effectively communicate SLA changes to our customers?
To effectively share changes to your SLA, start by clearly outlining the reasons for the updates. Highlight that these adjustments aim to enhance support outcomes by better matching response times with the seriousness of issues and the team’s capacity. Use straightforward and open language, like: "We’re revising our SLAs to provide consistent, dependable support for all customers while ensuring critical issues are addressed more efficiently."
Offer concrete examples to illustrate how issue severity influences response times. For instance: "For urgent issues such as outages, response times will remain swift, but less critical requests might experience slightly longer response times." Including a concise, easy-to-understand explanation and setting clear expectations can help reassure customers, keeping them informed and valued throughout the transition.