
When incidents happen, teams often focus on fixing technical issues fast, overlooking the business impact. This leads to poor documentation, misaligned communication, and unclear post-mortems, leaving leadership asking: "Who was affected, and how badly?"
To address this, standardizing how "customer impact" is tracked is key. Here’s what you need to know:
- Customer Impact: Measures how incidents affect clients, including the number of users, the type of disruption (outage, data loss, etc.), and business consequences.
- Framework: Use clear dimensions like scope, service quality, and business risk, rated on a 1–5 scale to avoid vague terms like "minor issue."
- Tools: AI can automate assessments, monitor customer sentiment, and generate accurate incident summaries for better decision-making.
- Workflow: Capture impact data during triage, updates, and resolution. Use structured fields (not free text) for consistency.
- Post-Mortems: Review incidents to validate impact data and refine processes over time.
CSAT: Measuring Customer Satisfaction in Incident Management
sbb-itb-e60d259
Building a Standardized Customer Impact Model
When engineers describe incidents inconsistently – like one saying "a few users affected" and another calling it "widespread disruption" – it creates confusion. This lack of clarity can mess up trend analysis, SLA and reporting framework, and executive updates. A standardized framework eliminates this ambiguity. The next step? Define clear impact dimensions and establish objective rating scales.
Defining Impact Dimensions and Rating Scales
Start by identifying the key dimensions of impact:
- Scope: How many users or accounts are affected?
- Service Quality: Is it a full outage or just degraded performance?
- Support Ticket Volume: A real-time indicator of how visible the issue is to customers.
- Business Risk: Could this lead to churn or hurt your reputation?
- Sentiment: What’s the emotional tone in support tickets and feedback?
Once you’ve nailed down these dimensions, use a 1–5 rating scale with specific criteria. For example, "Level 2: Login failures affecting users in a specific region" is clear and actionable. On the other hand, vague labels like "minor issue" don’t help anyone. Most companies reserve Level 1 for critical outages needing immediate action and Level 5 for minor disruptions with limited customer impact [2].
"The goal is not perfect data but useful data." – Upstat [2]
Aligning Impact Definitions with Business Goals
Your impact model should align with business priorities by tying each dimension to measurable outcomes – like SLA commitments, ARR exposure, regulatory compliance, or renewal risks. For example, a database slowdown might seem like a Level 4 technical issue. But if it delays end-of-month invoice processing for an enterprise client under a strict SLA, it’s a Level 1 business impact [2].
Here’s how impact dimensions connect to business goals:
| Impact Dimension | Business Goal | Example Criteria |
|---|---|---|
| Customer Segment | Retention & ARR | Affects Enterprise tier users vs. Free tier users |
| Revenue Impact | Commercial stability | Immediate transaction loss vs. potential lead loss |
| Compliance/Legal | Regulatory risk | SLA breach or mandatory regulatory notification |
| Sentiment/Emotion | Brand reputation | High frustration in support tickets or on social media |
Embedding Impact Criteria into Playbooks
Defining your model is just the start. To make it effective, you need to integrate these criteria into your incident response playbooks. Use dropdown menus with predefined options instead of free-text fields for essential data like severity, affected service, and customer segment. Free-text inputs often lead to inconsistent data – "outage", "full outage", and "complete outage" could all end up as separate categories in reports. Make fields like severity, status, and affected service mandatory at incident creation, while more detailed inputs like root cause can wait until after resolution [2].
Playbooks should also include threshold-based triggers that activate specific actions when impact dimensions hit certain levels. For instance, if sentiment analysis flags a surge in negative customer feedback during an incident, the playbook should automatically escalate the issue to a senior support lead [3]. Automating these triggers removes the need for on-the-spot decisions during high-pressure situations, keeping the response both efficient and consistent.
Putting Impact Capture into Practice During Incidents
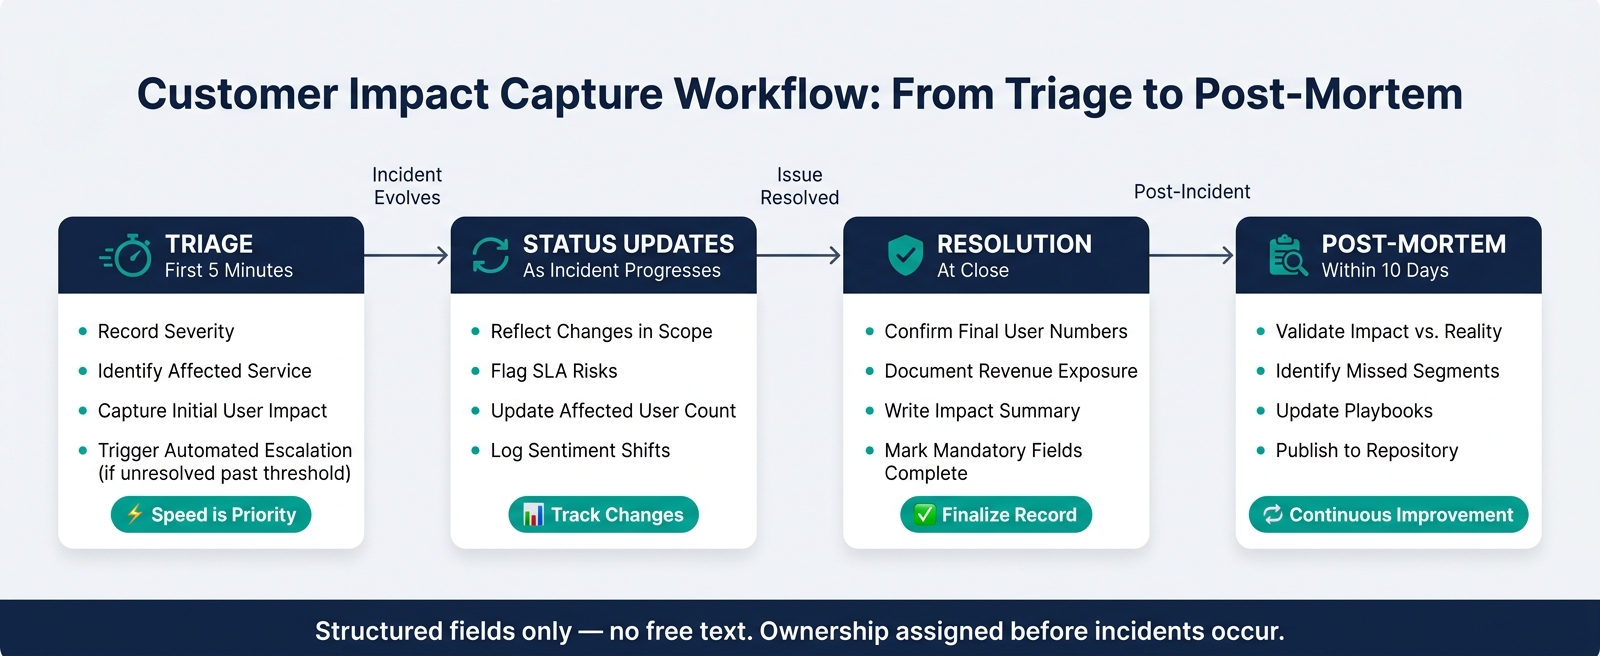
Customer Impact Capture Workflow: From Triage to Post-Mortem
An impact model is only effective if your team knows how to use it – consistently, under pressure, and at the right moments. This requires a clear workflow, structured data fields, and defined ownership, all set up before any incident occurs.
Designing an Impact Capture Workflow
To maintain accurate records, capture impact data at critical points in an incident’s lifecycle: triage, status updates, and resolution. Trying to gather all the details at once – especially after the fact – often leads to incomplete or incorrect information. By operationalizing the predefined impact dimensions, you ensure consistency and real-time accuracy.
During triage, speed is the priority. Within the first five minutes, record the severity, affected service, and initial user impact. If the issue isn’t resolved within preset timeframes, automated escalations can kick in – tailored to your business needs. As the incident evolves, status updates should reflect any changes in scope or risks to service-level agreements (SLAs). Finally, at resolution, finalize the record with confirmed user numbers, revenue exposure, and a concise impact summary.
"When an incident strikes, the first question from leadership is never ‘what broke?’ It’s ‘how bad is it?’" – Nawaz Dhandala, OneUptime [4]
By standardizing this workflow, every detail entered contributes to a cohesive and actionable incident record.
Standardizing Data Fields and Structures
Free-text entries often lead to messy, inconsistent records. Instead, use structured fields with automated population wherever possible to enforce uniformity.
Key fields to include are:
- Severity
- Status
- Affected service
- Number of impacted users
- Customer tier
- Estimated revenue exposure
Fields like root cause and resolution summary can be conditional, required only for resolved or escalated incidents.
"Structured incident data transforms incident management from reactive firefighting into measurable operational improvement." – Upstat [2]
Organize fields into categories for clarity:
| Field Category | Example Fields | Purpose |
|---|---|---|
| Basic Info | Title, Severity, Status | Simplifies reporting and lifecycle tracking |
| Customer Impact | Affected Users, Impact Level, Regions | Quantifies the disruption’s scale and location |
| Service Context | Affected Service, Environment, Team | Identifies the technical source and responsible party |
| Timeline Data | Detected At, Resolved At, Duration | Tracks response times and SLA adherence |
Use consistent naming conventions for titles, such as "[service] – [issue_type]", to make records easy to scan without opening each one.
Defining Roles and Decision Rules
Once you’ve standardized data fields, clear role definitions are critical to maintaining data quality. Assigning ownership ensures nothing falls through the cracks.
For most incidents, on-call responders handle initial data entry. If the situation escalates, an Incident Commander steps in to manage impact assessments and external communication. For incidents involving enterprise or strategic accounts, the system can automatically notify Account Managers to address high-priority customer concerns.
"Automating away key actions based on objective facts and data about the incident means responders and incident leads can focus on what they know, rather than what they need to do." – incident.io [1]
Decision-making should rely on objective criteria, not subjective judgment. For example, an impact score can be calculated using weighted dimensions like:
- User volume (25%)
- Revenue loss (25%)
- SLO burn rate (20%)
- Service blast radius (10%)
- Customer tier (10%)
- Duration (10%)
If the score exceeds a predefined threshold, the system triggers automatic escalation. This eliminates the need for manual triage and ensures that both technical and business impacts are addressed efficiently, keeping customer priorities front and center.
Using AI to Improve Accuracy and Speed in Impact Recording
Even with well-defined workflows and roles, human decision-making under pressure can sometimes falter. AI bridges this gap by instantly analyzing incidents and applying consistent logic throughout.
Automating Impact Detection and Assessment
AI takes standardized impact capture to the next level by ensuring real-time, consistent assessments. It continuously monitors baseline metrics like active user counts, error rates, and latency, immediately identifying deviations when an issue arises. Instead of relying on manual severity assessments, AI automates the calculations.
"Impact analysis transforms vague status updates into concrete numbers: how many users are affected, how much revenue is at risk, which SLAs are in jeopardy." – Nawaz Dhandala, OneUptime [4]
The process typically follows four stages: detection, multi-dimension analysis, composite scoring, and action-driving. AI simplifies this by consolidating data into a weighted composite score, either confirming the severity rating or flagging inconsistencies. For example, pattern detection algorithms can catch misclassifications, such as labeling a prolonged incident as low severity [2]. Service dependency graphs further enhance accuracy by mapping the incident’s blast radius, showing which downstream services and customer accounts are affected beyond the initial failure point [4]. This provides a detailed overview in seconds.
Beyond numerical data, adding emotional context to these assessments creates an even more complete understanding of the impact.
Adding Sentiment and Emotional Analysis to Impact Scoring
Quantitative metrics like affected user counts and revenue loss show the scale of an incident, but sentiment analysis reveals how customers are experiencing it. AI-powered sentiment tools analyze customer communications in real time, gauging frustration and urgency. For instance, a mid-level incident affecting a small group of enterprise accounts might generate a high volume of frustrated messages, signaling a need to reassess the business impact. Platforms like Supportbench integrate sentiment, intent, and emotional scoring directly, eliminating the need for separate tools or manual reviews. This creates an impact score that balances operational data with customer sentiment, offering a well-rounded perspective before deciding on communication or escalation.
The combination of these data points also sets the foundation for better post-incident learning.
Using AI Summaries to Support Post-Incident Learning
After an incident is resolved, AI-generated summaries can quickly compile logs, alerts, and notes into structured drafts, removing the need for manual reconstruction. A two-step process ensures accuracy: first, AI extracts structured facts like timestamps, error codes, and affected services into a predefined format; then, it converts those details into a clear narrative [5]. This approach minimizes errors, as one expert explained:
"The best incident summary system is not the one with the smartest model. It is the one with the clearest inputs, the tightest validation, and the shortest path from evidence to approval." – Daniel Mercer, Senior SEO Editor, qbot.uk [5]
AI can also tailor summaries for specific audiences. Executives receive versions focused on business impact and resolution times, engineers get technical breakdowns, and customers see plain-language updates [5]. Supportbench takes this further by using case histories to auto-generate knowledge base articles, turning resolved incidents into reusable resources, often before the post-mortem meeting even begins. Teams can measure the "edit distance" – how much human reviewers adjust AI-generated drafts – to track and improve summary quality over time [5].
Maintaining and Improving Impact Data Over Time
Gathering impact data during an incident is important, but the job doesn’t end there. To ensure its usefulness, you need to maintain and refine this data over time. This includes reviewing post-mortems to confirm that your impact assessments align with the actual outcomes.
Building Feedback Loops Through Post-Mortems
Post-mortems are a critical tool for validating your impact data. They help you compare the initial severity rating with what actually occurred. Did the predicted business impact align with reality? Were there any customer segments affected that were overlooked? These reviews help you identify and address gaps before they become recurring issues.
For major incidents, consider involving a customer liaison in the post-mortem process [6]. Internal technical data may not fully capture the customer experience, and having someone who represents the external perspective can help fill in those gaps. As Sweta Ackerman, Engineering Leader at PagerDuty, explains:
"A pattern of similar or repeated incidents with the same underlying root cause can point to the need for larger architectural changes." [6]
To make this process even more effective, maintain a centralized and searchable post-mortem repository. This enables you to spot patterns and build a case for addressing root causes [6].
Measuring Data Quality and Outcomes
Improving the reliability of your data requires tracking key metrics. Some of the most useful indicators include:
| Metric | Target | Why It Matters |
|---|---|---|
| Action Item Closure Rate | > 90% | Ensures that impact data leads to actionable follow-up [7] |
| 90-Day Recurrence Rate | < 5% | Indicates whether previous fixes effectively resolved the issue [7] |
| Time to Publish Post-Mortem | < 10 days | Keeps insights relevant and actionable [7] |
| Classification Accuracy | High | Verified through periodic manual audits of incident records [2] |
Additionally, watch for severity distribution imbalances. If your incident log is full of Sev-1 incidents but has very few Sev-3 or Sev-4 events, it could signal severity inflation. This might mean teams are over-escalating issues or failing to log minor ones. Regular audits of incident classifications can help address consistency drift, where responders rate similar events differently over time [2].
"Structured incident data transforms incident management from reactive firefighting into measurable operational improvement." – Upstat [2]
Metrics are just one part of the equation. Strong data governance ensures that your impact records remain a tool for continuous improvement.
Managing Data Governance and Privacy
Tailor your impact data for different audiences. For example, customer-facing status pages should include high-level timelines and resolution steps, while internal post-mortems can dive into technical details, root cause analyses, and specific action items. To maintain professionalism and privacy, avoid naming individuals – focus on roles and systems instead [7].
For regulated industries, it’s especially important to flag whether personal data was at risk. Under GDPR, certain breaches must be reported to regulators within 72 hours [7]. Linking compliance requirements directly to incident records simplifies audits and keeps your documentation clean. As one framework puts it:
"Data linked to decisions transforms compliance overhead into operational intelligence." – Upstat [2]
Finally, establish clear criteria for closing incidents. Ensure that impact data is complete, preventive measures are assigned, and the record is auditable [8]. This approach keeps your processes thorough and your organization prepared for future challenges.
Conclusion: Steps to Consistent Customer Impact Tracking
Tracking customer impact consistently starts with standardizing how data is recorded, classified, and analyzed. For example, swapping free-text fields for predefined dropdowns – like severity levels or affected services – helps eliminate fragmented data, making it easier to analyze incident records at scale [2]. This structured approach becomes the backbone of meaningful insights in incident management.
It’s also crucial to document the full scope of business impact. This includes identifying affected customer segments, evaluating SLA risks, and calculating revenue exposure. When technical failures are translated into clear business terms, leadership gains the context needed for quick, informed decisions [4].
AI tools play a key role here. By using natural language processing (NLP) for sentiment analysis and automating timestamp captures, these tools can identify rising customer frustration in real time and generate reliable MTTR metrics [2][3]. Automating these processes not only speeds up incident response but also ensures your team has the data needed for continuous improvement.
Regular reviews and audits are essential to maintaining consistency in how incidents are classified. Without these, trends can become distorted over time. Adding a confidence level (e.g., High, Medium, Low) to each impact record is another safeguard – it ensures leadership understands the reliability of the data, especially when service-specific details are limited [4].
FAQs
What’s the fastest way to estimate customer impact in the first 5 minutes?
To assess customer impact swiftly, rely on a standardized severity matrix with clear, measurable criteria. Evaluate the incident by considering these factors:
- Percentage of users affected
- Type of functionality loss (e.g., core features versus minor ones)
- Business risk (such as revenue impact or SLA breaches)
- Availability of workarounds
Keep triage time short – 30 to 60 seconds max – to prevent delays. If it takes longer, err on the side of caution and assign a higher severity level to ensure critical issues get immediate attention.
How do we prevent “severity inflation” when teams rate impact differently?
To keep severity levels accurate and meaningful, it’s essential to use a standardized severity matrix. This matrix should include objective criteria such as:
- The percentage of users impacted
- The extent of functionality loss
- Availability of workarounds
A weighted scoring system can also help by factoring in elements like business risk and the scope of the issue’s impact. This ensures a more balanced and consistent classification process.
If determining the severity level takes more than 60 seconds, it’s a good idea to default to a higher severity. This approach prioritizes a quick response while minimizing delays.
Lastly, make it a habit to regularly review and fine-tune the matrix. This keeps the criteria clear, consistent, and aligned with evolving needs.
Which incident fields should be mandatory vs. optional to keep data consistent?
To maintain consistent and actionable data, it’s crucial to make core fields mandatory while allowing secondary details to remain optional. The required fields should cover:
- Severity level: Whether the issue is system-wide or impacts individual users.
- Status values: Such as New, In Progress, or Resolved.
- Key timestamps: Including creation and resolution times.
- Customer-centric metrics: Details like the number of affected accounts or the customer tier involved.
Optional fields, like links to logs or root cause analysis, can be added later. This approach ensures incident reporting isn’t delayed while still allowing for comprehensive follow-up details.