Not all product issues are created equal. Treating every support ticket the same way can lead to wasted resources and overlooked critical problems. Here’s how to prioritize product fixes effectively by focusing on two key metrics: ticket volume and revenue impact.
Key Takeaways:
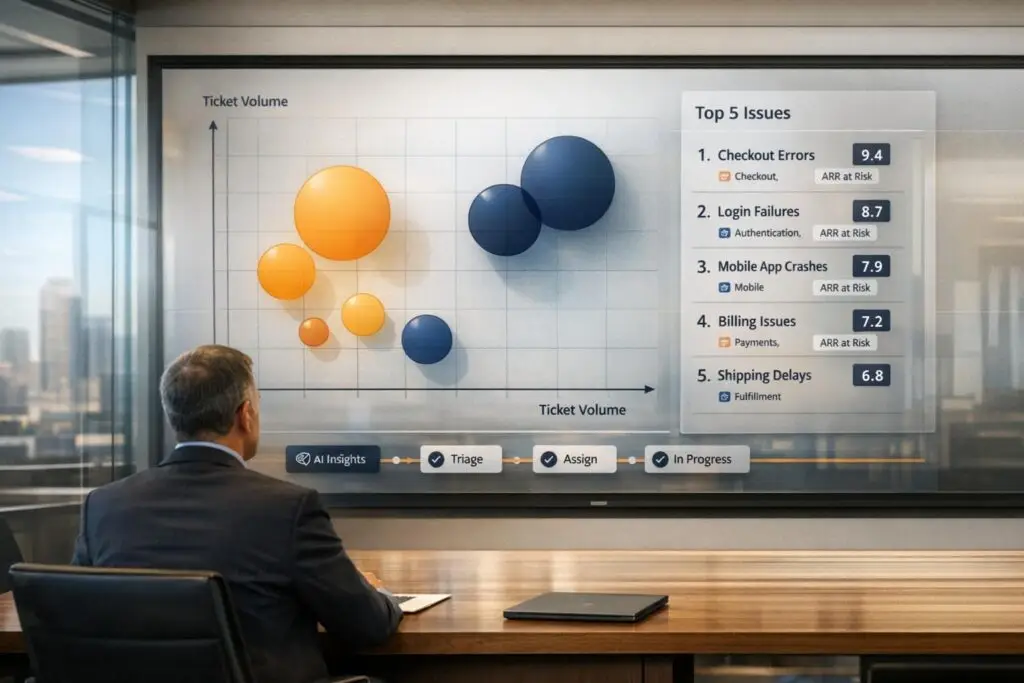
- Ticket Volume: Shows how many customers are affected by an issue.
- Revenue Impact: Highlights financial risks, such as potential churn or lost revenue from high-value accounts.
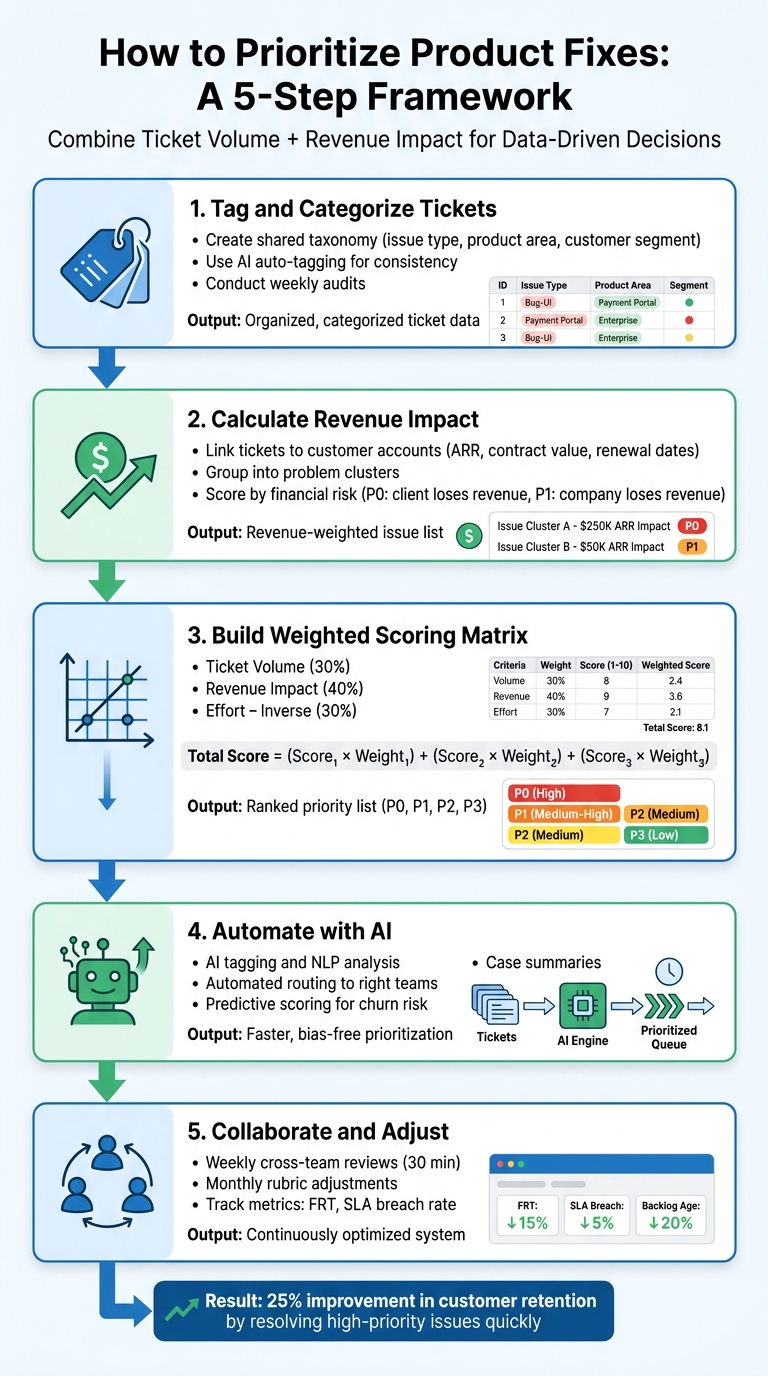
- Steps to Prioritize:
- Tag and Categorize Tickets: Use standardized fields and AI tools to classify issues consistently.
- Analyze Patterns: Identify recurring issues and their impact on customer segments.
- Calculate Revenue Impact: Link tickets to customer accounts and assess financial risks.
- Use a Weighted Scoring Matrix: Rank issues based on volume, revenue, severity, and effort.
- Automate with AI: Streamline tagging, scoring, and routing for faster resolutions.
This structured approach ensures your team focuses on high-impact issues, protects revenue, and avoids the "everything is urgent" trap.
5-Step Framework for Prioritizing Product Fixes by Ticket Volume and Revenue Impact
Step 1: Collect and Analyze Ticket Volume by Issue Type
The first step in prioritizing customer issues effectively is to establish a clear, data-driven approach. By accurately quantifying and categorizing customer concerns, you can move beyond guesswork and create a structured system that captures, counts, and organizes every issue.
Using Tags, Categories, and AI Auto-Tagging
Start by creating a shared taxonomy that your support, product, and sales teams can all use. This shared vocabulary ensures consistency when classifying tickets. Your taxonomy should include fields like:
- Issue type (e.g., defect, feature gap, workflow friction)
- Request intent (e.g., new feature, expansion, churn risk)
- Customer segment (e.g., SMB, mid-market, enterprise)
- Product area (e.g., checkout, inventory, payment gateway, analytics) [6]
To avoid inconsistent tagging, standardize key fields such as issue type, subscription plan, monthly recurring revenue (MRR), communication channel, and sentiment [1].
AI auto-tagging can simplify this process. Instead of relying on manual tagging, use AI tools to analyze ticket text and automatically populate structured fields. These models can identify themes, components, intent (e.g., bug, gap, confusion, workflow), and severity from customer messages [3]. This ensures consistency as ticket volumes grow, while also freeing up your team to focus on resolving issues.
"Support tickets can be thought of as a repository of customer issues that need to be addressed in your product development roadmap. AI simply helps analyze and categorize these tickets in a standardized manner to identify recurring themes or patterns." – Typewise [3]
For critical categories like incidents, outages, security, or billing, implement tiered tagging to ensure accurate routing and counting [1][2]. Additionally, conduct weekly audits of your tags. Support or product operations leads should review a sample of tickets to confirm consistent application of the taxonomy, ensuring the reliability of your data [6].
With a solid tagging system in place, you’ll be able to uncover trends that highlight deeper issues.
Finding Patterns in High-Volume Tickets
After tagging your tickets, the next step is to identify recurring patterns that point to broader problems. Use fuzzy matching to group similar tickets and eliminate duplicates [3].
For example, if multiple tickets mention "payment processing delays" and "credit card authorization failures", these may both stem from an issue with the payment gateway. Adding CRM metadata – like customer segment, ARR influenced, and account tier – can help you understand not just the number of customers affected, but also which segments are most impacted [3][6].
Tracking ticket frequency over time can reveal trends. For instance, a sudden spike in tickets about a feature after a release might indicate a regression or poor user experience. On the other hand, a steady stream of low-volume tickets could suggest a need for better documentation rather than a product defect.
"Support tickets surface pain points but rarely pinpoint the root cause behind them. Treat tickets as valuable data points, not directives." – Julien Quintard, Founder & CEO, Routine [6]
To streamline this analysis, use a two-step AI process: first, extract structured data from tickets; then, summarize long threads into concise problem statements and potential solutions [3]. Additionally, consolidate customer interactions across platforms (e.g., email, chat, web forms) into a single account record. This avoids inflated ticket counts and provides a clearer picture of the issues [6].
sbb-itb-e60d259
Step 2: Calculate Revenue Impact of Each Issue
Once you’ve categorized your tickets, the next step is to figure out how much each issue could impact your revenue. Not all bugs are created equal – a glitch affecting 100 free-tier users is a world apart from one that’s preventing 10 enterprise customers, worth $500,000 in Annual Recurring Revenue (ARR), from accessing your service. By focusing on this financial perspective, you can prioritize fixes that safeguard your revenue streams.
Connecting Issues to Customer Tiers
To get started, link every ticket to the relevant customer account and pull in financial data from your CRM. This should include details like ARR, contract value, renewal dates, and customer segment (e.g., SMB, mid-market, enterprise). Automating this process by integrating your ticketing system with your CRM can save a lot of time and eliminate the need for manual lookups [6].
It’s also crucial to consolidate customer identities across all communication platforms – email, chat, web forms, and more. For instance, if an enterprise client reports the same issue through multiple channels, it should count as a single affected account, not three separate ones.
Group similar tickets into "problem clusters" and calculate the total ARR of all impacted accounts for each cluster. For example, if 15 customers report an issue like "invoice export failures", and their combined ARR is $1.2 million, that problem clearly carries more financial weight than a low-priority feature request from accounts worth $50,000 [3]. Additionally, don’t just focus on ARR – highlight issues affecting "strategic accounts", such as those with strong growth potential or significant brand influence, even if their current revenue contribution is small [6].
These enriched insights lay the groundwork for understanding the financial risks tied to each issue.
Scoring Issues by Financial Risk
To prioritize effectively, classify issues based on their financial impact:
- P0 issues: Problems where clients lose revenue, such as outages or transaction failures [4][5].
- P1 issues: Problems where your company loses revenue, like broken trial sign-ups or ineffective marketing campaigns [4][5].
Next, factor in churn risk. For example, a billing error affecting a $200,000 account that’s up for renewal in 30 days should take precedence over the same issue impacting an account with 11 months left on its contract [3]. Use rough impact estimates to gauge how many high-value accounts are affected compared to the overall user base [4][5].
Finally, classify the intent behind each request – whether it’s tied to "expansion potential", "downgrade risk", or "churn save." This ensures you’re not just tallying up tickets but are also aligning fixes with your broader revenue goals [6]. By doing so, you’ll have a clearer picture of how to prioritize your resources for maximum financial impact.
Step 3: Build a Weighted Prioritization Matrix
Once you’ve analyzed ticket volume and revenue impact, the next step is to create a weighted prioritization matrix. This tool helps streamline decision-making by combining multiple factors into a single framework. By scoring issues based on criteria like frequency, financial risk, severity, and effort, you can calculate a total score that ranks fixes systematically.
Creating a Scoring System
Start by identifying 4–7 criteria that align with your business goals. Common dimensions include:
- Ticket Volume: How many customers are affected
- Revenue Impact: The annual recurring revenue (ARR) at risk
- Severity: How disruptive the issue is to workflows
- Effort: How much time or resources are required to fix it
Assign weights to each criterion based on its importance, ensuring the weights add up to 100%. For instance, you might allocate 30% to Ticket Volume, 40% to Revenue Impact, and 30% to Effort – emphasizing revenue protection over other factors. To calculate the total score, use this formula:
Total Score = (Score_1 x Weight_1) + (Score_2 x Weight_2) + ... + (Score_n x Weight_n)
Pro Tip: For effort, use an inverse scoring system – a score of 5 represents low effort (quick fixes), while 1 indicates high effort (complex projects). This ensures that high-impact, low-effort fixes naturally rise to the top of your priority list [7][3].
To maintain consistency, create a scoring rubric that defines what each score means for every criterion. For example, a "5" for Revenue Impact might represent "Affects top-tier enterprise accounts or more than $100,000 in ARR at risk", while a "1" might mean "No measurable impact on revenue or churn risk" [7][3].
Another tip: score each criterion separately. Evaluate all issues for "Ticket Volume" first, then move to "Revenue Impact", and so on. This approach minimizes bias and ensures objective comparisons [7].
Using a Prioritization Table for Decisions
After scoring all issues, compile the results into a prioritization table. This table should include columns for each criterion, the total weighted score, and the final priority level. It serves as a central reference for cross-functional decision-making.
| Issue Type | Ticket Volume (30%) | Revenue Impact (40%) | Effort – Inverse (30%) | Total Weighted Score | Priority Level |
|---|---|---|---|---|---|
| Login Bug | 5 (High) | 5 (Critical) | 4 (Low Effort) | 4.7 | P0 |
| API Timeout | 3 (Medium) | 4 (High) | 2 (High Effort) | 3.1 | P1 |
| UI Polish | 2 (Low) | 1 (Low) | 5 (Very Low Effort) | 2.5 | P2 |
Set priority thresholds to categorize issues. For example:
- P0: Total scores of 4.3 or higher
- P1: Scores between 3.6–4.29
- P2: Scores between 2.6–3.59
- P3: Scores below 2.6 [1]
This approach creates clear boundaries for what requires immediate attention versus what can be deferred.
To keep the matrix relevant, review and adjust the weights quarterly as business needs evolve. For example, during a churn crisis, you might increase the weight for "Customer Retention." After a major product launch, you could focus more on "Adoption Friction" [7]. This transparency ensures all stakeholders understand why certain issues are prioritized.
With your prioritization matrix in place, you’re ready to move on to integrating AI for workflow automation.
Step 4: Use AI to Automate Prioritization Workflows
With a weighted matrix established, advanced AI tools can now take over prioritization workflows. Manual processes are often slow and prone to bias, but AI-powered systems streamline this by analyzing ticket details, customer data, and historical trends. The result? High-impact issues are identified, scored, and routed to the right teams without unnecessary delays. This helps eliminate bottlenecks and ensures that critical product problems are addressed promptly.
AI Tagging, Scoring, and Routing
AI uses Natural Language Processing (NLP) to analyze ticket content, categorizing issues by factors like type, urgency, and potential revenue impact. Instead of manually sifting through hundreds of tickets, AI detects patterns in seconds. For instance, if several enterprise customers report an "API timeout" issue, the system clusters these tickets and flags the problem as high-priority based on its effect on Annual Recurring Revenue (ARR) [8].
These systems also integrate seamlessly with CRMs, incorporating metrics like Annual Contract Value (ACV) and customer tier. This ensures that tickets from high-value accounts – such as a $500,000/year enterprise client – are prioritized over those from smaller accounts, even if the technical issue is identical [2]. AI also keeps track of SLA deadlines, pushing tickets closer to their response deadlines to the front of the queue, reducing the risk of compliance failures [8].
Once tickets are scored, automated routing directs them to the appropriate teams. For example, complex bugs are sent to senior engineers, while billing-related inquiries go straight to finance. This eliminates the need for manual triage. A great example of this in action is Jakewell, a baby product retailer, which managed 10,000 monthly inquiries in March 2026 by using AI to automatically assign tickets to agents with the right expertise [10].
This automation not only speeds up current resolutions but also sets the stage for predictive insights that can improve future workflows.
Case Summaries and Predictive Scoring
AI doesn’t stop at tagging and routing – it also generates concise case summaries and predictive metrics to refine prioritization even further. These AI-generated summaries condense lengthy customer interactions into clear, actionable overviews that highlight the main issue and requested resolution [11]. This saves product teams from having to comb through extensive customer interactions, allowing them to focus on solving the problem.
Predictive scoring adds another layer of foresight by identifying issues that could impact revenue in the near future. By analyzing historical resolution data, customer behavior, and ticket trends, AI forecasts which problems might escalate into churn risks if left unresolved [9]. This proactive approach shifts the focus from reacting to immediate issues to addressing potential long-term damage.
Platforms like Supportbench make these AI features accessible right out of the box. They automatically summarize cases, prioritize tickets based on customer value and urgency, and route them to the right teams. Over time, these systems learn from resolution outcomes, continuously improving without the need for manual rule updates [8]. This dynamic approach ensures that your prioritization logic evolves alongside your business needs, keeping the most critical fixes at the forefront.
Step 5: Collaborate Across Teams and Adjust Over Time
To maximize the effectiveness of the data-driven and AI-automated strategies discussed earlier, it’s crucial to ensure alignment among your teams. Support, product, and sales teams should work together to focus on protecting revenue, improving customer retention, and staying compliant [1].
One way to streamline this collaboration is by integrating CRM data into your support platform. This allows for real-time prioritization based on factors like Annual Contract Value (ACV) and customer tier. Product teams can then use ticket data to create a structured roadmap that highlights risks to revenue and churn. This ensures that Service Level Agreements (SLAs) and escalation paths are designed to meet the expectations of your most valuable customers [2][3]. By working together, teams can continuously refine the prioritization process.
Weekly Reviews and Adjustments
While automated workflows are a great start, regular reviews across departments are essential to maintain accuracy and improve processes. Schedule a 30-minute weekly review session with representatives from support, product, and engineering. During this review, analyze five recent P0 and P1 tickets to confirm that scoring and routing were done correctly. Aim to identify and implement at least one improvement every week to balance immediate feedback with long-term objectives [1].
Additionally, conduct a monthly review of your scoring rubric on the first Monday of each month. This is an opportunity to adjust the weights of factors like "Impact" or "Customer Value" to align with changing business priorities. For instance, during renewal periods, you might increase the weight of "Churn Risk" from 20% to 30% [1]. Direct feedback from support agents can also help identify misclassifications and fine-tune your rubric.
"Consistency beats heroics. A clear, daily-applied prioritization rubric keeps customers satisfied and loyal." – Typewise [1]
Tracking Success Metrics
To improve your prioritization framework, it’s vital to measure its performance. Focus on key metrics to assess its efficiency:
- First Response Time (FRT): Monitor response times by priority level. For example, P0 tickets should receive a response within 10–15 minutes, while P1 tickets should be addressed within 30–60 minutes [1][13].
- SLA Breach Rate: Track the percentage of tickets that miss their deadlines, segmented by product area. This helps identify bottlenecks and resource allocation issues [1].
- Backlog Age: Keep an eye on how long tickets linger in the queue. Unresolved tickets over weeks could lead to "silent churn", where customers leave without voicing their dissatisfaction [1][12].
- Reopen Rate: A reopen rate above 10% may indicate issues like improper routing or skill gaps in the team [12].
- Touches per Resolution: Fewer interactions to resolve a ticket suggest smoother processes and better customer satisfaction [1].
Research shows that companies resolving high-priority issues quickly can boost customer retention by as much as 25% [12].
| Metric | Description | Target/Benchmark |
|---|---|---|
| First Response Time (FRT) | Median and 90th percentile response times segmented by priority. | P0: 10–15 mins; P1: 30–60 mins [1][13] |
| SLA Breach Rate | Percentage of tickets that miss their response or resolution deadlines. | Segment by product area to identify bottlenecks [1] |
| Backlog Age | Distribution of ticket ages in the current queue. | Monitor the oldest tickets to prevent "silent churn" [1][12] |
| Reopen Rate | Frequency with which resolved tickets are reopened by customers. | Target below 10% [12] |
| Touches per Resolution | Number of interactions required to close a ticket. | Fewer touches signify smoother resolution [1] |
Conclusion
Key Takeaways
Pairing ticket volume with revenue impact creates a structured, data-driven system to safeguard revenue. The five-step process discussed here – gathering ticket data, calculating revenue impact, creating a weighted scoring matrix, automating with AI, and fostering team collaboration – provides a repeatable method that can evolve with your business.
This approach shifts away from relying on anecdotal evidence or outdated "First In, First Out" methods. Instead, it emphasizes using structured insights to pinpoint issues that could harm retention, disrupt high-value accounts, or cause widespread friction [3]. However, technology alone isn’t the solution. Regular weekly reviews and monthly rubric updates are essential to keeping prioritization aligned with changing business objectives [1].
By linking support data to Annual Recurring Revenue (ARR) and customer tiers, you transform raw ticket data into a strategic tool. This method not only speeds up issue resolution but also strengthens trust by turning customer feedback into actionable improvements [3].
Next Steps for B2B Support Leaders
Here’s how to bring this framework to life in your organization.
Start by developing an AI-ready taxonomy. Standardize fields like Theme, Component, Intent, Severity, and ARR influenced across all support channels [3]. Then, implement a clear weighted scoring formula. A common example might allocate 30% weight to volume, 25% to ARR, 20% to severity, and 15% to churn risk [3]. This ensures your team has a consistent and objective method for prioritizing issues.
Actionable steps include:
- Integrating CRM data with your support platform so agents can view Annual Contract Value (ACV) during ticket triage [2].
- Automating ticket routing by sending high-priority tickets (priority score ≥ 4.3) directly to a "Rapid Response" queue [1].
- Scheduling weekly reviews with product and engineering teams to validate AI-generated clusters and refine your rubric based on actual outcomes [3].
For B2B support leaders looking to scale, Supportbench offers an AI-native platform tailored for modern, cost-effective support operations. With features like AI tagging, sentiment analysis, and seamless CRM integration, you can implement these strategies without overhauling your existing tools. The result? Faster response times, fewer SLA breaches, and a support system that directly boosts revenue and enhances customer loyalty.
FAQs
How do I estimate revenue impact when ARR data is missing?
If ARR data isn’t accessible, you can estimate revenue impact by diving into customer segments, evaluating the effect on specific accounts, or considering measurable factors like the number of seats impacted or the strategic importance of certain tiers. AI tools can be particularly helpful here – they can identify recurring ticket themes and assess potential risks tied to revenue or customer churn.
You should also look at how these issues might affect retention rates, renewal likelihood, or usage metrics. These can serve as useful stand-ins for understanding revenue impact. The key is to focus on the data you do have and leverage AI-driven insights to prioritize your efforts effectively.
How should I weight volume vs revenue vs severity in the scoring matrix?
To prioritize effectively, focus on severity and revenue impact, as these directly influence key business outcomes such as customer retention and trust. Start by normalizing ticket data to evaluate urgency, complexity, and financial impact. Leverage AI tools to dynamically assign scores to tickets, ensuring a consistent and objective process. Tickets with high severity and significant revenue implications should take precedence, while issues with high volume but lower impact can be deprioritized. Strive for a balanced, data-driven approach that considers all relevant factors.
How do I prevent AI tagging and scoring from mis-prioritizing tickets?
To make sure AI handles ticket prioritization correctly, focus on maintaining accurate data interpretation and aligning the system with your organization’s goals. Start by standardizing tagging protocols – clear, consistent guidelines help the AI understand ticket categories better. Additionally, normalize key data points like revenue impact and customer sentiment to provide a uniform basis for decision-making.
Regular audits of AI outputs are also essential. These reviews can catch errors or biases and ensure the AI’s decisions stay on track. Incorporating feedback loops allows you to refine the model over time, improving its accuracy and relevance.
Finally, combine AI-generated insights with business-specific rules – like SLA deadlines or revenue impact – to ensure prioritization aligns with what matters most to your organization. This hybrid approach balances automation with human judgment, keeping priorities in check.