
Forecasting ticket volume for B2B products with long case cycles is key to balancing your support team’s workload and budget. B2B support is more complex than B2C, with extended resolution times, multiple stakeholders, and unpredictable volume surges. To forecast effectively, focus on these steps:
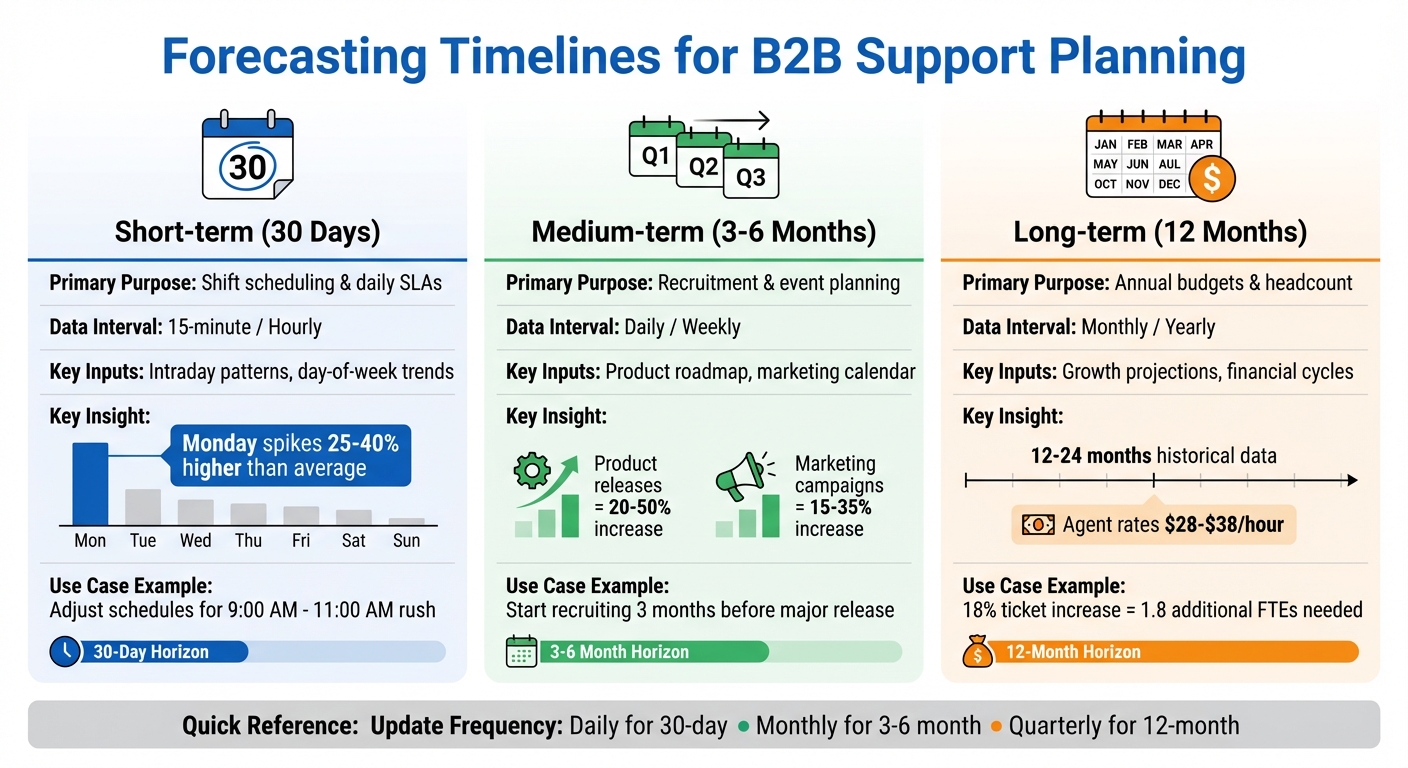
- Set goals by timeline: Use 30-day forecasts for scheduling, 3–6 months for planning resources, and 12 months for budgeting.
- Analyze historical data: Collect 12–24 months of clean data, including ticket timestamps, issue types, and customer segments. Exclude anomalies like outages or test tickets.
- Identify patterns: Spot trends like Monday ticket spikes (25–40%) or increases during product launches (20–50%).
- Incorporate events: Align forecasts with product releases, outages, and customer usage patterns.
- Leverage AI tools: Use predictive analytics for better accuracy, accounting for seasonality, escalation rates, predictive customer sentiment, and SLA impact.
Accurate forecasts help calculate staffing needs using formulas like (Tickets × AHT) / (Agent Capacity × Occupancy), ensuring the right number of agents to maintain SLAs without overspending. With agent costs ranging from $28–$38/hour and ticket costs between $5–$60, precise planning directly impacts your bottom line.
How to forecast call center volumes and AHT’s
sbb-itb-e60d259
Set Your Forecasting Goals Based on Support Timelines
B2B Support Forecasting Timelines: 30-Day, 3-6 Month, and 12-Month Planning Guide
Forecasting timelines are the backbone of effective planning, helping you balance data granularity with decision-making. To make the most of your forecasts, consider using multiple time horizons: 30 days for shift scheduling, 3–6 months for resource planning, and 12 months for annual budgeting [2].
Your forecasting goals should align with key performance priorities, such as maintaining an 80% first response rate or keeping your backlog below 50 cases [2]. These targets directly influence SLA performance and team capacity, giving your forecasts actionable purpose beyond just crunching numbers.
Here’s a quick breakdown of how different forecasting horizons address specific operational needs:
| Forecast Horizon | Primary Purpose | Data Interval | Key Inputs |
|---|---|---|---|
| Short-term (30 Days) | Shift scheduling & daily SLAs | 15-minute / Hourly | Intraday patterns, day-of-week trends |
| Medium-term (3–6 Months) | Recruitment & event planning | Daily / Weekly | Product roadmap, marketing calendar |
| Long-term (12 Months) | Annual budgets & headcount | Monthly / Yearly | Growth projections, financial cycles |
Each timeframe supports a distinct set of strategies tailored to your operational needs.
30-Day Forecasting for Immediate Staffing
Short-term forecasting helps you make quick staffing decisions and manage daily workloads. By identifying periods when predicted volume exceeds capacity, you can adjust schedules ahead of time [1][2]. For instance, Monday spikes often occur as users catch up after the weekend [2].
Breaking data into 15-minute or hourly intervals allows you to pinpoint volume surges [2][5]. A common example is the rush between 9:00 AM and 11:00 AM, when many customers start their workday. While daily trends can be forecasted weeks in advance, intraday trends remain reliable up to six weeks [5].
3–6 Month Forecasting for Resource Planning
Medium-term forecasting shifts the focus to resource planning and recruitment. By analyzing daily trends, you can prepare for predictable events such as product launches, marketing campaigns, or seasonal spikes [2][5]. This approach moves you from reactive adjustments to proactive planning.
For example, if your product roadmap predicts a major release in three months, you might expect a 20% to 50% increase in volume and start recruiting early [2]. Similarly, marketing campaigns often drive 15% to 35% more support inquiries, making it crucial to integrate your marketing calendar into your forecasts [2]. Updating these forecasts monthly ensures they stay aligned with evolving customer behavior and product updates [2].
12-Month Forecasting for Annual Budgets
Long-term forecasting focuses on annual budgeting and strategic headcount planning. By aligning support capacity with business growth and financial goals, you can make data-driven decisions for the year ahead [2][1]. To capture trends like summer slowdowns or end-of-year surges, you’ll need at least 12–24 months of historical data [2][5].
For instance, if you predict an 18% increase in tickets, your forecast might show the need for 1.8 additional full-time employees (FTEs) to maintain a 4-hour SLA [1]. With U.S. agent rates ranging from $28 to $38 per hour and ticket costs between $5 and $60, accurate forecasts directly impact your budget planning [1].
Gather and Clean Your Historical Data
The accuracy of your forecasts hinges on the quality of your data. For B2B products with long sales cycles, it’s ideal to work with a dataset spanning 12–24 months. This timeframe captures seasonal patterns like holiday surges or annual contract renewals [1][2]. While some AI-powered models can function with just two weeks of data, using at least 60 days allows you to identify basic trends more effectively [1][5].
What Data to Collect
Start by gathering temporal data, such as created_at and resolved_at timestamps. This type of data is essential for uncovering patterns across different times of the day, week, or year [1][2]. Add categorical fields like product area, issue type, and priority level to create tailored forecasts for various support levels [1][2]. Customer segmentation data – such as Enterprise vs. SMB, customer tenure, and preferred language – can also help predict ticket volumes based on your customer base [[7]](https://docs.buildbetter.ai/pages/Use Cases/cs/ticket-analysis)[2].
In addition to ticket-specific metrics, collect contextual metadata to explain spikes in demand. Historical records of product launches, software updates, marketing efforts, and system outages can help you differentiate between organic growth and event-driven surges [3][[7]](https://docs.buildbetter.ai/pages/Use Cases/cs/ticket-analysis)[2]. For instance, software releases often lead to ticket increases of 20% to 50%, while outages can cause volume to multiply by 5 to 10 times [2]. Collecting a wide range of data points sets the foundation for thorough cleaning and standardization.
How to Clean and Standardize Your Data
After gathering your data, cleaning and standardizing it is essential for accurate forecasting. Start by removing test tickets, duplicate entries, and automated alerts [1][2]. Make sure all timestamps are standardized to a single timezone and that categories (e.g., billing vs. technical issues) are applied consistently throughout the dataset [1][2].
"When backlog carryover, ticket reopens, and ‘just checking in’ follow-ups are counted as new demand, your forecast starts measuring operational congestion instead of customer intent."
– Fitgap [8]
Separate true customer demand – like first-time ticket submissions – from backlog work (old tickets still open) and rework (reopens or follow-ups) [8]. This ensures your analysis reflects actual customer needs rather than operational inefficiencies. Use immutable events, such as created_at, for labeling rather than relying on status names that can change over time [8]. Additionally, tag one-off incidents, such as major outages, so they can be excluded from baseline models while still being factored into incident readiness planning [1][2].
Where to Pull Your Data From
Once your data is cleaned, ensure you’re sourcing it consistently to build a reliable baseline. Export historical data from platforms like your helpdesk, CRM, or knowledge base [1][8]. Make sure the dataset includes every day in the selected range to avoid gaps that could skew your analysis [5]. For teams handling fewer than 10 tickets per day, simple moving averages may be more effective than complex time-series models [1]. Lastly, aim for a Mean Absolute Percentage Error (MAPE) of under 10% for support data. Anything above 15% suggests high variability in ticket volume [1].
Find Patterns and Trends in Your Case Volume
To better manage your support operations, it’s crucial to identify the recurring patterns that drive your ticket volume. For B2B products with longer case cycles, this involves looking beyond basic averages to uncover seasonal rhythms, weekly fluctuations, and growth trends that influence support demand. The idea is to separate predictable patterns from random noise, enabling you to create forecasts that reflect actual customer behavior. This step also sets the stage for leveraging AI-driven predictive analytics later.
Spot Seasonal Patterns and Volume Spikes
B2B support often follows seasonal cycles tied to business calendars rather than consumer habits. For instance, contract renewal periods, end-of-quarter activity, and industry-specific events tend to generate predictable spikes in ticket volume. January often sees an increase in tickets for B2B tools due to contract renewals [2]. Similarly, fintech products experience higher activity during tax season, while e-commerce platforms face a surge in inquiries during Q4 holiday shopping [2].
To uncover these patterns, plot your ticket volume data year-over-year. Look for recurring peaks and valleys, and consider that scaling companies typically experience annual growth rates between 10% and 25% [2]. Use seasonal decomposition techniques to normalize your monthly data, which helps distinguish organic growth from repetitive patterns [4][1]. Overlaying your ticket timeline with product launches, marketing campaigns, or outages can further clarify what’s driving demand [2].
| Event Type | Typical Volume Impact |
|---|---|
| Software Releases | 20% to 50% spike |
| Service Outages | 5x to 10x amplification |
| Marketing Campaigns | 15% to 35% increase |
| Monday Catch-up (B2B) | 25% to 40% higher than average |
Track Day-of-Week and Monthly Trends
Weekly patterns in B2B support are often consistent. For example, Mondays typically experience 25% to 40% higher ticket volumes as users address issues from the weekend [2]. This predictable trend can guide staffing decisions. By applying day-of-week multipliers to moving averages, you can account for these recurring spikes [2]. If Mondays are 35% above average and Fridays are 20% below, this insight is invaluable for scheduling shifts and planning capacity [1].
For a reliable seasonal analysis, gather at least 365 days of historical data [1]. This allows you to determine whether a spike in activity – say, in March – represents genuine growth or is part of a recurring pattern.
Use Charts to Identify Long-Cycle Patterns
Visualizing your data is key to identifying trends in cases with longer resolution times. Year-over-year comparison charts are particularly useful, as they allow you to compare current ticket volumes with the same periods in previous years [2]. These charts quickly highlight growth rates and recurring annual spikes. For long-term planning, consider daily, weekly, monthly, and yearly rollups instead of focusing on granular intraday data [5]. This broader view helps you pinpoint trends without getting bogged down by minor fluctuations.
Confidence interval shading can further refine your forecasting. For example, staffing to the upper edge of the 80% confidence interval ensures you’re prepared for most scenarios without overcommitting resources [1]. Aim for a Mean Absolute Percentage Error (MAPE) under 10% for solid support forecasting, with under 5% being an excellent benchmark [1].
Factor in Product Events and Customer Behavior
Historical ticket data can only take you so far. To create forecasts that mirror what’s happening in the real world, you need to connect spikes in ticket volume to specific product events and customer behaviors. For example, software releases often lead to a 20% to 50% surge in tickets, while system outages can cause ticket volume to skyrocket by 5 to 10 times [2]. Recognizing these patterns lets you incorporate them into your forecasting models for better accuracy.
Link Cases to Product Releases and Outages
Building on trend analysis, this step involves integrating specific events into your forecasts. Start by aligning your ticket data with product release schedules and incident logs. If your team uses tools like Jira to track releases, you can map that data against your support volume. For instance, if launching a new billing feature triggers a noticeable spike in tickets, tag that event and adjust your forecasts accordingly [2]. One team improved their forecasting accuracy by 15% by combining historical data with event overlays [2].
Don’t forget to include marketing campaigns in your models. Coordinate with your marketing team to identify campaign timelines and factor those dates into your forecasts. For B2B products with longer case cycles, it’s important to differentiate between new demand (like initial ticket creation) and backlog work (ongoing effort on existing cases).
Analyze Customer Usage and Stakeholder Patterns
Customer behavior can be another key indicator for refining forecasts. For example, if your user base grows by 30%, you can generally expect a proportional rise in ticket volume – unless improved onboarding or automation offsets the increase [2]. To better understand this connection, integrate data from your CRM, product analytics, and project management tools. This allows you to see how usage patterns influence ticket volume across different customer segments [6].
Segment your forecasts by customer type, product area, and ticket priority. Enterprise customers often generate more complex cases with longer resolution cycles compared to SMB customers. Use unique requester identifiers and ticket creation timestamps to distinguish new customer issues from operational noise like reopens or follow-ups [8]. Advanced AI tools can help automate this segmentation and highlight trends you might otherwise miss.
Build Baseline Models by Filtering Out Anomalies
Once you’ve factored in product events and customer behavior, the next step is to refine your models by filtering out anomalies. Major outages or rare crises should be tagged and excluded from baseline calculations. As Emily Carter from EasyDesk notes:
"Tag outages and rare crises separately so they do not distort typical forecasts" [2].
Keep this data for incident planning, but don’t let it skew your average demand calculations.
In your forecasting spreadsheets, include a dedicated row for events like product launches, billing cycles, and holidays [8]. For unpredictable events where time-series models fall short, consider building scenario-based staffing plans instead [1]. Also, track follow-ups and reopens separately from new demand – this prevents overestimating staffing needs due to resolution quality issues rather than actual customer intent [8]. By isolating these anomalies, you’re left with a clean baseline that reflects normal operations and can be adjusted for planned events.
Combining insights from product events, customer behavior, and anomaly filtering lays the groundwork for more accurate, AI-driven forecasting.
Use AI and Predictive Analytics for Better Forecasts
Once you’ve established baseline models and filtered out anomalies, advanced AI tools can take your forecasts to the next level. With a clean foundation, AI can go beyond the limitations of spreadsheets. Did you know that 47% of workforce management teams still depend on manual methods and intuition for staffing plans? [1] AI-driven forecasting transforms guesswork into precise, data-supported predictions. Instead of vague assumptions like, “We’ll need two more agents next quarter,” AI provides a clearer, more accurate forecast. For instance, MCP Analytics offers this example:
"Our model predicts 18% more tickets next quarter (95% CI: 12-24%), which requires 1.8 additional FTEs to maintain our 4-hour SLA" [1].
This kind of AI-driven insight builds on your existing data models, making it easier to integrate forecasting into staffing and resource planning seamlessly.
Apply AI to Time Series Analysis
AI uses methods like ARIMA (AutoRegressive Integrated Moving Average) and ensemble modeling to analyze historical data and predict future trends with greater precision. These models break ticket data into components – trend, seasonal, and residual – which can uncover lasting patterns in staffing needs. For example, if the analysis shows that Mondays consistently see a 35% increase in activity while Fridays drop by 20%, you can adjust your schedules accordingly [1].
AI forecasting also provides confidence intervals instead of single-point estimates. For instance, it might predict 500 tickets next month with an 80% confidence range of 450–550 and a 95% range of 420–580. By planning near the upper edge of the 80% confidence range, you can prepare for most scenarios without over-hiring [1]. Advanced AI tools can also detect seasonality in historical data and integrate custom holiday calendars to account for special events [5]. With 12 to 24 months of historical data, these models can accurately forecast daily trends for the next six months [5].
Predict Escalation Rates and SLA Impact
AI doesn’t just help with volume forecasting – it also predicts escalations and their impact on capacity. For B2B products with long case cycles, escalated cases can consume three times the resources of standard tickets. AI can analyze historical escalation patterns to estimate what percentage of cases might escalate and how that will affect SLA performance. For example, if escalation rates spike by 15% during product release weeks, AI can help you plan for this added complexity without resorting to last-minute staffing changes. A Mean Absolute Percentage Error (MAPE) under 10% is considered solid for support data, while under 5% is exceptional [1].
AI Features That Improve Forecasting
Modern AI platforms go beyond just predicting ticket volumes. Tools like Supportbench offer predictive features for CSAT (Customer Satisfaction) and CES (Customer Effort Score), which provide insights into not only ticket volume but also the quality and complexity of incoming cases. Predictive CSAT can reveal whether customers are likely to be satisfied with resolutions, while predictive CES highlights how challenging certain issues might be to resolve – both critical for resource planning.
AI also generates case summaries and tracks activity trends, adding valuable context to forecasts. For instance, if AI shows that enterprise customers generate 40% more follow-up activities than SMB customers, you can adjust staffing plans to reflect these differences. Unified signal tracking, powered by AI, can improve case volume prediction accuracy from 74% to 86% [6], especially when you integrate data from tools like your CRM, product analytics, and project management software. To keep forecasts accurate as your products evolve and teams grow, it’s a good idea to re-run AI models monthly [1]. These advanced features provide the detailed insights needed to allocate resources effectively based on customer needs and case complexity.
Turn Forecasts into Staffing and Resource Plans
After analyzing historical trends and using AI to generate accurate forecasts, the next step is to turn those insights into actionable staffing and resource plans. Accurate forecasting is critical for managing your budget – especially since U.S. agent rates currently range from $28 to $38 per hour [1]. Overstaffing leads to unnecessary expenses, while understaffing risks SLA violations. The challenge lies in balancing adequate coverage with cost efficiency, all while staying prepared for the unpredictability of B2B support needs. By leveraging your forecasts and trend data, these staffing strategies can help ensure both operational readiness and financial control.
Calculate Agent Requirements for Long Cases
To determine the number of agents (FTEs) needed, use this formula:
(Tickets × AHT) / (Agent Capacity × Occupancy) [2].
For B2B products with lengthy case cycles, the average handle time (AHT) includes every step – initial responses, follow-ups, stakeholder coordination, and escalations. For instance, if your forecast predicts 500 tickets with an average case time of 4 hours, and agents work 160 hours per month at 75% occupancy, you’d need about 17 FTEs. To stay on the safe side, base your staffing on the upper edge of an 80% confidence interval. If your forecast predicts 500 tickets within a range of 450–550, plan for 550 tickets to avoid being short-staffed [1].
For new product features, keep in mind that agents may initially resolve fewer cases due to the learning curve. Adjust your expectations accordingly, as their efficiency will improve over time [9].
Prepare for Event-Driven Volume Spikes
Certain events, like software releases, can cause ticket volumes to spike by 20% to 50%, while major outages might increase demand by 5 to 10 times [2]. Instead of relying on a single forecast, create scenario-based staffing plans. Develop "best case" and "worst case" models to prepare for different outcomes – such as a smooth release versus one with significant bugs.
To handle weekday volume fluctuations, stagger shifts and use support level management to manage intraday peaks effectively. Proactive customer communication can also help reduce the post-release ticket load. For example, sending out detailed release notes or customer emails has been shown to cut ticket volume in half [2], easing the strain on your support team.
Use AI to Improve Staffing Accuracy
AI-powered forecast models can take the guesswork out of staffing decisions. These tools provide the precision needed to address the challenges faced by the 47% of workforce management teams still relying on spreadsheets and intuition [1]. Regularly track your forecasting accuracy by comparing predicted versus actual ticket volumes and calculating the Mean Absolute Percentage Error (MAPE). A MAPE below 10% is a solid benchmark for support data, while anything under 5% is exceptional [1]. If your MAPE exceeds 15%, it indicates high variability, and you should plan for wider uncertainty buffers in your staffing.
Modern platforms that integrate signals from your CRM, product analytics, and project management tools can boost prediction accuracy from 74% to 86% [6]. This level of precision allows you to make data-driven staffing decisions with confidence. With 40% of support operations leaders identifying forecasting accuracy as their top priority for 2025 [1], adopting AI-driven tools is no longer optional – it’s a necessity for staying ahead in a competitive environment.
Conclusion
Predicting ticket volume for B2B products with extended case cycles doesn’t have to be a guessing game. A structured approach – rooted in clear objectives, clean historical data, and AI-powered tools – can turn raw patterns into practical staffing strategies. By defining precise forecasting horizons, businesses can transform ticket data into well-supported plans that leadership can confidently back.
The process begins with reliable, high-quality historical data spanning 12–24 months. This data helps identify seasonal trends and recurring patterns. Cleaning the dataset – removing test tickets and duplicates – is crucial to prevent distorted projections. Additionally, linking ticket volume to specific triggers, such as product launches, outages, or marketing pushes, helps differentiate between organic growth and temporary spikes. This allows for scenario-based planning rather than reacting to fluctuations after the fact.
AI tools further refine these forecasts by providing dependable confidence intervals. For support data, a Mean Absolute Percentage Error (MAPE) below 10% is considered strong, while anything under 5% is exceptional [1]. These tools enable planning around the upper edge of an 80% confidence interval, ensuring readiness for most situations without overcommitting resources to rare extremes.
The ultimate aim is to turn forecasts into staffing strategies that strike a balance between cost control and SLA performance. With U.S. support agent rates ranging from $28 to $38 per hour [1], every full-time equivalent (FTE) decision carries weight. By applying formulas like (Tickets × AHT) / (Agent Capacity × Occupancy) and updating forecasts monthly, you can create a proactive, data-informed support operation capable of managing the challenges of long-cycle B2B cases.
FAQs
How do I forecast when ticket volume is low or highly variable?
To predict periods of low or fluctuating ticket volume, start by examining 2–3 years of historical data. This helps uncover patterns, seasonal trends, and any irregularities. Pay close attention to daily, weekly, and seasonal cycles, and factor in events like product launches, holidays, or marketing campaigns that might influence ticket demand.
For analysis, you don’t need overly complex tools. Simple statistical methods, such as time series or trend analysis, can effectively highlight fluctuations. This allows you to adjust staffing levels in advance – ensuring you have enough coverage during busy times while avoiding overstaffing during slower periods.
How should I account for reopens, follow-ups, and backlog in my forecast?
To predict ticket volume with precision, divide the total volume into three categories: new requests, backlog carryover, and reopened tickets. Including reopens and follow-ups as new demand can distort your projections.
Start by exporting ticket data, categorizing it by type, and using this breakdown to forecast based on actual demand. Keep an eye on backlog separately to prevent inflating demand estimates. This approach helps align staffing plans with real customer needs, minimizing inefficiencies in operations.
What’s the simplest way to turn my ticket forecast into an FTE headcount plan?
To turn your ticket forecast into an FTE headcount plan, you’ll need to factor in ticket volume, average handle time (AHT), agent availability, and occupancy rates. Here’s how:
- Calculate workload: Multiply your forecasted ticket volume by the AHT. This gives you the total workload in hours.
- Determine required hours: Divide the total workload by the number of available agent hours, accounting for shrinkage (like breaks, training, or time off) and occupancy rates.
- Refine for operational needs: Make adjustments to address any expected fluctuations or specific business requirements to finalize your staffing plan.
This process ensures your team is properly equipped to handle the forecasted demand.