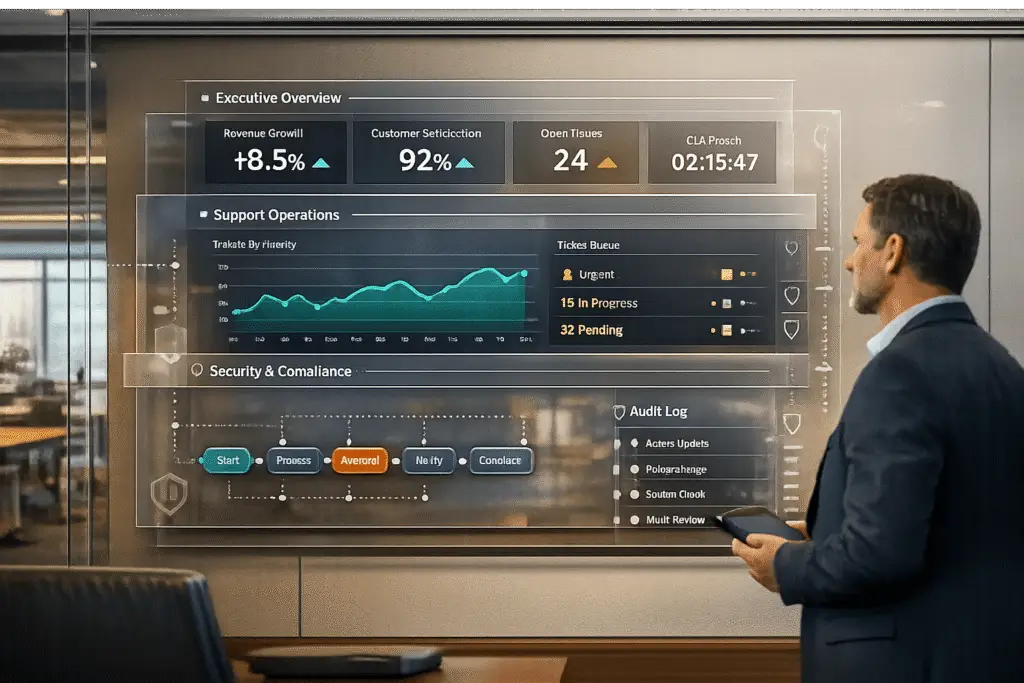
Enterprise clients need reporting systems that provide real-time insights, tailored dashboards, and secure access to support their complex operations. These systems must offer high-level summaries for executives, actionable metrics for managers, and granular data for analysts – all while maintaining strict data security and compliance standards.
Key Takeaways:
- Metrics to Include: First response time, resolution rates, AI containment, CSAT, customer churn, and support cost as a % of revenue.
- Customization: Role-based dashboards ensure executives see trends, while managers and agents access detailed performance data.
- Security: Implement role-based access control (RBAC), IP allowlisting, and compliance measures (e.g., HIPAA, GDPR).
- Automation: Use scheduled report deliveries and alerts for key performance indicators.
- Scalability: Real-time and historical reporting must handle thousands of daily interactions without lag.
By combining real-time data, customized views, and automated workflows, you can build a reporting system that meets the demands of enterprise clients while driving informed decision-making.
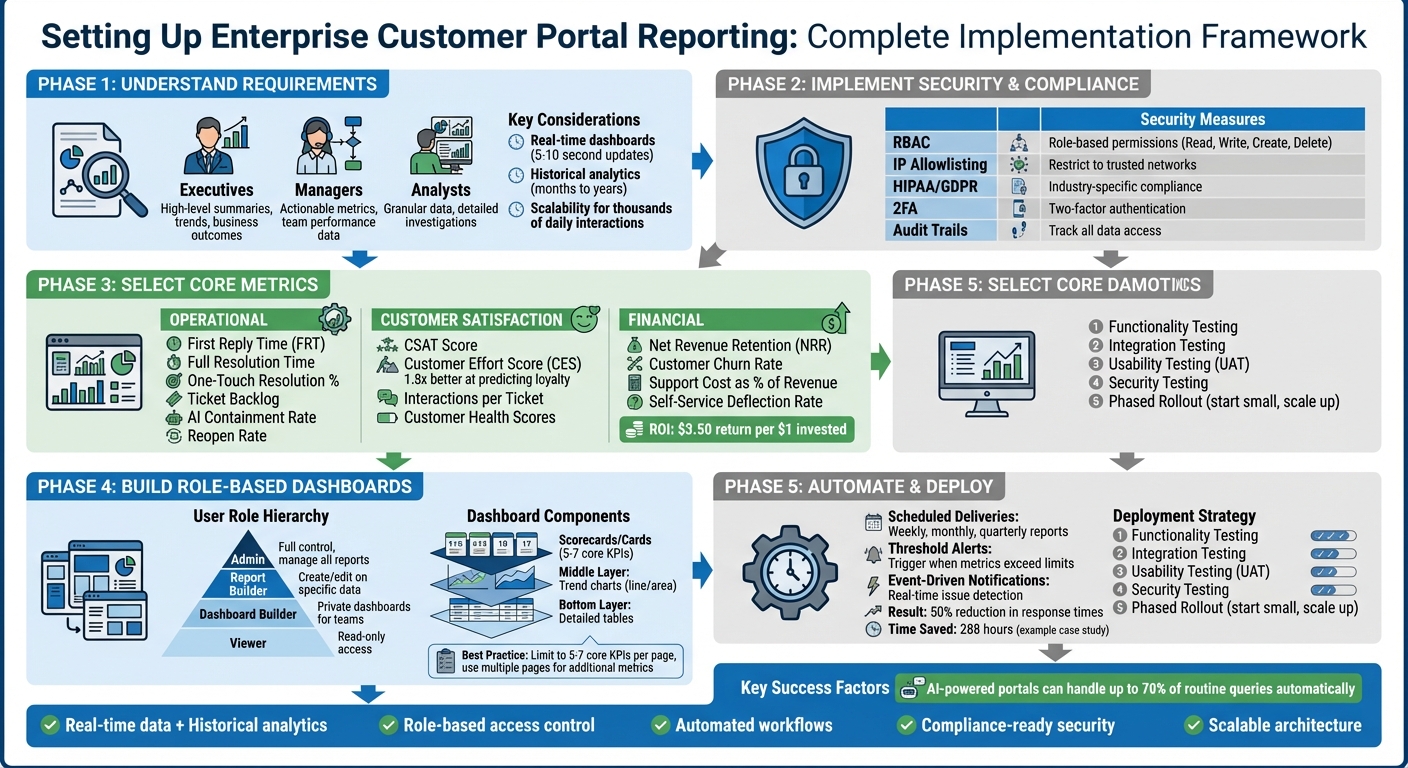
Enterprise Customer Portal Reporting Setup: 5-Phase Implementation Framework
Understanding Enterprise Client Reporting Requirements
When building AI-powered support systems for enterprise clients, your reporting framework needs to strike a balance between delivering detailed insights and maintaining ease of use, all while upholding strict security standards. Enterprise reporting must cater to diverse audiences: executives looking for high-level summaries, managers seeking actionable metrics to guide their teams, and analysts who need granular data to solve specific challenges. The key is to design a reporting system that offers tailored views for each group, ensuring performance and security remain top priorities. This approach lays the groundwork for deeper dives into operational and compliance considerations.
Scalability is another critical factor for enterprise systems, especially when managing thousands of daily support interactions. These systems must support both real-time dashboards – updating every 5 to 10 seconds – and historical analytics that track trends over months or even years. Instead of relying on a single, massive database, enterprises often organize data into smaller, focused datasets (e.g., Support, Talk, Chat, AI) for faster and more relevant queries. Monitoring compute demand and query volumes is essential to prevent performance issues caused by complex custom reports. At the same time, stringent security measures must be in place to protect sensitive data.
Security goes beyond simple passwords. Implement Role-Based Access Control (RBAC) to assign specific permissions – Read, Write, Create, Delete – based on data type, such as real-time routing insights or historical analytics. Use IP allowlisting to limit dashboard access to trusted networks. For industries like healthcare or finance, compliance with regulations like HIPAA dictates how data is stored, accessed, and displayed.
Combining Executive Overviews with Detailed Operational Data
The best enterprise reporting systems use a layered approach, offering different levels of detail depending on the user’s role. Executives need high-level summaries that highlight overall performance trends, customer satisfaction scores, and how support operations impact business outcomes. These views should answer questions like, "Are we meeting our SLAs?" or "How does support performance influence customer renewals?" – without bogging them down with granular ticket details.
On the other hand, operational teams require the ability to dig into specifics, such as individual ticket IDs, agent interactions, or customer feedback. To meet these needs, your reporting system should combine Metrics (quantitative KPIs like ticket volume or response times) with Attributes (qualitative details like ticket tags or assignee names). This approach allows managers to spot trends – like recurring issues with a specific product feature – and then investigate individual cases to uncover root causes.
Dashboard performance is a critical consideration when implementing these layered views. Overloading a single page with more than 20 metrics or tiles can slow down load times. Instead, use linked pages or supplementary dashboards to present high-density data without sacrificing speed.
Meeting Compliance and Data Security Requirements
Compliance requirements significantly shape how enterprise reporting systems are built. Different industries face unique regulatory challenges, and your system must be designed to meet these standards from the outset. For example, healthcare organizations handling Protected Health Information (PHI) must adhere to HIPAA regulations, which mandate specific data handling and access protocols. Similarly, financial services firms often need to maintain audit trails that track who accessed customer data and when.
Granular permission management plays a crucial role in ensuring both security and compliance. Assign roles like "Analytics Report Author", "Supervisor", or "Analyst", each with clearly defined access levels. To simplify permission management as your organization grows, use security groups (e.g., Microsoft Entra ID) instead of individual service accounts. Additionally, configure dashboard sharing settings to control whether data can be accessed externally, and regularly audit permissions to ensure users only have access to what they need.
Network security is equally important. For organizations operating across multiple regions, staying compliant with evolving privacy laws requires constant vigilance. Make sure your team consults privacy resources regularly and updates configurations as regulations change.
| Security Measure | Implementation Method | Primary Benefit |
|---|---|---|
| IP Allowlisting | Restrict access to specific network addresses | Prevents unauthorized access from unknown locations |
| RBAC | Assign roles like "Analytics Report Author" | Ensures users only see data relevant to their responsibilities |
| HIPAA Configuration | Enable specific settings for PHI | Maintains compliance with healthcare regulations |
| Dataset Permissions | Control which data sources each role can query | Reduces risk of sensitive data exposure |
| Activity Monitoring | Use audit features to track dashboard access | Provides transparency and accountability for data usage |
Core Metrics and KPIs for Enterprise Portal Reporting
When creating secure and compliant reporting systems, picking the right metrics is key to gaining insights that lead to action. Metrics focused on operational efficiency, customer experience, and financial outcomes are particularly impactful, especially in AI-driven systems that promise cost-effective, real-time data.
Operational Metrics for Support Teams
Operational metrics help support teams improve response times and overall efficiency.
- First Reply Time (FRT) measures the time between a ticket’s creation and the first response. Targets should vary by channel – for instance, 24 hours for email and 60 minutes for social media.
- Full Resolution Time tracks the total duration from ticket creation to resolution, while One-Touch Resolution indicates the percentage of tickets resolved with a single agent response. A high one-touch resolution rate might suggest that simpler issues could be handled through self-service tools.
- Requester Wait Time focuses on how long customers actually wait during the ticket process. Unlike internal tracking, this metric reflects the customer’s experience.
- Ticket Backlog monitors unresolved tickets across statuses like New, Open, Pending, or On-hold. Pair this with ticket age and priority to ensure critical issues aren’t being delayed.
- Reopen Rate measures the percentage of tickets reopened after being marked resolved. High rates often indicate agents are rushing to close tickets instead of solving issues thoroughly.
AI-specific metrics like AI Containment Rate measure how often AI resolves issues without human intervention. This showcases the ROI of automation and highlights which problems are best suited for self-service. Additionally, setting up alerts for "Bad" satisfaction ratings allows managers to step in quickly.
Customer Satisfaction and Retention Metrics
These metrics help identify pain points and predict customer loyalty.
- CSAT (Customer Satisfaction) provides direct feedback on the support experience. However, a high CSAT score with a low response rate might not reflect the broader customer sentiment. Tracking CSAT trends can reveal recurring friction points.
- Customer Effort Score (CES) measures how easy it was for customers to resolve their issues. Research shows CES is 1.8 times better than CSAT at predicting loyalty. High-effort experiences lead 96% of customers to become disloyal, while low-effort interactions drive loyalty for 94%.
- Interactions per Ticket counts the number of touchpoints needed to resolve a single issue. Higher interaction rates often signal complex problems or gaps in knowledge.
- Customer Health Scores combine various signals – like product usage, support interactions, and satisfaction ratings – to predict renewals and flag accounts at risk of churning.
Financial and Business Outcome Metrics
These metrics connect support performance to overall business results, making them crucial for demonstrating value to stakeholders.
- Net Revenue Retention (NRR) tracks revenue changes from existing customers after factoring in churn, downgrades, and upsells.
- Customer Churn Rate measures revenue loss due to departing customers, highlighting whether support efforts are effectively retaining clients.
- Support Cost as a % of Revenue compares support expenses to client revenue. Prioritize resolution quality over speed metrics like Average Handle Time to avoid repeat contacts and long-term cost increases.
- Self-Service Deflection Rate assesses how well the portal resolves issues without agent help. Calculate it by dividing total help center sessions by the number of ticket users – higher ratios (like 4:1) indicate better deflection.
Investing in AI-powered support can yield impressive returns, with an average $3.50 gained for every $1 spent. Top-performing organizations even see up to 8x ROI. Improving First Contact Resolution (FCR) is another game-changer: it can cut churn by 67%, and every 1% improvement in FCR reduces operating costs and boosts customer satisfaction by 1% each.
Setting Up Role-Based Access and User Permissions
Role-based access is a cornerstone of enterprise reporting. It ensures that executives get high-level overviews, managers dive into operational details, and support agents focus on personal performance metrics – all while keeping sensitive financial and proprietary data secure.
Defining User Roles and Permission Levels
Before adding users, establish a well-structured framework for security roles. Most enterprise portals organize access into three layers: user types (license-level access), roles (categorized by work type), and privileges (specific rights to perform tasks).
The typical reporting hierarchy includes:
- Viewers: Users with read-only access to shared reports and dashboards.
- Report Builders: Authorized to create and edit reports using designated data objects.
- Admins: Granted full access, including managing reports and dashboard visibility.
In B2B settings, permissions often operate at three levels:
- Individual: Access limited to items assigned to a specific contact.
- Company-wide: Access covering all data within an organization.
- Project-based: Access restricted to specific project folders or data segments.
To simplify management, group permissions into bundles for departments or stakeholder groups (e.g., executives, support managers). Then, map these groups to specific data objects like "All Objects", "Specific Objects", or "CRM-specific data." Tools like "Viewing As" features let you preview the portal from a non-admin perspective, ensuring permissions and data masking work as intended before deployment. These steps help create a secure and efficient reporting environment.
Restricting Access to Sensitive Data
With roles defined, move on to enforcing data restrictions to safeguard critical information. Start by setting up an "Anonymous" role with no default permissions, controlling what users see when accessing the portal without logging in. Add a boolean field (e.g., "Show on Portal") at the record level to filter what content is displayed, ensuring only validated, non-sensitive items are accessible.
Fine-tune permissions by granting specific abilities – such as creating, deleting, or sharing content – rather than broad access. For instance, disabling "Share Reports Publicly" minimizes the risk of data leaks, especially for users dealing with confidential information. In hierarchical organizations, account structures modeled with parent-child relationships allow executives to view consolidated data while restricting local managers to site-specific details. To further enhance security, enable two-factor authentication (2FA) and conduct regular audits of data access.
| Role Type | Access Level | Primary Function |
|---|---|---|
| Viewer | Read-only | Consuming dashboards and pre-built reports |
| Report Builder User | Restricted Create/Edit | Building reports on specific, assigned data objects |
| Dashboard Builder User | Private Creation | Creating private dashboards for personal/team use |
| Admin | Full Control | Managing all reports, assigning data, and controlling visibility |
Building Customizable Dashboards and Data Visualizations
Once you’ve secured permissions, the next step is crafting dashboards that actually drive action. Different stakeholders in an enterprise need tailored views of the same data. For instance, executives typically look for high-level scorecards, managers focus on trends, and support agents require detailed performance metrics. The trick is creating a layered visualization hierarchy that caters to all these needs without overwhelming anyone with irrelevant data. By using predefined user roles, you can ensure dashboards deliver the right metrics to the right people – executives, managers, or agents – while maintaining secure, role-based access.
Configuring Real-Time Dashboards
Real-time dashboards are game-changers for enterprise teams, enabling them to monitor live performance and act quickly when things go off track. Unlike traditional analytics that refresh data once a day, real-time dashboards use DirectQuery or TDS (Tabular Data Stream) connectors to pull live data directly from the database. This ensures the dashboard reflects the most current information, which is crucial for keeping tabs on intraday metrics.
Start by adding live data widgets to track key elements like agent availability, active conversations, and queue wait times. Set up alert thresholds so the dashboard visually flags when performance metrics fall below acceptable levels. For example, if your SLA requires responses within 150 seconds, configure a visual alert to trigger when wait times exceed that limit. To keep these dashboards running efficiently, set automatic page refresh intervals to 5–10 seconds for operational teams, who need constant updates. However, avoid applying these frequent refresh rates to executive dashboards – they don’t need second-by-second updates, and it can unnecessarily strain system resources.
To keep things running smoothly, separate real-time and historical data models. Real-time models should focus on current operational metrics, while historical models handle trend analysis and long-term planning. This division ensures that dashboards perform well and serve their intended purposes without compromising usability.
Tailoring Visualizations for Different Stakeholders
Once real-time monitoring is in place, the next step is customizing visualizations for specific roles. Every stakeholder benefits from a different perspective, and role-specific widgets and drill-down options make this possible. A top-down layout works well: start with Card visuals (or Scorecards) at the top to highlight single-number KPIs like Total Tickets, Average Resolution Time, or CSAT scores. These provide executives with quick insights. Below the cards, include trend charts (line or area charts) to show performance over time, and round it out with detailed tables for managers and analysts who need granular data for decision-making.
Interactive features like Slicers and Filters make dashboards even more useful. A date slicer, for instance, allows users to toggle between time frames without needing multiple reports. Cross-filtering lets users click on a category – like a specific support queue – and see all related visuals automatically adjust. This makes it easy to zoom in from a high-level view to detailed analysis. For comparing performance across teams or regions, multi-chart displays are invaluable. These side-by-side comparisons allow users to quickly identify gaps or inconsistencies.
Be mindful not to overload a single page with too much data. Stick to 5–7 core KPIs that align with business objectives, and distribute additional metrics across multiple pages. Dashboards crammed with charts might look impressive but often fail to provide actionable insights.
| Component Type | Purpose | Best For |
|---|---|---|
| Scorecards / Cards | High-level overview | Total volume, Average CSAT, SLA compliance % |
| Line / Area Charts | Trend analysis | Ticket volume over time, performance vs. demand |
| Bar / Column Charts | Categorical comparison | Tickets by channel, issue types, regional performance |
| Tables | Detailed insights | Agent leaderboards, ticket IDs, sortable raw data |
Lastly, add a feature that allows users to bookmark filtered views. This way, they can quickly return to the most relevant data without reapplying filters every time. For example, a supervisor might bookmark a view filtered to their team’s stats, while an executive bookmarks a company-wide summary. This saves time and ensures users can focus on analyzing data rather than setting up the dashboard repeatedly.
sbb-itb-e60d259
Automating Reporting Workflows
Manual reporting eats up valuable time and often causes delays. By automating reporting workflows, your team can shift from scrambling to gather data to delivering timely, actionable insights. This ensures stakeholders consistently get the information they need while eliminating repetitive tasks and keeping reports uniform and reliable.
Modern platforms make this easier with tools like scheduled deliveries and threshold-based alerts. Scheduled deliveries handle routine updates, such as weekly executive summaries, monthly performance reviews, or quarterly business outcome reports. Meanwhile, threshold-based alerts notify you when critical metrics hit concerning levels. Together, these features turn static reporting into a dynamic, real-time support system for decision-making. Plus, automated workflows integrate seamlessly with customizable dashboards, ensuring insights are always cohesive and up-to-date.
Scheduling Automated Report Delivery
Setting up recurring deliveries aligned with your stakeholders’ review cycles is key. For instance, managers might need weekly operational updates, leadership teams may require monthly executive summaries, and strategic planners often rely on quarterly business reviews. With your platform’s "Schedule delivery" feature, you can ensure reports land exactly when they’re needed – whether that’s early in the workweek or at the start of a new month or quarter.
Tailoring the content of these reports to your audience is equally important. Executives generally prefer concise scorecards that spotlight trends in areas like customer satisfaction, resolution times, and costs, instead of lengthy, detailed breakdowns. On the other hand, managers benefit from more granular data to fine-tune team performance and workflows. Using role-based delivery filters ensures each recipient gets only the information that’s relevant to their role, cutting down on information overload and boosting engagement with the reports.
During the 2024 tax season, Sophie Montgomery of TaxAssist Accountants saved 288 hours by using automated reminder and document management features in their client portal. This automation sped up data uploads by eliminating repetitive follow-ups, leading to a 50% reduction in overall response times.
These automated workflows also work hand-in-hand with AI-driven insights. This ensures that both high-level trends and immediate operational updates are seamlessly integrated into your reporting system. If more in-depth data is needed, consider breaking it into multiple reports or using drill-down features to provide additional details on demand.
Configuring Alerts and Notifications
After scheduling deliveries, the next step is setting up alerts to catch critical issues as they happen. Threshold-based alerts act as an early warning system for your reporting setup. For example, you can configure alerts for key metrics like queue wait times, ticket volume spikes, or SLA compliance rates. If your SLA requires responses within a specific timeframe, setting an alert slightly below that target gives you a chance to intervene before a breach occurs. These alerts should go directly to the team members who can take immediate action – whether it’s team leads for operational concerns, executives for broader issues, or technical staff for system performance problems.
Event-driven triggers add another layer of responsiveness by sending notifications the moment data changes. Instead of waiting for the next scheduled report, stakeholders can act immediately when an issue arises. For example, if your AI containment rate (the percentage of inquiries resolved without human assistance) suddenly drops, real-time alerts allow you to quickly investigate potential causes, such as gaps in the AI’s knowledge base, technical glitches, or shifts in customer behavior.
To prevent overwhelming your team with notifications, set thresholds that only trigger alerts when multiple incidents occur within a short timeframe. This helps identify systemic problems rather than isolated events.
Additionally, complement email notifications with visual indicators in your customer portal. For instance, "pending request" banners or red-dot notifications on the homepage ensure that critical updates are hard to miss, even if an email goes unread. Organizations that use automated reminders and real-time updates in their portals have reported a 50% reduction in response times, highlighting the real-world benefits of a well-designed notification system.
Testing, Validating, and Deploying Enterprise Reporting
Before rolling out your reporting system to enterprise clients, thorough testing is essential. It helps avoid costly mistakes and ensures stakeholders can rely on the data they see. Skipping this step risks user frustration, incorrect insights, and a loss of trust. A structured validation process paired with a phased rollout helps minimize disruptions and sets the stage for long-term success.
Testing and Validation Steps
Start with functionality testing to confirm that key features – like user registration, login, search capabilities, and report generation – work as expected. Then, move on to integration testing to ensure data flows smoothly between your system and existing platforms like ERP or CRM. Even minor discrepancies in this step can erode user confidence.
Usability testing is another critical step. It examines how real users interact with the reporting interface. Bring in representatives from various groups – executives, managers, and support teams – to pinpoint any navigation or clarity issues. In fact, over 3,000 businesses, including 75 Fortune 100 companies, use specialized platforms to gather real-user feedback and validate features. Don’t forget performance and scalability testing to confirm your system can handle high traffic without breaking a sweat.
Security is just as important as functionality. Run security and compliance testing to identify vulnerabilities like SQL injection or cross-site scripting (XSS). Make sure encryption and authentication measures are in place to safeguard sensitive data. Wrap up with User Acceptance Testing (UAT) by involving a select group of users. This group can verify that the system meets business needs and catch any overlooked issues before the full launch.
"A test report is a summary of testing objectives, activities, and results to help stakeholders better understand both the testing and the product quality." – Eran Kinsbruner, Lead Software Evangelist, Perfecto
Use features like "Preview report" or "Preview site" to let stakeholders review layouts and data accuracy before going live. Tools like "Save as new" or cloning options let users experiment with different visualizations without affecting live dashboards. To keep the process objective, define clear goals, hypotheses, and metrics for each test upfront.
Once testing confirms the system’s readiness, move forward with a phased rollout to integrate the solution into live operations.
Phased Rollout Approach for Enterprise Organizations
Launching your reporting system in phases instead of all at once reduces risks and provides opportunities to tweak the system based on feedback. A phased rollout builds on rigorous testing and ensures smoother adoption. Start by organizing your workspace into two areas: a "managed workspace" for the core data model and a "customer workspace" for report copies. This setup allows developers to make edits and test reports without disrupting the main data architecture.
Begin by granting "Write" permissions to report authors and developers so they can build and validate content. Once everything is verified, extend "Read" or "Viewer" permissions to supervisors and general users. When configuring enterprise data models, account for setup time to avoid delays.
Roll out customized reports incrementally, prioritizing those that meet the most pressing stakeholder needs. This is particularly important if your system has limits on how many reports it can support. Use a dedicated service account for deploying data models and making workspace changes, which ensures consistency and avoids dependencies on individual user accounts.
Throughout the rollout, monitor performance closely. Use the same benchmark tests from validation to track load times and identify any bottlenecks caused by complex measures. Performance analyzer tools can help pinpoint issues before scaling to a larger audience. Keep an eye on capacity consumption to prevent overloads that could disrupt operations for other teams. Uber followed a similar phased strategy during its early days, launching in limited areas first. This approach allowed them to refine their model using early user feedback before expanding globally.
Even after deployment, continue monitoring performance, usage, and feedback. This ongoing attention ensures your reporting system adapts to meet the evolving needs of your enterprise clients.
Conclusion
Enterprise reporting thrives on combining strategic integration, comprehensive account insights, and automation. Begin by merging CRM and support data to craft a full view of the customer journey. This includes details like product usage, renewal timelines, and ticket history. With this unified perspective, teams can shift from merely reacting to issues to delivering proactive, tailored support efforts.
Prioritize account-level metrics that align with broader business goals. Create reports that adapt to dynamic SLAs based on contract specifics or account importance. Dashboards should offer transparency, laying the groundwork for long-term trust and collaboration.
Automation is a game-changer for enterprise reporting. By automating data collection, scheduling report deliveries, and leveraging AI-driven insights, you can reduce manual tasks while boosting accuracy and consistency. For instance, a well-designed portal using AI can handle up to 70% of routine queries, turning historical data into actionable insights and even transforming tickets into knowledge base articles.
Tailor your dashboards to the needs of different roles. Executives might need broad trends, while support managers require granular metrics. Role-based access controls ensure sensitive data remains secure while delivering relevant insights to the right people. Enterprise reporting becomes a powerful tool when it provides timely, precise information to spot trends, mitigate risks, and uncover growth opportunities.
Lastly, prioritize security throughout the process. Implement audit trails and compliance measures to meet regulations like GDPR. By blending unified data, account-specific metrics, automated workflows, and role-based insights, you’ll create a scalable reporting system that delivers measurable results across your organization.
FAQs
What security measures should be in place for enterprise reporting systems?
To keep enterprise reporting systems secure, it’s essential to adopt measures that safeguard sensitive data and block unauthorized access. One effective approach is using role-based permissions, which let administrators control access based on a user’s specific responsibilities. This ensures that only the right people can view or interact with certain data.
Adding Single Sign-On (SSO) and multi-factor authentication (MFA) provides an extra layer of protection by requiring multiple steps to verify user identities. These tools make it harder for unauthorized users to gain access, even if passwords are compromised.
Another critical step is encrypting data both at rest and in transit. This helps prevent breaches or interception, particularly when handling sensitive enterprise information. Tools like IP restrictions and network access controls can further tighten security by allowing access only from trusted networks or locations.
By combining these strategies, you can build a secure framework for enterprise reporting systems while adhering to industry standards.
How can automation make customer portal reporting more efficient?
Automation streamlines customer portal reporting by taking over repetitive tasks, minimizing human error, and ensuring data accuracy. With automated processes, reports are collected, processed, and delivered automatically, keeping information consistent and up-to-date. This shift allows support teams to spend more time analyzing insights rather than manually compiling data.
Another key advantage is the ability to pull data from various sources, like CRM platforms and support systems, to build real-time, detailed reports. For enterprise clients, this means quick access to essential metrics such as support performance, customer satisfaction, and bottlenecks in operations. By automating these processes, organizations can maintain uniform data presentation and produce reliable insights that drive smarter decisions.
What are the key metrics for measuring customer satisfaction and retention?
To gauge customer satisfaction and retention effectively, keep an eye on these key metrics:
- Customer Satisfaction Score (CSAT): This measures how happy customers are with their support experiences. It’s a straightforward way to understand their overall satisfaction levels.
- Net Promoter Score (NPS): NPS reveals customer loyalty by asking how likely they are to recommend your business. A higher score often means better retention rates.
- First Response Time: Speed matters. The quicker you respond to customer inquiries, the more satisfied they tend to be, which can also help reduce churn.
By monitoring these metrics through your customer portal reporting, enterprise support teams can spot areas for improvement, strengthen loyalty, and keep churn to a minimum.
Related Blog Posts
- How do you set up a customer portal that supports role-based access and multiple customer teams?
- How do you create a self-serve portal customers will actually use?
- What should an enterprise support readiness checklist include (before you sell bigger deals)?
- How do you design role-based customer portals for B2B (multiple users, permissions, reporting)?