

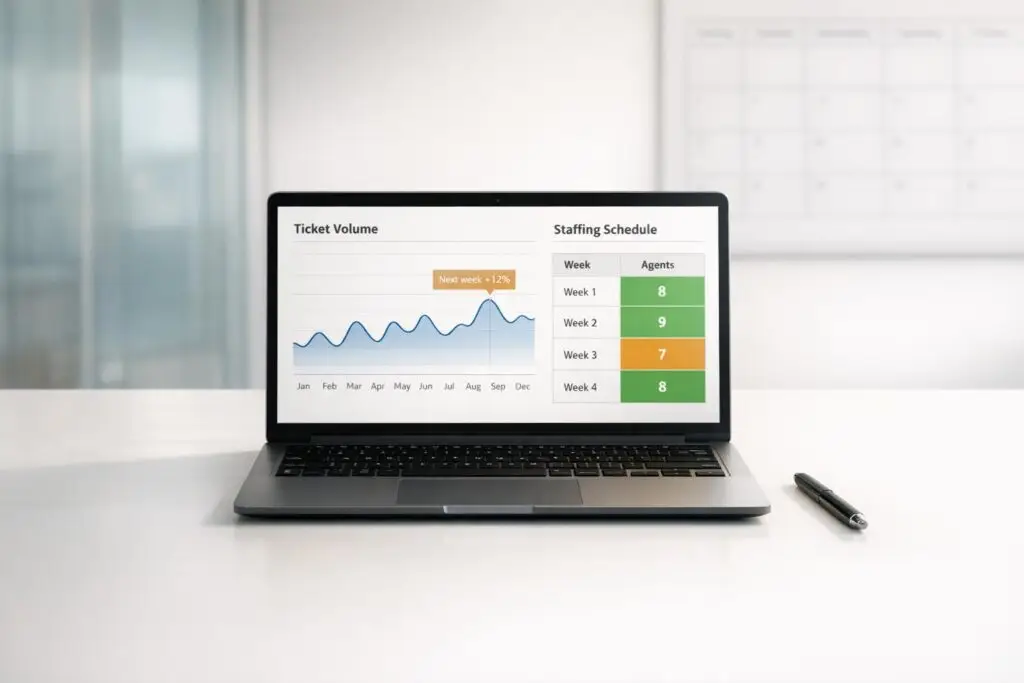
Forecasting ticket volume and staffing doesn’t require expensive tools. Here’s how you can use basic methods – like spreadsheets and historical data – to predict demand, avoid overstaffing, and prevent overwhelmed agents.
Key Steps:
- Collect Historical Data: Use at least 2-3 years of customer support data (ticket volume, handle time, staffing levels, etc.) for accurate analysis.
- Identify Patterns: Analyze trends (daily, monthly, seasonal) to understand peak times and demand fluctuations.
- Estimate Workload: Multiply forecasted ticket volume by average handle time (AHT) to calculate total workload.
- Calculate Staffing Needs: Use workload, agent availability, and occupancy rates to determine how many agents are required. Adjust for shrinkage (e.g., breaks, absences).
- Account for Events: Factor in product launches, campaigns, or holidays that could impact ticket volume.
By following these steps, you can build a reliable forecast that balances staffing levels, reduces costs, and improves customer satisfaction – all without fancy tools.
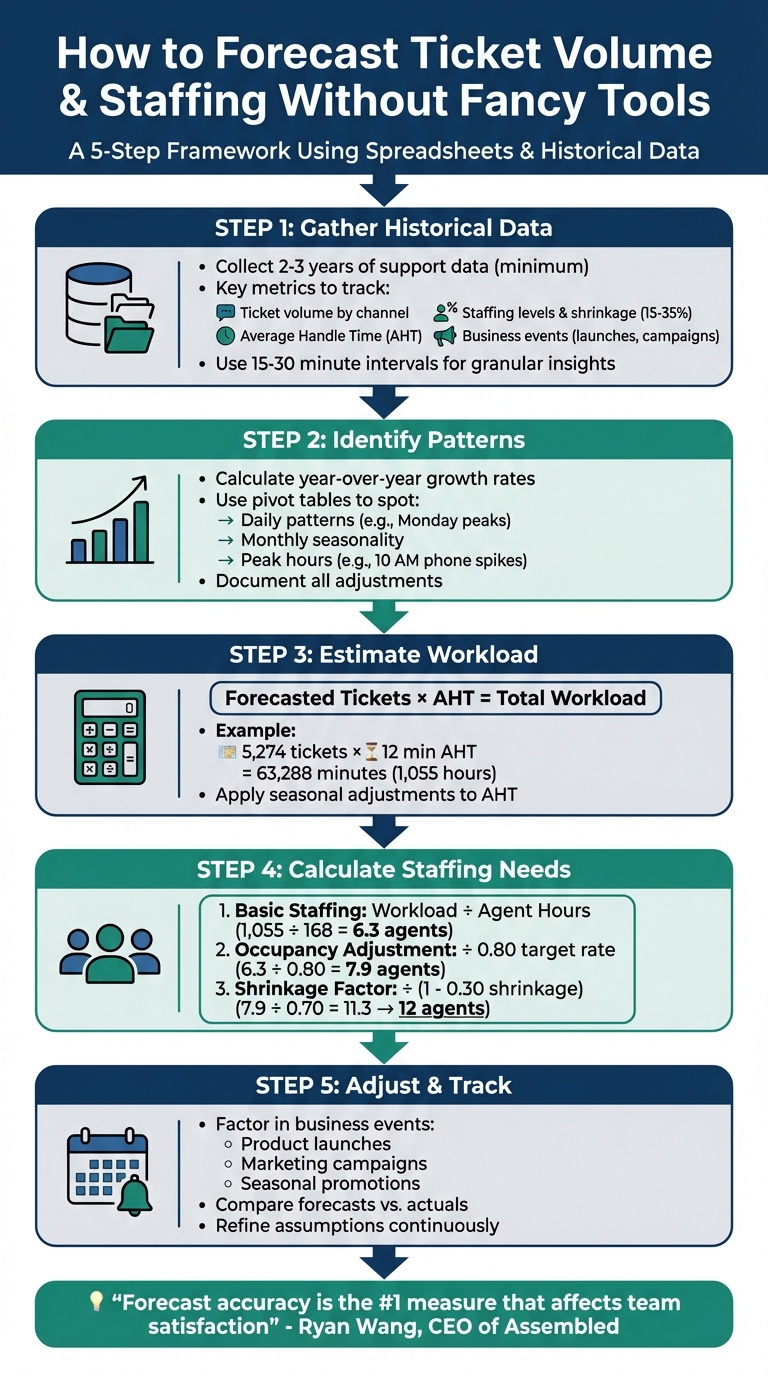
5-Step Process for Forecasting Ticket Volume and Staffing Without Expensive Tools
Excel Demo of Call Center WorkForce Management (WFM) with Tickets, Calls and Site Visits.
Step 1: Gather and Organize Your Historical Ticket Data
Before diving into forecasting, you’ll need to collect and organize your historical support data. Most of this information is likely stored in your support system, so start by extracting it and arranging it for analysis.
Find the Key Data Points You Need
Pull your support data from sources like ticket logs, CRM platforms, or WFM systems. These tools often let you export data into CSV files, which are ideal for spreadsheet-based analysis. To accurately identify seasonal trends and growth patterns, aim for at least 36 months of historical data. If that’s not feasible, two years is a solid starting point, though even two weeks of data can provide some insights.
Focus on gathering these key metrics:
| Data Category | Specific Metrics | Why It Matters |
|---|---|---|
| Volume | Total tickets, volume by channel, abandoned calls | Reflects actual customer demand |
| Efficiency | Average Handle Time (AHT), First Response Time (FRT) | Indicates workload per ticket |
| Staffing | Headcount, shrinkage (vacation, sick days, training) | Helps calculate agent requirements |
| Context | Marketing dates, product launches, system outages | Explains historical demand fluctuations |
| Drivers | Active users, shipments, orders, revenue | Projects future volume based on growth |
Channel-specific data is critical. Different channels – like phone, email, and chat – follow unique patterns. For instance, phone calls might peak at 10:00 AM, while email requests trickle in throughout the day. Be sure to include abandoned calls in your phone data to capture the full scope of demand. For written support like emails, track "total outbound interactions" instead of just "resolved tickets" to account for follow-ups.
For the most accurate insights, collect data in 15-minute or 30-minute intervals. This level of granularity helps identify peak hours and intraday trends, with 96 intervals in a standard day for 15-minute tracking. Additionally, don’t overlook shrinkage – time agents spend on breaks, training, or sick leave – which typically falls between 15% and 35% in most industries.
With these metrics in hand, you’ll have a solid foundation for building your forecast and staffing models.
Clean Up Your Data and Fill in Gaps
Once you’ve gathered your data, it’s time to clean it up. Start by identifying and flagging outliers, such as one-off events like system outages, major marketing pushes, or product launches that caused unusual spikes. If left unaddressed, these anomalies can distort your averages.
Next, look for missing data caused by system errors or gaps in tracking. Fill these gaps with zeros or averages from similar periods to maintain a continuous timeline. Also, check for formatting issues – like misplaced punctuation – that could disrupt spreadsheet calculations.
Standardize your data to a single timezone (e.g., UTC) to avoid discrepancies when merging datasets from different regions. It’s also essential to establish a company-wide definition of what counts as a "ticket." Decide whether to include social media mentions or internal follow-ups to ensure consistent reporting.
Finally, coordinate with your Finance or FP&A team monthly to align your support forecasts with broader company sales and growth goals. Amanda M., a finance leader at ArenaCX, emphasizes the importance of collaboration:
As a finance leader, I will say that I always appreciate when leaders in other areas of the business bring their knowledge of their operating area to help me improve our company-wide forecast.
Once your historical data is cleaned, organized, and standardized, you’ll be ready to dive into identifying trends and patterns in the next step.
Step 2: Find Patterns Using Spreadsheets
Now that your historical data is cleaned and ready, it’s time to dig into the numbers to uncover patterns that will shape your forecast. This step doesn’t require fancy tools – basic spreadsheet functions will do the job.
Calculate Averages and Growth Rates
Start by determining your baseline growth rate. You can calculate the year-over-year (YoY) percentage change in ticket volume with this simple formula:
(Current Year Volume – Previous Year Volume) / Previous Year Volume.
For example, if your YoY growth rates are 4.0% and 3.8% over two years, the average growth rate would be 3.9%. This average becomes the foundation for your forecast.
Here’s how it looks in practice:
| Year | Volume | Y/Y Growth (Units) | Y/Y Growth % |
|---|---|---|---|
| 2023 | 50,000 | – | – |
| 2024 | 52,000 | 2,000 | 4.0% |
| 2025 | 54,000 | 2,000 | 3.8% |
| 2026 (Forecast) | 56,106 | 2,106 | 3.9% (Avg) |
Next, identify monthly distribution percentages to account for seasonality. Divide the average ticket volume for each month by the average annual total. For instance, if January typically receives 5,000 tickets out of 52,000 for the year, January accounts for approximately 9.4%. Use these percentages to distribute your annual forecast across months.
You can apply the same logic to forecast Average Handle Time (AHT) by using growth rates and monthly patterns, ensuring your workload projections stay aligned.
Once you’ve nailed down these baseline metrics, shift your focus to spotting recurring patterns.
Spot Seasonal and Daily Patterns
Pivot tables are your best friend here. Use them in Excel or Google Sheets to group your historical data by "Day of Week" or "Month." This will help you identify trends, such as higher ticket volumes on Mondays compared to Fridays, or seasonal dips in December followed by peaks in March.
For more granular insights, break your data into 15- or 30-minute intervals to find peak hours. For example, you might discover that phone inquiries spike around 10:00 AM, while email tickets spread out more evenly throughout the day. Since these patterns often differ by weekday, it’s worth running separate analyses for each day.
When holidays or special events come into play, compare ticket volumes during holiday weeks with typical weeks from previous years. This helps you calculate a percentage impact factor. For holidays with shifting dates, like Easter, analyze data from the week before, during, and after to determine a "holiday factor."
As Charles Watson puts it:
"The objective of monthly forecasting is to provide ‘directionally correct’ information to the operations team, so focus on what you can build quickly."
- Charles Watson, Peopleware
Finally, document every manual adjustment you make, along with the reasoning behind it. This record will help you refine your forecasting process over time.
Step 3: Forecast Ticket Volume and Workload
Project Future Ticket Volume
To predict future ticket volumes, start by applying your average growth rate and seasonal trends. For example, if you handled 54,000 tickets in 2025 and your growth rate is 3.9%, multiplying 54,000 by 1.039 gives an estimated 56,106 tickets for 2026.
Next, distribute this annual forecast across the months using historical data. If January typically accounts for 9.4% of your yearly volume, multiply 56,106 by 0.094. This calculation results in about 5,274 tickets for January 2026. Repeat this process for each month to establish a monthly forecast. Keep in mind that certain months may experience higher ticket volumes due to calendar variations, like having five Mondays instead of four.
Once you’ve outlined your ticket volume, the next step is turning these numbers into workload estimates.
Estimate Workload Using AHT
Ticket volume alone doesn’t provide the full picture – you need to calculate the total workload by factoring in Average Handle Time (AHT). To do this, multiply your monthly ticket forecast by your AHT.
For instance, if January’s forecast is 5,274 tickets and your AHT is 12 minutes, the total workload equals 5,274 × 12 = 63,288 minutes. That’s roughly 1,055 hours of work for the month, which will help guide your staffing needs.
Make sure your AHT calculation includes all components of a call, and consider applying seasonal and trend adjustments to AHT, as it can vary depending on call types.
As Charles Watson, a WFM expert, explains:
"Workload: The contact or call volume (the number of incoming messages or calls) multiplied by the average handle time (AHT) of a call."
sbb-itb-e60d259
Step 4: Calculate How Many Agents You Need
Use Workload and Service Level Targets
Once you’ve determined your workload, the next step is figuring out how many agents you’ll need to maintain your desired service levels. Start by converting your monthly workload into the number of agents required.
To calculate the basic staffing level, divide the total workload hours by the number of hours a full-time agent works each month. For example, if your workload is 1,055 hours and each agent works 168 hours per month, the math looks like this: 1,055 ÷ 168 = 6.3 agents.
However, this raw number doesn’t account for how much time agents actively spend handling tasks. To adjust for this, use your target occupancy rate, which measures the percentage of time agents are actively working versus waiting between tasks. If your target occupancy is 80%, divide the basic staffing figure by 0.80. In this case: 6.3 ÷ 0.80 = 7.9 agents. Keep in mind, while higher occupancy rates reduce staffing needs, pushing them too high can lead to burnout and higher turnover rates.
Here’s a breakdown of the calculation process:
| Calculation Step | Formula | Example |
|---|---|---|
| Basic Staffing | Workload ÷ Agent Work Hours | 1,055 ÷ 168 = 6.3 agents |
| Occupancy Adjustment | Basic Staffing ÷ Occupancy Rate | 6.3 ÷ 0.80 = 7.9 agents |
| Final Staffing | Staffing ÷ (1 – Shrinkage %) | 7.9 ÷ 0.70 = 11.3 agents |
Finally, you’ll need to adjust for shrinkage to account for breaks, absences, and other factors.
Account for Breaks, Absences, and Other Variables
Shrinkage refers to the time agents are unavailable for productive work due to scheduled breaks, training, meetings, or unscheduled absences like sick days. Industry benchmarks place shrinkage rates between 15% and 35%.
To factor in shrinkage, divide your occupancy-adjusted staffing by (1 – shrinkage rate). For instance, with a shrinkage rate of 30%, the calculation would be: 7.9 ÷ 0.70 = 11.3 agents. To ensure full coverage, round up to 12 agents. This buffer helps you handle unexpected surges in workload or higher-than-anticipated absences. A 30% shrinkage rate effectively means you need to increase staffing by about 43% to compensate for lost productive time. Rounding up ensures you’re prepared for variability in day-to-day operations.
Step 5: Adjust for Business Events and Track Accuracy
Add Adjustments for Known Events
Once you’ve established your baseline forecast, it’s time to factor in external events that could influence ticket volume. The baseline alone won’t capture everything – think product launches, marketing campaigns, billing updates, or seasonal promotions. These events can have a significant impact.
Work closely with other departments to pinpoint upcoming events. Finance can share insights into revenue goals and new customer acquisition plans. Marketing knows the schedule for campaigns. Product teams can alert you to feature rollouts or retirements. Billing and fulfillment teams can highlight process changes that might confuse customers. This collaboration adds a layer of real-world context to the historical data you’ve already analyzed. Be sure to label each adjustment (e.g., "2026 Spring Promo") so you can assess its accuracy later on.
When applying adjustments, you have two main options:
- Percentage increases: Ideal for growth-related changes. For instance, if a marketing campaign is expected to drive 20% more signups, increase your forecast by 20% for that period.
- Specific ticket numbers: Better suited for fixed, known impacts, like a one-time event.
Avoid including rare anomalies in your adjustments, as they can distort future predictions.
"Your ticket and headcount needs forecast is only valuable to your finance team if they agree with your underlying assumptions." – ArenaCX
After applying these adjustments, the next step is to validate them by comparing your predictions to actual outcomes.
Compare Actual Results to Your Forecasts
Once the forecast period ends, it’s time to see how your predictions stack up against reality. Compare actual outcomes to your forecasted numbers – this is a crucial step for improving future accuracy. Keep a record of the reasons behind each adjustment so you can evaluate your assumptions later.
Use simple visual tools like charts to spot trends in variances. These charts make it easy to see where your forecasts consistently miss the mark, whether you’re overestimating or underestimating during specific events. This analysis doesn’t just apply to ticket volume; include metrics like handle times and service levels for a fuller picture of how accurate your forecasts are.
"Documentation clarifies why a change was made, and it also enables you to test your assumptions against the actual results." – Charles Watson, Peopleware
As key dates approach, refine your forecasts using the most recent data available. Regular updates ensure your predictions are as reliable as possible.
Conclusion
You don’t need expensive software to forecast ticket volumes and staffing effectively. By following this straightforward five-step framework – data gathering, pattern recognition, workload projection, staffing calculation, and event adjustment – you can achieve reliable forecasts using just basic tools. The popularity of spreadsheets proves that simplicity often gets the job done.
The key to success lies in refining your process over time. Each review helps fine-tune your forecasts, reducing errors and steering clear of the pitfalls of overstaffing (wasting resources) or understaffing (burning out agents and frustrating customers).
Collaboration across teams is also critical. Regular check-ins with other departments ensure you’re not blindsided by campaigns, product launches, or billing updates. These discussions bring practical context to your historical data, helping you prepare for unexpected changes before they happen.
As Ryan Wang, Co-founder and CEO of Assembled, explains:
"Forecast accuracy is actually the #1 measure that affects team satisfaction."
- Ryan Wang
Start with the data you already have, even if it’s limited to a few months. Build a baseline, document your assumptions, and adapt as you gather insights. With clear visibility into your operations, you can confidently scale your support team to match your business’s growth goals. These simple steps can help you stay flexible and aligned as your organization evolves.
FAQs
How can I manage unexpected ticket surges without overstaffing?
Managing unexpected ticket surges without overstaffing is all about preparation and adaptability. Start by analyzing historical data. Look for trends, seasonal shifts, or specific events that typically lead to higher demand. This kind of insight lets you anticipate surges and adjust staffing levels ahead of time, avoiding the need for a perpetually overstaffed team.
When sudden spikes occur, scalable tools like self-service portals or AI-driven chatbots can help ease the burden on your support team. These options allow customers to resolve common issues on their own or get quick responses without waiting for a live agent. Additionally, having a pool of flexible part-time or on-call agents can make a huge difference. These team members can jump in during busy periods, giving you the ability to respond to demand without locking into higher staffing costs long-term.
By blending accurate forecasting, flexible staffing solutions, and automation, you can navigate ticket surges effectively while keeping service quality high and expenses under control.
How can I clean and prepare historical data for accurate forecasting?
To get historical data ready for forecasting, start by tackling outliers – those unexpected spikes or dips in ticket volume that can throw off your analysis. These anomalies often don’t reflect the usual patterns and should be removed to ensure the trends you’re analyzing are accurate.
The next step is standardizing your data formats. Consistency is key here: make sure all date and time entries follow the same format (like MM/DD/YYYY), and unify labels or measurement units across the dataset. This makes it easier to analyze the data and draw meaningful conclusions.
You don’t need fancy tools to do this – basic spreadsheets often get the job done. With a clean and consistent dataset, you’ll have a solid base for forecasting without relying on costly or complex software.
How can I adjust my ticket forecast for events like product launches or marketing campaigns?
To fine-tune your ticket forecast for events like product launches or marketing campaigns, start by diving into historical data from similar events. Look for trends or patterns – say, a past product launch resulted in a 30% uptick in support tickets. That figure can serve as a starting point for your new forecast.
Another approach is to build scenario-based forecasts, covering best-case, worst-case, and most-likely outcomes. This helps you gauge the potential impact on ticket volume and adjust staffing levels to match. You might also find simple tools like trend analysis or ticket-to-order ratios helpful for making more accurate predictions.
By analyzing past data and planning for possible shifts in demand, you can better prepare your team to manage ticket volume changes while avoiding over- or under-staffing.