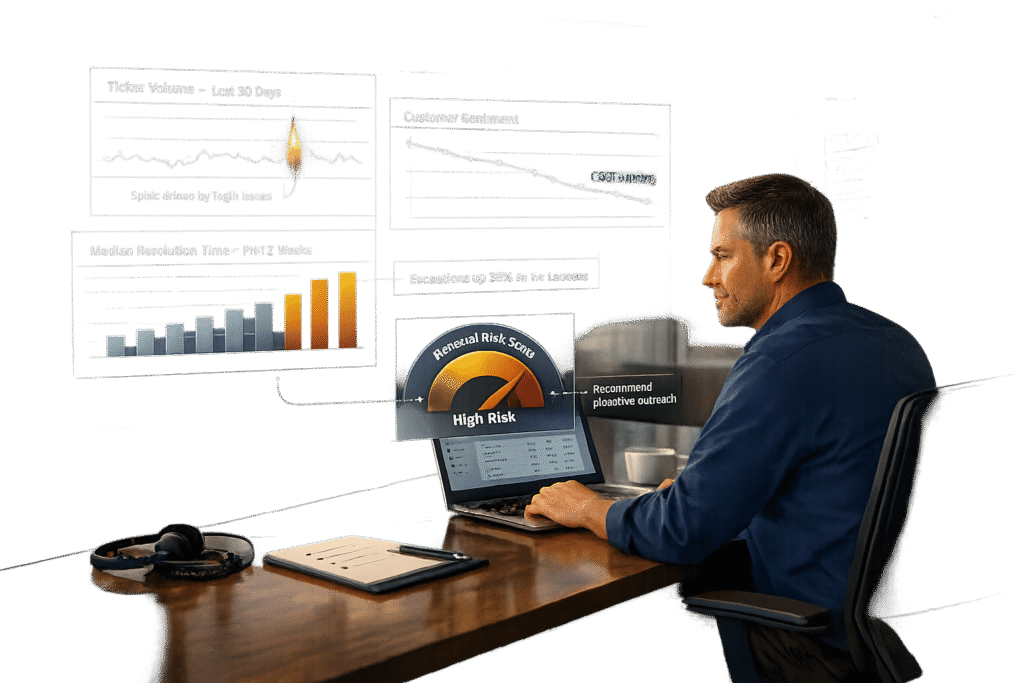
Support data can help identify renewal risks early, acting as a warning system for customer churn. By analyzing ticket trends, resolution times, and customer sentiment, you can predict which accounts may not renew. Key metrics include:
- Ticket volume patterns: Spikes or prolonged inactivity can signal issues.
- Resolution times and First Contact Resolution (FCR): Faster resolutions build trust.
- Sentiment analysis: Tracks emotional shifts in customer interactions.
- Customer health scores: Combine multiple metrics to assess overall account health.
Organize data by renewal timelines, set risk thresholds, and use dashboards to track progress. AI tools can automate alerts and workflows, cutting analysis time and enabling faster interventions. These strategies turn support data into actionable insights, helping teams focus on accounts that need attention.
Key Metrics for Identifying Renewals Risk
Key Metrics and Thresholds for Identifying Customer Renewal Risk
Ticket Volume and Escalation Patterns
Looking at raw ticket numbers without context can lead to misinterpretation. For example, a customer submitting 50 tickets might be a large enterprise with 500 active users, while another submitting just five tickets could be a small team of 10 struggling with unresolved problems. This is why it’s essential to normalize ticket counts based on the size and nature of the account.
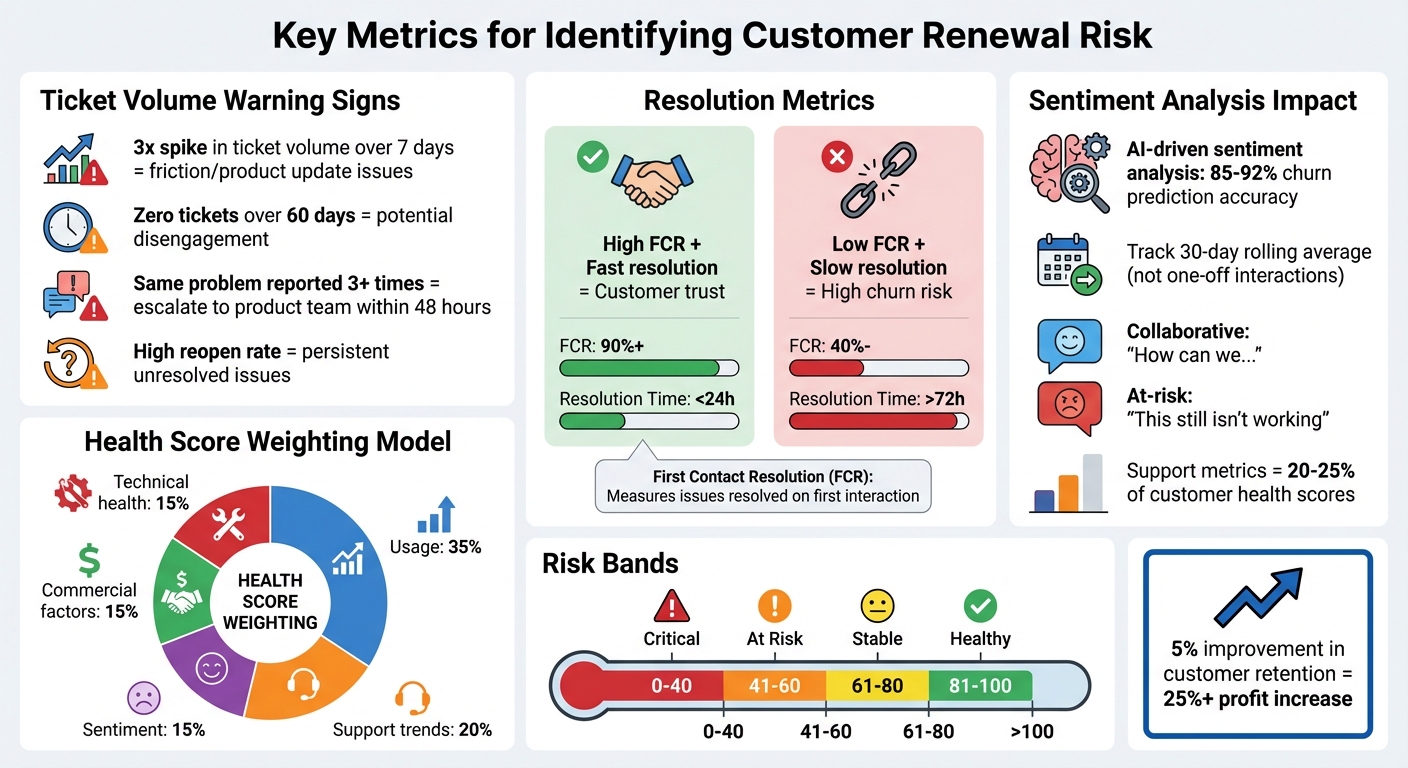
Certain patterns in ticket activity can serve as red flags. A 3x spike in ticket volume over seven days often points to friction, possibly due to a product update. On the flip side, zero tickets over 60 days could mean disengagement. As Mikko Mäntylä, Co-founder & CEO of Realm, explains:
"A customer filing one critical bug per quarter might be healthier than a customer filing zero tickets because they’ve stopped using your product".
Other warning signs include a rise in high-priority tickets or a high "reopen rate" (the ratio of reopened tickets to closed ones). These trends suggest persistent issues that could lead to churn. If a customer reports the same problem more than three times, it’s a signal to escalate the issue to your product team within 48 hours to address it permanently.
By analyzing these patterns, you can identify risks early and take steps to mitigate them, setting the stage for a deeper look at how resolution efficiency impacts customer retention.
Resolution Times and First Contact Resolution (FCR)
Resolution speed is critical. Long wait times for solutions can erode customer satisfaction and make them question whether your product is worth the investment. This is where First Contact Resolution (FCR) becomes an important metric – it measures how often issues are resolved on the first interaction without requiring multiple follow-ups.
High FCR rates indicate a smooth and efficient support process, which builds customer trust. On the other hand, low FCR rates paired with slow resolution times create a double-edged problem: customers grow frustrated not only with the issue itself but also with the quality of support. When this happens repeatedly, it significantly increases the risk of churn.
Sentiment Analysis and Customer Health Scores
Sentiment analysis uncovers emotional shifts that usage data alone might miss. A customer’s tone can reveal a lot – shifting from collaborative ("How can we…") to frustrated or passive-aggressive ("This still isn’t working") often signals growing dissatisfaction and a search for alternatives.
AI-driven sentiment analysis tools can predict churn with 85% to 92% accuracy, detecting patterns like escalation language, unresolved issues, or unmet feature needs in support interactions. The key is to focus on sentiment trends over time, such as a 30-day rolling average, rather than reacting to one-off negative interactions. A single frustrated ticket isn’t necessarily a problem, but a consistent downward trend is a strong indicator of churn risk.
"If Voice-of-the-Customer programs tell you what customers are saying, health scoring tells you what they are likely to do next." – Umbrex
Customer health scores combine sentiment analysis with other metrics like usage and financial data. Support interactions typically account for 20–25% of these scores. For example, one global software company improved its business value scores by 25 points after incorporating support metrics into its health scoring model. The payoff is clear: improving customer retention by just 5% can boost profits by over 25%.
sbb-itb-e60d259
How to Extract and Analyze Support Data for Renewals Risk
Group Data by Renewal Timeline
Start by organizing your support data around each account’s renewal date. Break customers into segments based on renewal windows – like 90, 60, or 30 days – to uncover patterns specific to each stage. For instance, a growth-stage SaaS company used centralized data and rule-based churn scoring aligned with renewal timelines, which helped them cut churn by 25% in just a year. The secret? Filtering support metrics by renewal date to highlight stage-specific trends, all within a single dashboard.
Focus on what matters most at each stage. For new accounts, keep an eye on onboarding milestones and support volume. For more established accounts, dive into metrics like ROI, product usage depth, and scores like NPS or CSAT. If an account within 90 days of renewal shows red flags – like a 20% jump in ticket volume or a noticeable dip in sentiment – it’s time for immediate action.
By aligning data with renewal timelines, you can set clear benchmarks to address risks before they escalate.
Set Risk Baselines and Thresholds
Once you’ve segmented your data by renewal timelines, the next step is to define risk benchmarks that enable proactive responses. Look at the last 12 months of lost renewals to build a "churn signal library" – a collection of patterns that indicate potential risks. For example, a 3x increase in support tickets within a week could signal serious trouble, prompting an executive check-in within 24 hours.
To make these thresholds fair and actionable, normalize ticket volume by dividing it by the number of active users. This avoids unfairly penalizing larger accounts with inherently higher ticket counts. Use a weighted scoring model to assess risk: allocate 35% to usage, 20% to support trends, 15% each to sentiment and commercial factors, and another 15% to technical health. From there, create risk bands like Critical (0-40), At Risk (41-60), Stable (61-80), and Healthy (81-100).
Automate alerts for threshold breaches to act quickly. For instance, if a high-value account’s sentiment score drops to -40 or lower, set up a system to trigger a review within two hours. As David Pinto, Principal Consultant at RenewalsHub, puts it:
"Data-driven renewals go beyond usage dashboards or monthly CSAT reports. They require a system that continuously tracks customer behavior and engagement".
How to Build Renewal Risk Dashboards and Reports
What to Include in a Renewal Risk Dashboard
Your renewal risk dashboard should be more than just a collection of numbers – it needs to turn data into actionable insights. Start with key metrics that summarize overall health, such as Renewals Due (total target amounts), Renewal Forecast, Gross Renewal Rate (GRR), and Net Renewal Rate (NRR). These summary widgets give you a quick snapshot of where things stand and what needs attention.
Make priorities clear with Action Cards. Highlight critical items like Overdue Unresolved Renewals, High Churn Risk Renewals, and Opportunities Missing Forecast. Add support risk indicators, such as spikes in ticket volume, negative sentiment scores, or extended "radio silence" (no tickets for 60+ days).
Visual tools can also help pinpoint issues. Use a Renewals Due by Health chart to identify mismatches – like healthy accounts that aren’t expected to renew or at-risk accounts showing as "green" in your scoring. A Renewal Waterfall Chart is another must-have, illustrating the full renewal lifecycle. It tracks everything from Renewals Due to Lost, Downsell, and Upsell, helping you understand how Gross Renewal Rates transition to Net Renewal Rates. Finally, include a Churn Analysis view to break down lost revenue by root causes – whether it’s product limitations, budget cuts, or executive turnover. This helps stakeholders grasp the "why" behind the numbers.
Modern AI-powered sentiment analysis tools can reach 85-90% accuracy when tailored to industry-specific language, making them a dependable addition to your dashboard. Considering that a 5% boost in retention can drive profits up by more than 25%, these dashboards are essential for safeguarding revenue.
Once you’ve built a dashboard that delivers a clear picture, take it a step further by integrating automated alerts for quick action on emerging risks.
Set Up Automated Alerts and Reports
A static dashboard is only half the battle – you need automated alerts to catch risks in real time. Set account-specific thresholds (e.g., -35 for enterprise clients, -45 for mid-market) to ensure timely responses without overwhelming your team with unnecessary notifications. This targeted approach ensures high-value accounts get the attention they need, fast.
Deliver alerts directly to account owners through platforms like Slack or email, and include details like the specific risk drivers (e.g., a drop in usage or a spike in support tickets) along with recommended next steps. To cut down on false positives, configure alerts to trigger only when multiple risk indicators – like a usage drop combined with a ticket surge – occur together. When fine-tuned, AI-assisted workflows can predict renewals with about 91% accuracy, while minimizing unnecessary noise.
Instead of reacting to isolated incidents, track sentiment trends over a 30-day period. Sudden drops from an account’s historical baseline should raise a red flag. For example, a 3x spike in support tickets within a week should prompt an executive sponsor to check in within 24 hours.
As David Pinto, Principal Consultant at RenewalsHub, wisely notes:
"Insight without action is just noise. Embed predictive signals directly into workflows that drive decisions and engagement".
To maintain the system’s reliability, audit your alerts monthly. Aim for 70-80% of automated alerts to lead to actionable steps. This keeps your data accurate and ensures your interventions are both timely and effective.
Using AI to Predict and Reduce Renewals Risk
AI Predictions for CSAT, CES, and FCR
AI has taken customer satisfaction metrics like CSAT, CES, and FCR to the next level. It can now predict these scores even before surveys are sent out, giving you a head start in spotting accounts at risk. By analyzing data such as survey activity, open and closed Call to Actions (CTAs), response rates, and recent risk-related CTAs, AI generates renewal likelihood scores. These scores not only highlight potential risks but also pinpoint contributing factors – whether it’s an increase in support tickets, a drop in satisfaction trends, or long periods of no communication.
For handling large datasets, Explainable Boosting Machines provide exceptional results. If you’re working with smaller datasets (under 50 opportunity records), Bayesian models are a better fit. Combined, these approaches deliver prediction accuracy of about 88%. Moreover, AI-driven churn prevention strategies have shown to be up to 70% effective.
AI doesn’t just stop at predictions. It monitors real-time changes – like delays in service, unusual billing patterns, or reduced usage – and connects these signals to renewal risks. Instead of focusing on isolated incidents, AI tracks customer sentiment over a 30-day period. This helps uncover early signs of churn, such as a shift toward formal communication, subtle passive-aggressive tones, or mentions of competitors. These nuanced signals, often missed in manual reviews, allow teams to step in well before renewal discussions become challenging.
With these insights in hand, the logical next step is to automate responses to address risks immediately.
Automate Risk Response Workflows
Once AI identifies a renewal risk, automated workflows kick in to ensure swift and consistent action. AI-powered "Action Cards" flag high-risk accounts and assign them to Customer Success Managers (CSMs) with tailored strategies – or "save plays" – specific to the account’s challenges. For instance, if an account shows a sharp increase in support tickets, the system might trigger an executive review to address the issue promptly.
AI also prioritizes high-risk accounts by significantly reducing response times. Severe cases can be flagged and acted on within two hours, while accounts that have been silent for 60+ days are flagged for re-engagement. This proactive approach prevents minor problems from escalating into major churn risks. By streamlining workflows, AI reduces the time needed for renewal analysis from 14–24 hours to just 2–3 hours, cutting up to 86% of processing time.
Automated triage further boosts efficiency, saving teams as much as 220 hours each month. It eliminates the need for manual ticket sorting by ensuring that the right cases are routed to the right people immediately. To avoid overwhelming teams with alerts, AI introduces tiered thresholds. For example, enterprise accounts might trigger alerts at a sentiment score of -35, while smaller accounts might only alert at -55. This ensures critical issues are addressed without creating unnecessary noise.
Conclusion
Key Takeaways for Support Leaders
Support data has become a powerful tool for identifying renewal risks early. Instead of reacting to problems as they arise, teams can now shift to a proactive approach by centralizing data from CRM systems, support platforms, and product analytics into a unified dashboard. Without this consolidated view, it’s almost impossible to catch early warning signs of churn, which can appear 60–90 days before renewal discussions even start.
The most impactful metrics are those that predict behavior rather than simply measure it. Spikes in ticket volume, declining sentiment, and Customer Effort Score (CES) are key indicators that an account may be at risk. These signals, when combined into customer health scores, help teams focus their energy where it’s needed most. As Mikko Mäntylä, Co-founder & CEO of Realm, explains:
"Customer health scores solve the fundamental problem every CS leader faces: you can’t be in every account at once."
AI takes this process to the next level, replacing manual analysis with scalable intelligence. By cutting renewal analysis time from 14–24 hours to just 2–3 hours – a time savings of 86% – AI empowers teams to act more efficiently. It identifies subtle shifts in customer sentiment, automates risk alerts, and ensures high-priority accounts are routed to the right team members with actionable context and playbooks. The key is turning data into action. Insights only matter when they’re integrated into workflows that enable immediate and effective intervention.
Next Steps for Implementing Renewals Risk Reporting
To put these insights into practice, consider these steps for building an effective renewals risk reporting system:
- Audit your data systems: Review your support, CRM, and product analytics platforms. Consolidate this data into a single dashboard for a clear, unified view. Segment customers based on their profiles – treating all accounts the same can lead to misleading insights.
- Focus on key metrics: Identify 4–6 metrics that align with your business objectives. Define clear thresholds for risk, such as a 3x increase in ticket volume over seven days triggering an executive check-in within 24 hours.
- Start simple, then scale: Begin with a rules-based scoring model, assigning weights to metrics based on their predictive value. Review and refine this model quarterly by comparing predicted health scores with actual renewal outcomes.
- Automate and document: Set up automated alerts so CSMs receive prioritized account lists with context, not just raw data. Track the results of every intervention to understand what actions drive retention improvements.
FAQs
How can AI help predict and reduce customer churn more accurately?
AI improves churn prediction by examining customer behavior and sentiment from support interactions, such as tickets, call transcripts, and feedback. It identifies patterns like dissatisfaction signals, escalation trends, or unmet needs, producing a churn risk score that enables teams to act before it’s too late.
These tools also integrate critical metrics – such as product usage, resolution times, and engagement trends – into real-time customer health scores. This allows support teams to spot at-risk accounts well ahead of renewal deadlines, making targeted retention strategies possible. By uncovering complex patterns across multiple data sources, AI helps businesses make more accurate predictions and strengthen customer retention efforts.
How does sentiment analysis help identify renewal risks?
Sentiment analysis plays a key role in spotting renewal risks by analyzing customer emotions and satisfaction trends across feedback sources like support tickets, calls, and surveys. When patterns of negative sentiment – such as frustration or dissatisfaction – emerge, support teams can identify potential churn risks early.
In a support setup powered by AI, sentiment analysis goes beyond basic metrics like ticket volume or resolution times. It adds an emotional perspective, helping teams focus on at-risk accounts and take action to boost retention. Using these insights, support leaders can improve renewal rates and build deeper connections with their customers.
How can support teams use data to identify and report renewals risk effectively?
To effectively identify and report on renewal risks, support teams should focus on organizing and analyzing key metrics that paint a clear picture of customer health and potential churn. Start by keeping an eye on ticket resolution times, escalation trends, and customer sentiment – these metrics often signal when an account may be at risk. Beyond that, behavioral patterns like ticket volume trends, product usage habits, and escalation rates offer a broader perspective on overall customer health.
Bringing all this data into a single, unified system with real-time updates and automation can make a big difference. Tools like customer health scores or AI-driven models can combine multiple data points into clear, actionable insights. This not only enhances how teams report renewal risks but also helps them make smarter decisions and improve customer retention efforts.