
Support-driven product adoption uses customer support interactions to boost product usage, activate features, and improve retention. Instead of relying on traditional marketing or automated onboarding, this approach focuses on real-time customer needs identified during support conversations.
Why It Matters:
- Retention is cheaper than acquisition: Keeping a customer costs 5x less than acquiring a new one.
- Support identifies growth opportunities: Support teams can spot signals like frequent API inquiries or team invites, turning issues into upsell and retention opportunities.
- Outcome-based metrics drive success: Go beyond activity metrics (e.g., ticket volume) and focus on results like feature adoption, retention, and upsells.
What to Track:
- Feature Adoption After Support: Measure how many users activate features after support interactions.
- Retention Linked to Support: Track 90-day retention rates for customers who engage with support.
- Support-Led Upsell Opportunities: Identify accounts with revenue-trigger signals and track conversion rates.
Key Mistakes to Avoid:
- Relying on vanity metrics like ticket volume or average handle time (AHT).
- Ignoring qualitative feedback, such as customer sentiment trends.
- Misinterpreting low ticket volumes as positive engagement.
How to Measure Effectively:
- Use event tracking to monitor post-support behaviors.
- Leverage AI tools for sentiment analysis and predict customer churn.
- Implement dynamic SLAs and customer health scoring to prioritize high-value accounts.
By focusing on outcomes instead of activity, support teams can drive product adoption, retention, and revenue growth.
10 most meaningful production adoption metrics
sbb-itb-e60d259
The Problem with Vanity Metrics
Vanity Metrics vs Outcome-Based KPIs for Support-Driven Product Adoption
Understanding vanity metrics is key to shifting support’s focus from routine tasks to driving meaningful product adoption.
What Are Vanity Metrics in Support?
Vanity metrics are numbers that look impressive but fail to reflect actual customer success. In the context of support, these include ticket volume, average handle time (AHT), and first response time. For instance, handling 1,000 tickets in under two minutes might sound efficient, but it doesn’t necessarily mean customers are successfully using your product.
Here’s the catch: a high ticket volume might indicate rapid growth, but it could also point to poor onboarding, leaving users confused. Similarly, a lack of tickets for over 60 days might seem like a positive sign, but it could mean customers have given up on your product altogether. AHT can be equally deceptive – prioritizing speed often leads agents to rush through issues, resulting in unresolved problems and repeat contacts.
These metrics focus on activity (how much work was done) rather than outcomes (whether customers succeeded). As one expert explains:
"Traditional metrics like average handle time and ticket deflection rates no longer capture the full picture of how service is delivered today… leaders need metrics that explain outcomes, not just activity".
Why Outcome-Based KPIs Work Better
Outcome-based KPIs shift the focus to what truly matters: customer success and revenue growth. Instead of measuring how many tickets were resolved, these metrics evaluate whether customers adopted new features after a support interaction, renewed their contracts, or opened opportunities for upselling.
The data supports this approach. Studies show that 96% of customers who face high-effort support experiences become disloyal, while 94% of those who have low-effort interactions tend to stay loyal. The Customer Effort Score (CES) – which measures how easy it was for a customer to resolve their issue – has proven to be a stronger predictor of loyalty than speed-based metrics. Plus, improving retention by just 5% can lead to a profit increase of over 25%.
Tracking outcomes like feature adoption rates or revenue influenced by support positions the support team as a value generator instead of a cost center. This shift is vital, especially as 78% of service leaders report that AI is pushing them to rethink success metrics, moving beyond activity-focused measures.
With this in mind, let’s explore common mistakes that arise when organizations rely too heavily on vanity metrics.
3 Common Mistakes When Using Vanity Metrics
First mistake: prioritizing speed over quality. When teams focus on reducing AHT without ensuring full resolution, they compromise customer value. This approach often results in rushed interactions, unresolved issues, and frustrated customers who need to reach out multiple times. A longer conversation that solves the problem completely is far more effective than a quick, incomplete exchange.
Second mistake: treating all ticket volume equally. Not every ticket carries the same weight. For example, a surge in tickets from high-value accounts mentioning "API rate limit" or "SSO request" could signal expansion opportunities. Without segmenting tickets by issue type or account value, you risk missing critical insights.
Third mistake: skipping post-interaction follow-up. If you don’t track whether customers used the features you explained, invited team members, or upgraded within 30 days, you lose the ability to measure whether support interactions are driving product adoption.
To further clarify the difference, here’s a side-by-side comparison of activity-based metrics and outcome-based KPIs:
| Metric Type | Examples | Why It Can Mislead |
|---|---|---|
| Activity-Based | Ticket Volume, AHT, Logins | High volume might reflect growth or product issues; logins don’t guarantee feature value |
| Outcome-Based | Feature Adoption Rate, Net Revenue Retention, Customer Effort Score | Links support interactions to product usage and revenue retention directly |
Key Metrics for Tracking Support-Driven Product Adoption
Keep an eye on the KPIs that show how support interactions influence product adoption and revenue growth.
Feature Adoption Rates After Support
This metric focuses on whether customers actually start using features discussed during support interactions. To measure it, use this formula: (Users activating the feature after support / Total related support cases) × 100. For example, if 80 customers reached out about API integrations and 56 activated the API within 14 days, the feature adoption rate would be 70%.
The key is to track what happens after support, not just whether the ticket was resolved. If a customer asks about scheduled reports but never sets one up, the interaction only closed a ticket – it didn’t drive adoption. Segmenting adoption rates by channel can also provide insights. For instance, customers who get help via Slack-based support might adopt features differently compared to those assisted through email. This helps pinpoint which channels are more effective for teaching customers.
In addition to feature usage, tracking retention can show how support interactions encourage ongoing customer engagement.
Customer Retention Linked to Support
Retention analysis builds on feature adoption by showing how support influences long-term loyalty. This metric compares 90-day retention rates between customers who engaged with support and adopted features versus those who didn’t. A cohort analysis works well here: take 100 customers who contacted support in January, track how many adopted the feature discussed, and then see how many from each group stayed active or renewed after 90 days.
Even a small improvement in retention can have a big impact – boosting retention by just 5% can increase profits by over 25%. Additionally, companies offering excellent support often experience 40-60% lower churn rates. By linking support interactions to retention outcomes, you can highlight how your support team contributes to customer loyalty and revenue growth.
Support-Led Upsell Opportunities
This KPI focuses on upgrade rates by identifying accounts with revenue triggers, like repeated requests for higher limits, SSO inquiries, or multiple contacts from the same organization. Assign point values to these triggers (e.g., +2 for an "API limit reached" alert). When an account hits a set threshold (e.g., 5 points), mark it as "sales-ready" for immediate follow-up.
One mid-sized analytics company found that 22% of accounts flagged with support-driven revenue triggers expanded within 30 days, and those accounts saw an 18% increase in average deal size compared to others. The real focus isn’t just how often "upgrade" is mentioned, but rather the conversion rate from support signals and the additional ARR generated per converted account.
How to Track Without Vanity Metrics
To truly measure how support drives product adoption, you need a tracking system that goes beyond surface-level metrics. This means combining precise event tracking, AI-driven insights, and smart prioritization. By focusing on what customers do after their support cases are closed – like activating features, increasing usage, or showing signs of churn – you can get a much clearer picture of your impact.
Event Tracking for Post-Support Behaviors
To connect the dots between support interactions and customer actions, your support platform and product analytics need to use the same userId. This ensures you can link support tickets to what happens next. A Customer Data Platform (CDP) can help by centralizing data from both systems, bridging the "Attribution Gap".
Defining specific attribution windows is key. These windows let you measure the ripple effects of support interactions, like how they influence product adoption or retention. A detailed tracking plan is also essential – it ensures your data remains reliable and your reporting stays consistent.
Once you’ve set up event tracking, AI can take it a step further by uncovering patterns and insights that might not be immediately obvious.
Using AI for Better Insights
AI-powered tools can analyze customer sentiment to spot early warning signs of churn. For instance, they can detect subtle changes in tone, like increased formality or frustration, that might indicate dissatisfaction. This is crucial when 90% of customers say an immediate response is critical, and 60% define "immediate" as within 10 minutes. AI can also categorize tickets intelligently, tagging them based on the context and content of the issue.
Predictive churn models are another game-changer. By combining sentiment analysis with engagement metrics, these models generate churn risk scores, helping teams intervene before it’s too late. And the financial benefits are hard to ignore – companies using AI in support often see a $3.50 return for every $1 invested, with top performers achieving up to an 8x ROI.
With these insights, you can fine-tune your processes, making prioritization and customer health scoring even more impactful.
Dynamic SLAs and Customer Health Scoring
Dynamic SLAs (Service Level Agreements) allow you to prioritize support cases based on what really matters, like account value or where a customer is in their journey. For example, a high-value client showing negative sentiment might get immediate attention, while a less critical case follows standard procedures.
Customer health scoring becomes much more accurate when you include AI-detected sentiment. Typically, sentiment accounts for 20–30% of the total score, giving a balanced view of customer engagement. One company, for instance, uses a scorecard to track product usage, defining "Green" adoption as more than 40 CI builds per billable user in 28 days. If usage drops below this level, it triggers an immediate review.
Proactive alerts can also make a big difference. For example, setting up notifications for accounts with no support interactions in over 60 days can help identify disengaged customers who might need attention. These systems ensure you’re always one step ahead, addressing issues before they escalate.
Common Tracking Mistakes to Avoid
When it comes to understanding outcome-based KPIs, even the best tools can lead you astray if you’re not careful. Tracking errors can obscure problems and make it harder to identify churn risks or support-driven adoption signals. Let’s break down some of the most common missteps.
Mistake 1: Relying on Aggregate Logins
At first glance, tracking total logins across all users might seem like a simple way to measure engagement. But it’s actually one of the most misleading metrics. Why? Because high login numbers can hide low activation rates. Users may log in often but never engage with key features or complete onboarding steps. This kind of aggregate data lumps all user behaviors together, masking whether certain groups – like enterprise customers versus SMBs – are thriving or struggling.
For example, a user might log in daily but use only one minor feature. This doesn’t signal success; it points to weak adoption. Similarly, "radio silence" (no logins or support tickets) is often misread as self-sufficiency, when it could actually mean disengagement and a high risk of churn.
To get a clearer picture, segment users into groups based on their support interactions. Use metrics like stickiness ratio (DAU/MAU) to understand how often users rely on your product. Also, track Time to Value (TTV) – how quickly users reach their "Aha moment" after their first login. These metrics tell you much more about real engagement than login counts ever could.
Mistake 2: Ignoring Qualitative Feedback
Quantitative data tells you what’s happening, but qualitative feedback explains why. Negative sentiment in support conversations, for instance, can be an early warning sign of churn. On the flip side, positive sentiment often signals healthy engagement and potential for growth. Research shows that 96% of customers who experience high-effort interactions become disloyal, compared to just 9% of those with low-effort experiences.
A common mistake is assuming that zero support tickets mean everything is fine. For complex B2B products, silence can actually mean customers have given up rather than mastered the product. Without qualitative insights, you risk missing the bigger picture.
AI-driven sentiment analysis can help bridge this gap by combining customer feedback with your quantitative KPIs. Focus on sentiment trends over 30 days instead of single scores – a downward trend is often a stronger predictor of churn than one bad interaction. You can also use "ChurnRisk" tags to flag conversations where users express frustration or issues that could lead to cancellations. And don’t stop there – close the loop by sharing these insights with your product team so they can address real pain points.
Vanity vs. Meaningful KPIs: Side-by-Side Comparison
Here’s how to separate metrics that look good on paper from those that actually drive results:
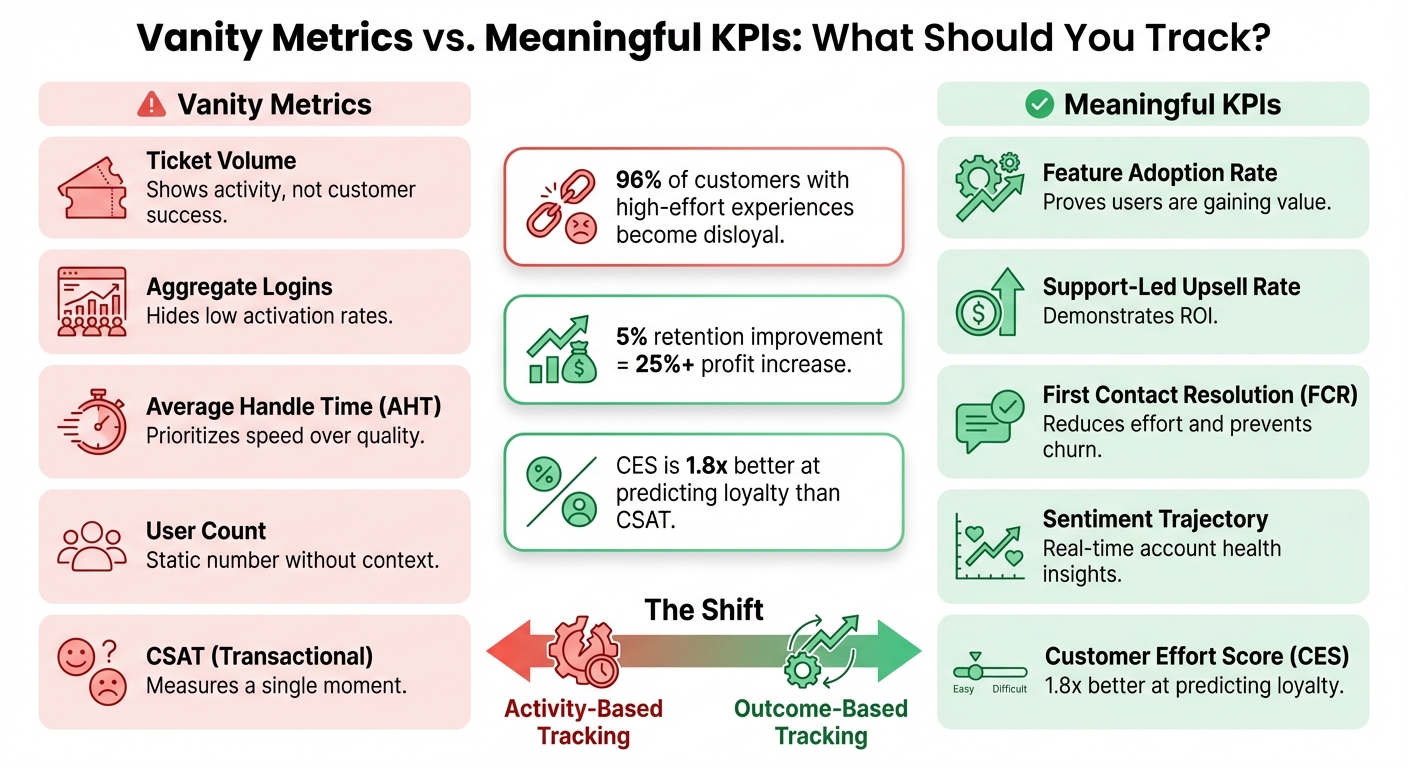
| Vanity Metric | Meaningful KPI | Why This KPI Matters |
|---|---|---|
| Ticket Volume | Feature Adoption Rate | High ticket volume could mean engagement or friction, but adoption rates show if users are gaining value. |
| Aggregate Logins | Support-Led Upsell Rate | Logins don’t equal growth. Upsells tied to support prove ROI. |
| Average Handle Time (AHT) | First Contact Resolution (FCR) | Fast responses are useless if the issue isn’t resolved. FCR reduces effort and prevents churn. |
| User Count | Sentiment Trajectory | User count is static, but sentiment trends give real-time insights into account health. |
| CSAT (Transactional) | Customer Effort Score (CES) | CSAT measures a moment; CES is 1.8x better at predicting loyalty over time. |
The takeaway? Vanity metrics might make you feel busy, but meaningful KPIs actually drive outcomes like retention, growth, and customer success. By focusing on metrics that reflect real progress, you can avoid these common tracking mistakes and adopt more effective strategies.
Conclusion
Support-driven product adoption focuses on measuring customer success rather than traditional metrics like ticket volume or response speed. This approach represents more than just a reporting adjustment – it’s a complete shift in how B2B support teams demonstrate their value. By tracking metrics such as Customer Effort Score, sentiment trajectory, and support-influenced revenue, you’re zeroing in on what truly matters: retention, growth, and the overall health of your customer relationships.
Modern technology plays a key role in this transformation. AI is at the forefront of this change, with 78% of leaders now reevaluating success metrics to capture the real impact of automation and intelligence in their operations. With AI analyzing every customer interaction in real-time, businesses can pinpoint friction points, address declining relationships before they result in churn, and uncover hidden opportunities for growth that might otherwise be buried in ticket queues.
The financial benefits speak for themselves. Even a 5% improvement in retention can increase profits by over 25%, and AI-powered support solutions deliver impressive returns – generating $3.50 for every $1 invested, with top performers achieving an 8x ROI. These aren’t just abstract figures – they reflect tangible business outcomes that directly influence profitability. These metrics highlight the importance of adopting a strategic, outcome-focused approach to support measurement.
FAQs
How can support teams identify and make the most of upsell opportunities during customer interactions?
Support teams have a unique advantage when it comes to identifying upsell opportunities. By paying close attention to customer interactions – like support tickets, live chats, or phone calls – they can spot signs that a customer’s needs are evolving. These signs often include repeated requests for higher usage limits, questions about premium features, or curiosity about advanced workflows. When these hints pop up, it’s a strong signal that the customer might be open to an upgrade or additional services.
AI-powered tools make this process even more effective. These tools can analyze conversations to detect buying signals, shifts in sentiment, or patterns in usage. For example, if a customer consistently asks about advanced features or shares positive feedback about specific capabilities, that’s a great opportunity for a tailored upsell pitch. By focusing on what the customer needs and offering solutions at the right time, support teams can turn everyday conversations into chances to add value and foster growth.
Why should customer support teams prioritize outcome-based KPIs over vanity metrics?
Focusing on outcome-based KPIs instead of vanity metrics ensures your customer support efforts truly contribute to business growth. Vanity metrics, like ticket volume or average response time, might seem impressive on the surface but often fail to show the real impact on customer satisfaction or long-term success. On the other hand, outcome-based KPIs – such as customer retention, first contact resolution rates, and support-led upsell opportunities – offer deeper insights into how support drives loyalty and revenue.
When teams prioritize these meaningful results, they can make smarter, data-driven decisions that build stronger customer relationships and align with broader business goals. This approach avoids the trap of chasing numbers that don’t matter and keeps your support operations focused on delivering measurable, lasting success. This is especially critical in today’s AI-driven support landscape, where traditional metrics often fall short of telling the full story.
How can AI help track support-driven product adoption effectively?
AI plays a key role in monitoring support-driven product adoption by offering precise, real-time insights into customer behavior. By examining data such as support tickets, product usage patterns, customer sentiment, and financial performance, AI can flag potential retention risks and uncover upselling opportunities. This empowers support teams to take proactive steps to enhance customer satisfaction.
In addition, AI simplifies the process of tracking feature usage and adoption trends. It helps teams pinpoint which features resonate with customers and identify areas where adoption could improve. By automating the analysis of customer interactions and sentiment, AI minimizes reliance on surface-level metrics and delivers insights that drive real results and support long-term customer success.