
In 2026, measuring customer support performance requires focusing on metrics that go beyond surface-level numbers. The goal is to understand efficiency, customer experience, and revenue impact. Here’s what matters most:
- Efficiency Metrics: Track First-Contact Resolution (FCR), Resolution Velocity, and Agent Utilization Rate to balance speed and accuracy.
- Quality Metrics: Use AI-powered tools for Predictive CSAT, Customer Effort Score (CES), and Sentiment Analysis to gauge customer satisfaction and emotional tone.
- Customer Retention Metrics: Monitor Customer Health Scores and churn signals like ticket reopen rates and SLA compliance to protect revenue.
- Cost Metrics: Calculate Cost Per Case and measure agent productivity with AI tools to ensure scalability without increasing expenses.
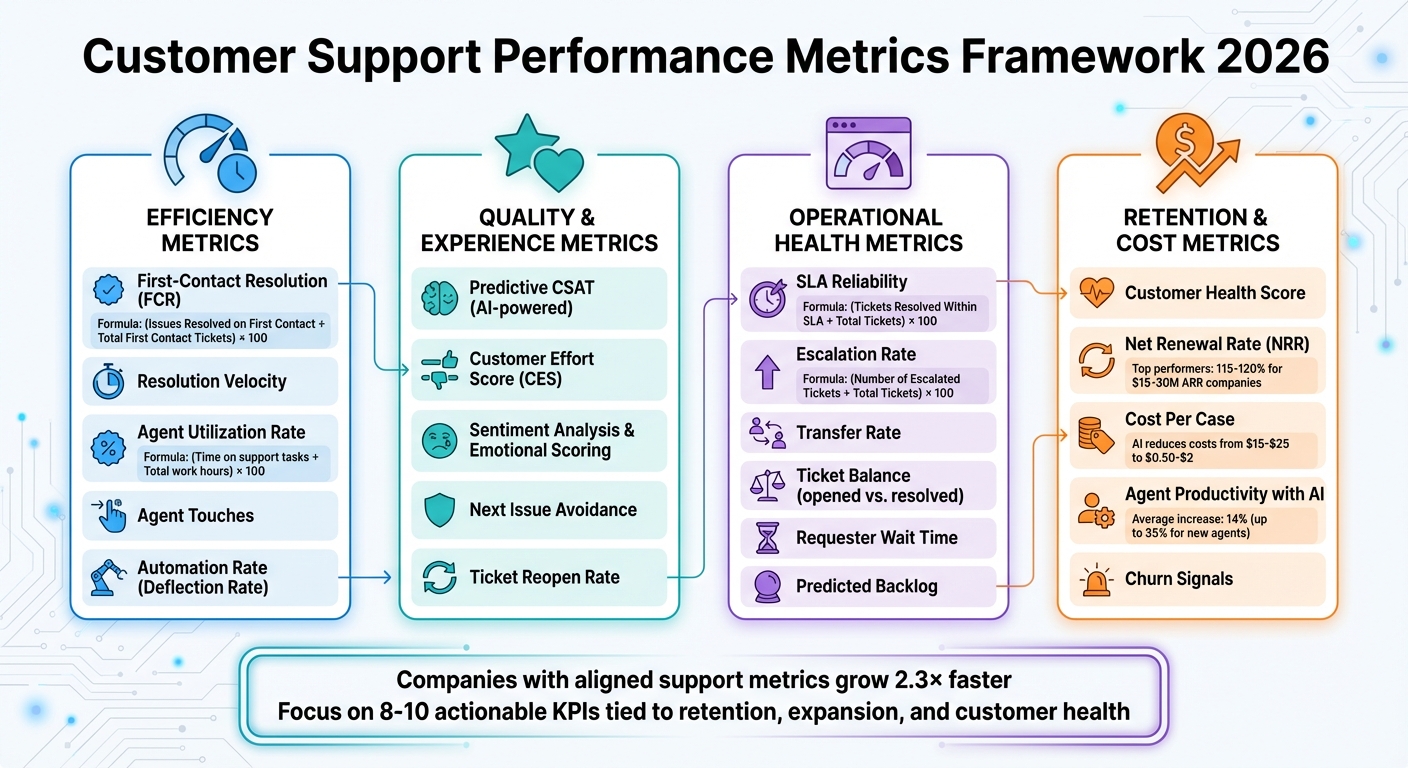
Customer Support Performance Metrics Framework 2026: Four Key Categories
What five questions should CX leaders ask to improve customer outcomes in 2026?
sbb-itb-e60d259
Efficiency Metrics: Measuring Speed and Effectiveness
B2B support teams face the constant challenge of balancing speed with quality. Quick resolutions lose their value if the same issues keep popping up. That’s why the focus in 2026 is on meaningful resolution – not just how fast tickets are closed. Let’s dive into key metrics like First-Contact Resolution and Resolution Velocity to see how they shape this balance.
First-Contact Resolution with AI Detection
First-Contact Resolution (FCR) measures whether a customer’s issue is fully resolved during the very first interaction. The formula is simple: (Issues Resolved on First Contact ÷ Total First Contact Tickets) × 100. Traditionally, this relied on manual input from agents, which often led to inconsistent data. But AI is changing the game.
AI analyzes entire conversation histories to determine if a customer’s problem was truly resolved or if follow-ups were needed. By pulling accurate answers from integrated knowledge bases, AI ensures issues are addressed correctly the first time. This reduces the need for repeat contacts and prevents ticket queues from growing out of control.
For B2B teams, the stakes are high. An unresolved issue can delay a customer’s product launch or even impact renewal decisions. Improving FCR doesn’t just boost efficiency – it directly protects revenue. AI also monitors Next Issue Avoidance, identifying whether customers return with related problems. This helps ensure resolutions are thorough enough to prevent future tickets.
Resolution Velocity and Automation Impact
Resolution velocity measures how quickly issues are resolved and highlights the strengths and weaknesses of automation compared to human intervention. This metric reveals where AI excels and where human expertise remains essential.
AI-driven triage speeds up the process by automatically tagging and routing tickets to the right specialist, cutting out delays caused by misrouting. Another important metric is the Automation Rate (or Deflection Rate), which tracks the percentage of tickets resolved entirely by AI without agent involvement. However, automation isn’t a silver bullet. As Stevia Putri from eesel AI cautions:
"A 90% automation rate might look amazing in a presentation, but it’s a total failure if your CSAT score falls through the floor because the answers are terrible".
To avoid this pitfall, leading teams measure automation rates alongside customer satisfaction scores. Some platforms even offer simulation tools that test AI against historical ticket data. These simulations help forecast automation performance and pinpoint knowledge gaps before rolling out AI fully.
Agent Productivity Without Adding Headcount
Tracking agent productivity is crucial, especially when aiming to improve efficiency without expanding the team. One way to measure this is through Agent Utilization Rate, which calculates the percentage of time agents spend on active support tasks: (Time on support tasks ÷ Total work hours) × 100. Like FCR and resolution velocity, this metric emphasizes balancing speed with quality.
AI Copilots enhance productivity by drafting responses that align with a company’s tone and pulling relevant knowledge base articles based on historical data. This allows agents to focus on complex, high-value customer interactions instead of repetitive tasks. AI also provides 24/7 support, which helps reduce ticket backlogs during off-hours and improves First Response Time without requiring night shifts.
Another key metric to watch is Agent Touches, which tracks the number of interactions needed to resolve a ticket. Fewer touches indicate smoother workflows. Additionally, monitor Ticket Reopens – a high reopen rate suggests agents might be prioritizing speed over quality. The ultimate goal isn’t just to close tickets faster but to resolve them correctly the first time.
Quality and Experience Metrics: Beyond Traditional Surveys
Traditional CSAT surveys often fall short because they rely on voluntary feedback, capturing input from only a small fraction of customers. This creates a selection bias that can obscure the experiences of the majority. By 2026, top B2B support teams are addressing this gap with AI-powered tools that analyze every customer interaction – not just survey responses. This shift allows for a more comprehensive understanding of customer effort and emotional responses, which we’ll explore further.
Predictive CSAT and CES
Predictive CSAT leverages AI to estimate how satisfied a customer might be with an interaction, even if they don’t complete a survey. By examining conversation patterns, tone, and resolution quality in real time, AI can forecast customer satisfaction levels. This is especially valuable in B2B support, where complex and high-stakes interactions can significantly impact relationships. With predictive CSAT, support leaders gain insights into 100% of customer interactions, not just the small subset of survey respondents.
Similarly, AI predicts Customer Effort Score (CES) by analyzing key metrics such as Agent Touches, Ticket Reopens, and Requester Wait Time. These indicators highlight friction points that traditional surveys might overlook. For instance, multiple follow-ups on a single issue often signal a high-effort, frustrating experience.
Nooshin Alibhai, Founder and CEO of Supportbench, highlights the power of AI in understanding customer sentiment:
"AI-powered tools can assess whether a message or conversation sounds positive, negative, or neutral… helping teams detect frustration early and respond with more empathy."
This capability allows teams to act quickly, with platforms using predictive CSAT and CES to flag at-risk interactions as they happen, enabling real-time intervention.
Sentiment Trends and Emotional Scoring
Taking predictive metrics further, sentiment analysis offers another dimension for measuring quality. By tracking the emotional tone of conversations – positive, negative, or neutral – in real time, sentiment analysis helps B2B teams protect key relationships. For example, if sentiment shifts from neutral to negative across multiple interactions, it’s a clear signal to escalate the case to a senior agent or Customer Success Manager.
Emotional scoring goes even deeper, assessing the intensity of customer emotions to identify when frustration is escalating. This allows frustrated customers to be routed to more experienced agents who can better handle the situation. In complex B2B environments, where a single poor experience can jeopardize a renewal, this approach is invaluable.
AI also enables conversation mining, analyzing thousands of interactions to uncover recurring themes and pain points. This helps teams not only understand what customers are saying but also pinpoint the root causes of their frustration. For instance, if sentiment analysis frequently reveals confusion about a specific feature, it provides actionable insights for product development and training teams.
Operational Health Metrics: Preventing Bottlenecks and Delays
While quality metrics help you understand how customers feel, operational health metrics explain why delays occur and where bottlenecks form, allowing teams to address issues before they impact customers. In B2B support, where missing a single SLA can jeopardize a major renewal, these metrics are crucial for maintaining reliability and managing team capacity. Together, they offer a well-rounded view of support performance, ensuring long-term customer satisfaction. By connecting efficiency metrics with proactive operational management, teams can stay ahead of potential problems.
SLA Reliability with Real-Time Adjustments
Traditional SLA tracking uses the formula (Tickets Resolved Within SLA ÷ Total Tickets) × 100 to measure on-time resolution rates. However, leading support teams are moving beyond static compliance reports to focus on real-time SLA breach prevention. Modern platforms now alert managers when SLA limits are approaching, allowing immediate action to avoid breaches.
What sets this approach apart is the ability to dynamically adjust SLAs. Instead of applying the same response times across the board, AI-powered platforms tighten SLAs for high-priority situations – like accounts nearing renewal or customers with declining health scores. This ensures that the most critical relationships receive focused attention at the right time.
In addition, agent productivity metrics paired with utilization data provide insight into workload balance. Overloaded agents risk burnout and delays, while underutilized agents indicate unused capacity. Combining this data with Predicted Backlog, which forecasts ticket spikes based on historical trends, allows teams to allocate resources in advance rather than scrambling to react.
Escalation Frequency and Backlog Risk
To complement SLA management, tracking escalation metrics and backlog risks helps identify process inefficiencies. Escalation Rate, calculated as (Number of Escalated Tickets ÷ Total Tickets) × 100, reveals how often issues require escalation. A rising escalation rate might point to unclear workflows, inadequate training, or product complexities that demand specialist intervention. When tied to specific topics or areas, this metric can highlight documentation gaps or training needs. Similarly, monitoring Transfer Rate – how often tickets are passed between agents – can expose inefficiencies in routing. High transfer rates often indicate delays, which intelligent routing systems can reduce by assigning tickets to the right specialist from the start.
Backlog risk is another critical area to watch. Tracking the Ticket Balance (opened vs. resolved cases) helps maintain healthy operations; when resolutions lag behind new tickets, it signals a growing backlog. Requester Wait Time is another key indicator, flagging long-running cases that require urgent attention. As Bill Bounds from Mailchimp explains:
"Metrics only tell you where to look for the story; they don’t tell you the story itself".
These metrics guide teams in identifying and fixing the processes that need immediate improvement.
Customer Risk and Retention Indicators: Protecting Revenue
After addressing efficiency, quality, and operational health, the next big challenge is monitoring customer risk and retention. While operational metrics measure how well your team performs, retention indicators reveal if those efforts are safeguarding revenue. In high-stakes B2B environments, losing even a single account can mean hundreds of thousands of dollars in lost revenue. This makes tracking churn signals an absolute necessity.
Traditional platforms often focus on metrics like response speed and ticket volume but fail to capture predictive churn patterns. A customer might receive timely, technically accurate responses but still leave due to a frustrating overall experience. Modern support teams need tools that link support interactions directly to account health and potential revenue risk. This connection helps bridge operational performance with long-term revenue protection.
Health Scores from Support Interactions
A well-designed customer health score acts like an early warning system, combining multiple data points into a single, actionable metric. By integrating factors such as ticket frequency, resolution times, SLA compliance, customer sentiment, and feedback from Customer Success Managers (CSMs), support leaders can identify issues before they escalate into cancellations.
For instance, an account might show steady product usage but suddenly see a spike in support tickets paired with negative sentiment scores. AI-driven sentiment analysis can pick up on customer frustration in emails or chat messages, even when the technical issue is eventually resolved. These emotional insights often predict churn more effectively than traditional satisfaction surveys.
Top-performing SaaS companies with $15–30M in annual recurring revenue typically achieve Net Renewal Rates of 115% to 120% by treating support data as a strategic resource. They assign varying levels of importance to different signals – such as prioritizing a negative sentiment score over a slightly delayed response time – to create a balanced health score. When a score drops below a certain threshold, account managers are alerted to intervene before the relationship deteriorates further.
Churn Signals from Support History
While health scores provide a big-picture view of account stability, historical support patterns can reveal specific churn risks. High rates of ticket reopenings and repeat contacts often confirm that initial resolutions were inadequate. Frequent escalations, where tickets are transferred to supervisors or between agents, highlight inefficiencies that damage customer confidence. These patterns increase customer effort, which is particularly harmful, as 88% of CX specialists emphasize the importance of personalization in maintaining loyalty. Repeatedly re-explaining issues undermines this goal.
For accounts nearing renewal, these signals become even more critical. Consistent SLA failures are a major red flag, especially in B2B relationships where response and resolution times are often contractually defined. When combined with declining product usage – one of the clearest indicators of potential churn – support history provides a detailed view of account health.
Modern platforms make it easier to act by automatically flagging repeat contacts and SLA breaches in real time. This allows account managers to step in proactively. These churn signals feed directly into performance dashboards, enabling support leaders to quickly identify accounts at risk and take action before it’s too late. As Gainsight puts it:
"Customer success metrics provide visibility to forecast growth, spot risks, and optimize team impact".
However, this is only possible when teams track the right metrics and respond promptly.
Cost and Scalability Metrics: Growing Without Adding Costs
After addressing customer risk and retention, the next step is to ensure growth happens without unnecessary cost increases. Measuring cost and scalability is crucial to confirm that operational improvements truly lead to sustainable growth. Traditionally, increased volume meant hiring more staff, but in 2026, AI-powered platforms allow businesses to handle spikes in demand without adding to their workforce. The challenge is to measure whether your operations are efficient or just busy by focusing on key metrics.
Cost Per Case
Cost per case is one of the clearest ways to measure support efficiency. To calculate it, divide your total support costs – this includes agent salaries, software subscriptions, AI infrastructure (like LLM token usage), and overhead – by the number of resolved cases. This metric helps identify whether automation is genuinely reducing costs or simply redistributing them. For 2026, it’s essential to include AI-specific costs like API calls, token usage, and the maintenance of automated workflows in your calculations.
AI has the potential to significantly lower interaction costs, cutting them from $15–$25 to just $0.50–$2. For example, AI assistants have been proven to reduce resolution times and service costs, leading to multimillion-dollar savings.
In B2B SaaS scenarios, tracking costs can be more complex. Workflows involving CPQ processes, warranty claims, or multi-stakeholder approvals often depend on contract terms and relationship-specific data. AI can automate many of these decisions, reducing human effort and associated costs. To get the most value from this metric, segment cost per case by complexity. Separating routine inquiries from escalated, multi-touch cases offers deeper insight into where automation is most effective. This segmentation helps support leaders pinpoint where AI delivers the greatest return on investment.
Once cost per case is under control, the next focus is on how AI tools impact agent productivity.
Agent Productivity with AI Tools
While human expertise remains critical for handling complex cases, productivity in 2026 is judged by results, not hours worked. AI tools allow agents to do more without increasing headcount by streamlining tasks. Features like AI copilots, real-time response suggestions, and automated ticket summaries save agents time, enabling them to focus on resolving issues.
AI tools have been shown to increase agent output by an average of 14%, with gains of up to 35% for newer agents. These tools also reduce manual tasks by about an hour per day and shorten cycle times. For instance, a mid-sized insurance company implemented an AI agent for claims processing. Within three months, claims processed per hour rose from 6.2 to 8.1, manual data entry time dropped by 40%, and the average cycle time for standard claims fell from 3.4 days to 2.1 days.
"Agent assistive technologies are huge in their ability to make people feel more confident in their job, more productive in their job, eliminate burnout, and be able to truly measure who’s doing a great job." – Michael Fitzpatrick, CTO, Sequential Technology
When agent productivity increases while cost per case decreases, it’s a strong sign that your support operations are scaling efficiently. If this isn’t happening, it may indicate that your tools aren’t delivering the value they promise. By closely tracking both cost per case and agent productivity, support leaders can assess operational efficiency and scalability, rounding out the performance model for 2026.
Choosing the Right KPIs: Avoiding Vanity Metrics
When it comes to selecting KPIs, focus on metrics that lead to meaningful outcomes. In today’s AI-powered support landscape, the goal should be to measure what truly impacts customers and drives revenue. For B2B support teams, the key question is: does this metric inspire action, or is it just a number that looks good on a dashboard? Activity-based metrics – like total ticket volume or the number of replies – might make your team appear busy, but they don’t necessarily reflect whether customers are thriving, renewing, or expanding their contracts.
Bill Bounds, Former Head of Support at Mailchimp, advises that metrics should serve as a guide to uncover deeper insights rather than being the story themselves. The most effective KPIs point you toward areas that need investigation rather than just presenting surface-level data.
By combining efficiency and quality metrics, you can ensure your KPIs provide actionable insights that drive strategic results. Aim for a set of 8–10 KPIs that align with B2B priorities such as retention, expansion, and overall customer health. A good starting point is the Net Renewal Rate (NRR), which combines renewals and expansion revenue. Top-performing SaaS companies with $15–30M ARR often achieve NRR rates of 115–120%. Another critical metric is the Customer Health Score, which integrates product usage, support history, and AI-driven sentiment analysis to predict potential churn. Include the Customer Effort Score (CES) to measure how easily customers can get the help they need – an indicator closely tied to future loyalty. First Contact Resolution (FCR) is another essential metric, especially when enhanced with AI to confirm issues are resolved on the first try. Lastly, monitor Next Issue Avoidance to assess whether agents are proactively addressing potential future problems instead of merely reacting to current ones. These KPIs should not only be actionable but also directly tied to strategic business goals.
It’s important to move away from workload-focused metrics. For example, high ticket volume might indicate product issues or ineffective onboarding rather than team productivity. Similarly, Average Handle Time (AHT) can be misleading – if calls are too short, it might suggest rushed interactions that hurt long-term customer relationships. Justin Seymour, Customer Support Leader at Help Scout, highlights this point:
"There can be too much emphasis on superficial numbers in support. The team likes to know what our goals are… and how we’re moving the needle month to month".
To ensure your KPIs remain meaningful, they should be actionable, provide an accurate reflection of reality, and be viewed in context. Segmenting metrics by complexity or issue type – for example, comparing resolution times for billing inquiries versus complex workflows – can help identify areas for improvement. Regularly auditing your dashboard is also essential to eliminate metrics that don’t drive action.
Aligning support metrics with broader executive strategies can lead to faster growth – up to 2.3×, according to research. By focusing on retention-related metrics like Customer Lifetime Value (CLV), Logo Retention, and Expansion Percentage, support teams can show how they contribute not just to ticket resolution but also to protecting and growing revenue. When paired with operational and cost metrics, these KPIs provide a complete picture of modern support performance. Looking ahead to 2026, AI-native platforms will allow real-time tracking of these outcome-based metrics, eliminating the need for manual reporting and empowering leaders to make impactful, data-driven decisions.
Conclusion
Measuring customer support performance in 2026 demands a thoughtful, well-rounded approach that goes far beyond counting activities. The best support teams focus on four key areas: efficiency (how quickly and effectively issues are resolved), quality (how customers perceive their experience), customer outcomes (the impact of support on revenue retention or risk), and cost control (maintaining financial sustainability as operations expand). Relying on isolated metrics can lead to missteps. For example, while automation can boost efficiency, it’s counterproductive if it compromises response quality. Similarly, shorter handle times might seem positive, but if they result in rushed or incomplete service, they can harm long-term customer relationships.
The evolution from traditional helpdesks to AI-native platforms has revolutionized how performance is measured. Older systems often depended on manual data collection, which was prone to errors and caused delays in reporting. In contrast, modern platforms provide customer service analytics, eliminating guesswork. Features like predictive analytics allow teams to simulate automation impacts before implementation, while sentiment analysis identifies customer frustration early, enabling timely solutions.
When these advanced metrics align with executive strategies, they can significantly accelerate growth. Research shows that companies with a dedicated, growth-focused C-level leader grow up to 2.3× faster. This success often stems from prioritizing retention-focused metrics, such as Net Renewal Rate (NRR), Customer Health Scores, and Next Issue Avoidance. These metrics highlight how support teams not only resolve issues but also play a critical role in protecting and growing revenue, as demonstrated by top-performing companies.
As Nooshin Alibhai, Founder and CEO of Supportbench, emphasizes:
"Data only makes a difference when it leads to action. With the right metrics, your team can take the next step forward – with clarity, confidence, and results".
The path forward lies in focusing on actionable KPIs, standardizing metric definitions, and automating data collection processes. By balancing operational efficiency, customer outcomes, and cost control, support leaders can gain the comprehensive insights needed to make confident decisions. This balanced approach not only boosts customer satisfaction but also fuels business growth, paving the way for long-term success.
FAQs
How does AI improve First-Contact Resolution in customer support?
AI takes First-Contact Resolution (FCR) to a whole new level by turning it into a proactive and streamlined process. Through natural language processing, AI can instantly categorize incoming requests and direct them to the right agent or self-service option in just seconds, cutting down on unnecessary delays. On top of that, real-time knowledge base suggestions empower agents to deliver precise solutions right away, which helps avoid follow-ups and keeps ticket reopenings to a minimum.
Another game-changer is AI’s ability to analyze customer sentiment. This allows it to spot potential escalations early, enabling actions like assigning a senior specialist or crafting a tailored response before issues grow bigger. AI-driven platforms also monitor how automation impacts FCR by comparing bot-handled resolutions to those managed by humans. This approach lets agents focus on more complex problems while still delivering quick, thorough answers – even in intricate, multi-stakeholder B2B situations. The outcome? Higher FCR rates, smoother operations, and lower support costs.
How does sentiment analysis help predict customer satisfaction?
Sentiment analysis is a game-changer for gauging customer satisfaction. It works by examining the tone and emotions behind customer interactions, helping businesses identify whether the sentiment is positive, neutral, or negative. With this real-time feedback, support teams can quickly address concerns before they grow into bigger problems, ensuring smoother customer experiences.
Today’s AI-driven tools take sentiment analysis to the next level. They can pick up on subtle patterns and trends, providing predictive insights into how customers feel. These insights empower businesses to focus on high-risk situations, enhance service quality, and build stronger, lasting relationships with their customers.
How do customer health scores help reduce churn in B2B support?
Customer health scores bring together crucial data – such as usage trends, support interactions, and engagement metrics – into one clear, actionable measure of account health. This makes it easier for B2B support teams to spot at-risk customers early and step in to resolve potential problems before they escalate into churn.
With real-time insights into customer behavior and satisfaction, health scores help teams focus on high-risk accounts and fine-tune their retention strategies. Businesses that leverage health scores effectively often see a noticeable drop in churn rates and stronger customer loyalty.