
When your CSAT score is based on a small number of responses, it can be highly unreliable. For example, an 88% score from just 15 responses doesn’t tell the full story – it hides the uncertainty caused by limited data. Confidence intervals (CIs) help by showing the range within which the true score likely falls, making your data more reliable for decision-making.
Key takeaways:
- Small sample sizes are risky: A single outlier can skew results, and wide CIs indicate uncertainty.
- CIs quantify uncertainty: Instead of focusing on a single score, CIs show the potential range, helping you avoid overreacting to random fluctuations.
- Renewal risks: Sparse feedback in B2B accounts may miss important stakeholder insights, jeopardizing renewal decisions.
- AI tools simplify this: Platforms like Supportbench automate CI calculations and predict satisfaction for non-responders, saving time and reducing errors.
Why Low CSAT Volumes Create Misleading Results in B2B Support
Problems with Small Sample Sizes
When it comes to small CSAT, CES, and NPS sample sizes, precision takes a hit. A score like 4.2 out of 5 might seem definitive, but if it’s based on just a handful of responses, it paints a misleading picture. Here’s an example: with only 10 responses and a mean score of 3.20, the 95% confidence interval could stretch from 2.14 to 4.26 – covering more than half of a standard 5-point scale [6].
The math behind this is straightforward but challenging. To cut the margin of error in half, you need four times the sample size [5]. So, moving from 10 responses to 40 only slightly narrows the range. Sudipto Paul from G2 explains it well:
"A confidence interval of ±2 points on a sample of 10,000 survey responses is rock-solid. The same ±2 point range on a sample of 45 is fragile and likely meaningless" [1].
Outliers are another headache when dealing with small volumes. One highly dissatisfied customer can drag down the average, while a single promoter can make the score look overly positive. This sensitivity to extremes can lead companies astray. As Ron Sielinski, a Data Scientist at Microsoft, warns:
"Unless companies account for uncertainty in their CSAT scores, they risk wasting time chasing meaningless period-over-period changes, investing in ineffectual programs, and missing real opportunities to improve customer satisfaction" [6].
The issue gets worse when data is segmented. B2B leaders often break down CSAT scores by product line, support tier, or account size. Each slice reduces the sample size further, making the numbers even less reliable [1][6]. For instance, if your score jumps from 2.8 to 3.8 between quarters, you might celebrate. But if the confidence intervals overlap, that "improvement" could just be random noise [6].
In short, small sample sizes not only reduce statistical reliability but also increase the risk of misdirected decisions – especially in cases involving high-stakes accounts.
How Limited Feedback Affects Renewal-Driven Accounts
The challenges of low CSAT volumes go beyond statistics – they can create blind spots in renewal-driven B2B relationships.
Unlike consumer support, where thousands of interactions are analyzed, B2B support deals with fewer but higher-stakes relationships. Sparse feedback in these scenarios can leave critical insights out of the equation. This is particularly risky when accounts rely on renewal revenue.
One major concern is the disconnect between stakeholders. B2B accounts often involve buying committees, which include end users, administrators, executives, and procurement teams. Limited feedback tends to reflect only the views of day-to-day users, leaving out insights from executives who assess ROI and renewal risks [7]. As Julien Quintard, Founder & CEO of Routine, explains:
"CSAT reveals customer feelings about the latest interaction, not the overall relationship" [7].
Small sample sizes also introduce self-selection bias. Typically, only the most satisfied or dissatisfied users respond, while the majority – those moderately satisfied – remain silent [1][4]. This skews the data, making it harder to gauge the true sentiment across the account.
These challenges, when combined, can significantly impact renewal decisions. Here’s a breakdown of the risks:
| Factor | Impact on Renewal Decisions | Risk Level |
|---|---|---|
| Small Sample Size | Wide confidence intervals make it hard to separate noise from real issues | High |
| Stakeholder Gaps | Missing feedback from decision-makers leads to an incomplete account view | Critical |
| Self-Selection Bias | Overrepresentation of extremes misrepresents overall sentiment | High |
Low CSAT volumes don’t just skew statistics – they also risk leaving you blind to crucial factors that drive account health and renewal outcomes.
sbb-itb-e60d259
Confidence Intervals, Clearly Explained!!!
Using Confidence Intervals to Analyze Low-Volume CSAT Data
How to Calculate Confidence Intervals for CSAT Scores: 7-Step Formula
Low CSAT response volumes can make it tricky to draw meaningful conclusions. Confidence intervals offer a way to handle this uncertainty by providing a clearer picture of what the data might actually represent.
What Confidence Intervals Mean
A confidence interval (CI) represents the range where the true CSAT score likely falls [8][4]. For example, instead of simply stating "our CSAT is 4.2", a confidence interval might indicate that the true score is between 3.5 and 4.9. This approach helps account for the uncertainty associated with small sample sizes [1][4].
The confidence level – often set at 95% – reflects how reliable the interval is. A 95% confidence level means that if you repeated the survey 100 times, approximately 95 of those intervals would capture the true score [8][4]. The margin of error, which is the radius of the interval, shows how much random sampling error exists in your results [9].
For B2B support leaders, confidence intervals are a valuable tool to separate random noise from actual changes in customer satisfaction [4]. For instance, if two support tiers have overlapping confidence intervals, their CSAT scores are likely not significantly different. As Mike Taylor from SurveyNinja explains:
"Confidence intervals make research results more honest. They shift the conversation from ‘What is the number?’ to ‘How sure are we?’" [4]
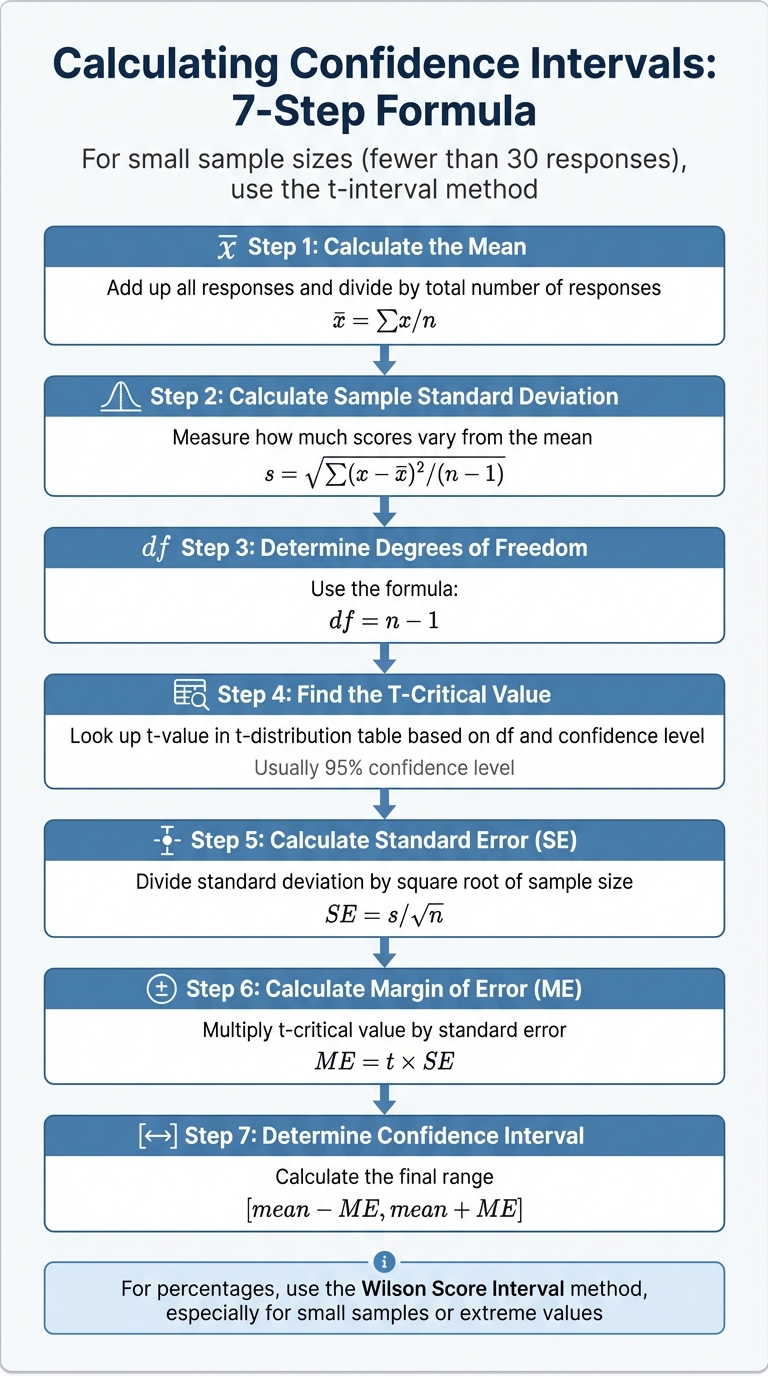
How to Calculate Confidence Intervals: Step-by-Step Formula
For small sample sizes (fewer than 30 responses), the t-interval method is the way to go, as it accounts for the added uncertainty in limited data [8].
Here’s how you calculate a confidence interval for an average CSAT score:
- Step 1: Calculate the Mean
Add up all responses and divide by the total number of responses. - Step 2: Calculate the Sample Standard Deviation
Measure how much the scores vary from the mean. - Step 3: Determine Degrees of Freedom
Use the formula: df = n – 1. - Step 4: Find the T-Critical Value
Look up the t-value in a t-distribution table based on your degrees of freedom and desired confidence level. - Step 5: Calculate the Standard Error (SE)
SE = s/√n, where "s" is the standard deviation and "n" is the sample size. - Step 6: Calculate the Margin of Error (ME)
Multiply the t-critical value by the standard error: ME = t × SE. - Step 7: Determine the Confidence Interval
The range is given by [mean − ME, mean + ME] [8][9].
For percentages, the Wilson Score Interval is recommended, especially for small samples or extreme values [8].
How Sample Size and Variation Affect Interval Width
The width of a confidence interval depends on three key factors: sample size, variability, and confidence level. Understanding these factors helps interpret confidence intervals more effectively.
| Factor | Change | Impact on Interval Width | B2B Support Context |
|---|---|---|---|
| Confidence Level | Increase (e.g., from 95% to 99%) | Widens | A higher confidence level requires a broader range to ensure the true CSAT is captured. |
| Sample Size (n) | Increase (e.g., from 10 to 50 responses) | Narrows | More responses reduce uncertainty and tighten the interval. |
| Variation (s) | Increase (e.g., polarized feedback) | Widens | Greater variability makes the average less predictable. |
In low-volume B2B environments, wide confidence intervals often indicate that a strong CSAT score might be more about sample size than actual performance [1][4]. This perspective helps leaders focus on meaningful trends rather than reacting to random fluctuations. By grounding decisions in statistics, support teams can better navigate the challenges of modern, data-driven operations.
Making Better Support Decisions with Confidence Intervals
How to Read and Use Confidence Intervals
Instead of zeroing in on a single CSAT (Customer Satisfaction) score, it’s more useful to focus on the confidence interval (CI) range. This range provides a clearer picture of certainty and helps support leaders make smarter, cost-effective decisions, especially when incorporating AI-driven tools.
Take this example: a 60% CSAT score from just 15 responses gives a 95% CI of 40%–80%. That means the true satisfaction level could be significantly lower or higher. In such cases, collecting more data before making big decisions is the best move.
When comparing support tiers or time periods, overlapping confidence intervals indicate that differences might just be due to random variation. For instance, if Tier 1 has a CSAT of 65% (CI: 55%–75%) and Tier 2 shows 70% (CI: 60%–80%), the overlap suggests the difference isn’t statistically meaningful. Treat these variations as noise until additional data narrows the intervals.
Strategic changes should only be implemented when the CI consistently exceeds your target metrics. Say your goal is a 75% CSAT – don’t celebrate too soon. Wait until the lower bound of the CI rises above 75%. Similarly, if a process change yields a CI spanning neutral values (e.g., –1% to +3%), it’s better to view the result as inconclusive rather than evidence of success or failure.
When sharing CSAT trends with stakeholders, use visual tools like dashboards with error bars or shaded areas to clearly show data uncertainty. As you gather more responses and intervals become narrower, you can confidently identify emerging trends.
These practices lay the groundwork for integrating AI-driven predictions, which take support strategies to the next level.
Combining AI-Driven Predictive CSAT with Confidence Intervals
Confidence intervals provide a solid foundation for decision-making, but AI tools can take things further by predicting customer sentiment from those who don’t respond to surveys. For example, Supportbench’s predictive CSAT features work hand-in-hand with CI analysis to offer a more complete view of account health. While CIs measure the reliability of the data you have, predictive AI estimates satisfaction for the silent majority of customers.
This combination is a game-changer for proactive support management. Predictive AI can forecast satisfaction on tickets without direct feedback, while confidence intervals quantify the possible range of outcomes and their uncertainty. Imagine AI predicts a 72% CSAT for a high-value account, but the CI spans 50%–94%. That wide range signals significant uncertainty, suggesting the need for further investigation.
Automated tools make it easy to calculate CIs across hundreds of metrics – something that would be nearly impossible to do manually [1][3]. Supportbench’s AI capabilities integrate seamlessly with CI analysis, using techniques like the Adjusted Wald method. This method smooths out extreme values in small datasets, ensuring consistent interpretation across the team without requiring deep statistical expertise.
Common Mistakes and How to Automate Confidence Interval Analysis
Mistakes to Avoid When Using Confidence Intervals
When working with low-volume B2B support data, misunderstanding confidence intervals can lead to poor decisions. One frequent mistake involves misinterpreting what a 95% confidence interval actually represents. It doesn’t mean there’s a 95% chance the true CSAT score lies within the range. Instead, it means that if you took 100 samples, about 95 of those intervals would capture the true value [1].
Another error is relying on narrow intervals from small sample sizes. For instance, intervals based on fewer than 45 responses can appear precise but might not be trustworthy [1]. If your sample size drops below 30, it’s critical to check for normality (using tools like QQ-plots). Otherwise, your confidence interval calculations could be invalid [2]. Sampling bias is another trap – if your survey responses come mostly from highly engaged or dissatisfied users, your interval might be precise but won’t reflect your overall customer base.
Support leaders also sometimes misinterpret overlapping intervals, assuming overlap means there’s no difference between two groups, such as support tiers or time periods. While this is a common rule of thumb, it’s not a definitive statistical conclusion [4]. Lastly, many teams default to 95% or 99% confidence levels without considering the context. In fast-paced situations, like early-stage experiments, a 90% confidence level might be a better fit [1].
By understanding these common pitfalls, support teams can make better use of AI-native tools to standardize and simplify CSAT analysis.
Automating CSAT Analysis with AI-Native Tools
Automation is a game-changer for CSAT analysis, helping teams sidestep the common errors mentioned above. Manual calculations in tools like Excel or Google Sheets can take 10–15 minutes per analysis and are prone to mistakes – like forgetting to lock cell references or selecting the wrong data range [11]. AI-native platforms eliminate these risks entirely, offering fast and accurate analysis. For example, tools like Supportbench calculate the mean, standard deviation, margin of error, and confidence intervals in just seconds, often through simple prompts or one-click functionality [10].
Supportbench takes automation a step further by using the Adjusted Wald method to handle small datasets effectively. This method adds a statistical adjustment (around +2 to the numerator and +4 to the denominator for a 95% confidence interval) to reduce bias in low-volume CSAT data [3]. This ensures that even teams without deep statistical knowledge can interpret results consistently.
The platform also includes advanced features like CSAT and CES Prediction, which uses sentiment analysis to estimate scores for customers who didn’t respond to surveys [12]. By combining actual survey data with AI-predicted scores, teams can build a more comprehensive dataset, addressing the challenges of low response rates.
As Spencer Lanoue, Product Builder at Bricks, explains:
"Using them [confidence intervals] in your reports helps your audience understand the reliability of your data, preventing them from overreacting to small changes that might just be statistical noise." [11]
Supportbench makes this even easier by visualizing data uncertainty with error bars and shaded bands on dashboards. This allows stakeholders to quickly grasp the reliability of the data. At a cost of $32–$40 per agent per month for the Professional plan, the platform includes intelligent support AI, survey tools, and AI-driven reporting without hidden fees [12]. This makes advanced statistical analysis accessible to support teams of all sizes.
Conclusion
Small CSAT samples often fail to reflect true customer satisfaction, but confidence intervals help quantify the uncertainty behind these results. By turning small-sample feedback into a measurable range, confidence intervals allow you to separate real trends from random fluctuations. As Sudipto Paul, SEO Content Lead at G2, puts it:
"Confidence intervals aren’t just theoretical tools. They are essential instruments of risk management in data-driven decision-making" [1].
While this approach is powerful, manually calculating confidence intervals can be tedious and prone to errors. That’s where AI-powered tools step in. Supportbench simplifies these calculations – even for small datasets – by using reliable statistical methods like the Adjusted Wald technique.
With automated confidence interval analysis and AI-driven predictive CSAT, support leaders can address gaps caused by non-responders and gain a fuller view of customer satisfaction. The platform also visualizes uncertainty through error bars and shaded bands, making complex statistics easy to understand for decision-makers. This clarity helps stakeholders act quickly on renewals, resource planning, or process improvements.
At $32 per agent per month, Supportbench transforms low-volume data into actionable insights, providing a dependable framework for ongoing improvement.
FAQs
What CSAT sample size is “too small” to trust?
When it comes to CSAT (Customer Satisfaction) surveys, a sample size is considered "too small" when the number of responses is so low that the insights become unreliable. This happens because smaller samples tend to produce wider confidence intervals, making the results less precise and increasing the margin of error. While there’s no universally defined minimum threshold, larger sample sizes are critical for narrowing confidence intervals and obtaining more dependable data – particularly when dealing with low CSAT response volumes.
How do I know if a CSAT change is real or just noise?
To figure out if a change in your CSAT score is meaningful or just random fluctuation, you can rely on confidence intervals. These help you evaluate how reliable your data is.
Here’s how it works: Calculate the confidence interval for your CSAT scores both before and after the change. Then, compare the two intervals:
- If the intervals overlap significantly, it’s likely just noise – nothing to act on.
- If the intervals don’t overlap, that’s a strong sign of an actual shift in customer satisfaction.
Keep in mind, larger intervals mean more uncertainty, while smaller, non-overlapping intervals are more likely to indicate a real change. This approach helps you avoid jumping to conclusions based on unreliable data.
How should I combine predictive CSAT with confidence intervals?
Using confidence intervals alongside predictive CSAT scores allows you to measure the uncertainty in AI-predicted satisfaction scores. This approach helps you evaluate the reliability of predictions and make smarter decisions.
Here’s how it works:
- Generate predictive CSAT scores: Start by using AI models to predict customer satisfaction.
- Calibrate predictions with actual responses: Compare predicted scores to real-world feedback to fine-tune the model.
- Calculate confidence intervals: Apply statistical methods to determine the range within which the true satisfaction score likely falls.
By focusing on predictions with narrow confidence intervals or higher certainty, you can achieve more reliable results. This method not only improves prediction accuracy but also gives you a clear understanding of how much trust you can place in the data for decision-making.