
Want to predict churn before it’s too late? Most B2B companies rely on metrics like CSAT and NPS, but these often flag issues after customers have already decided to leave. Instead, focus on leading indicators like Customer Effort Score (CES), escalation rates, and behavioral trends. These metrics can identify churn risks months in advance, giving you time to act.
Key Takeaways:
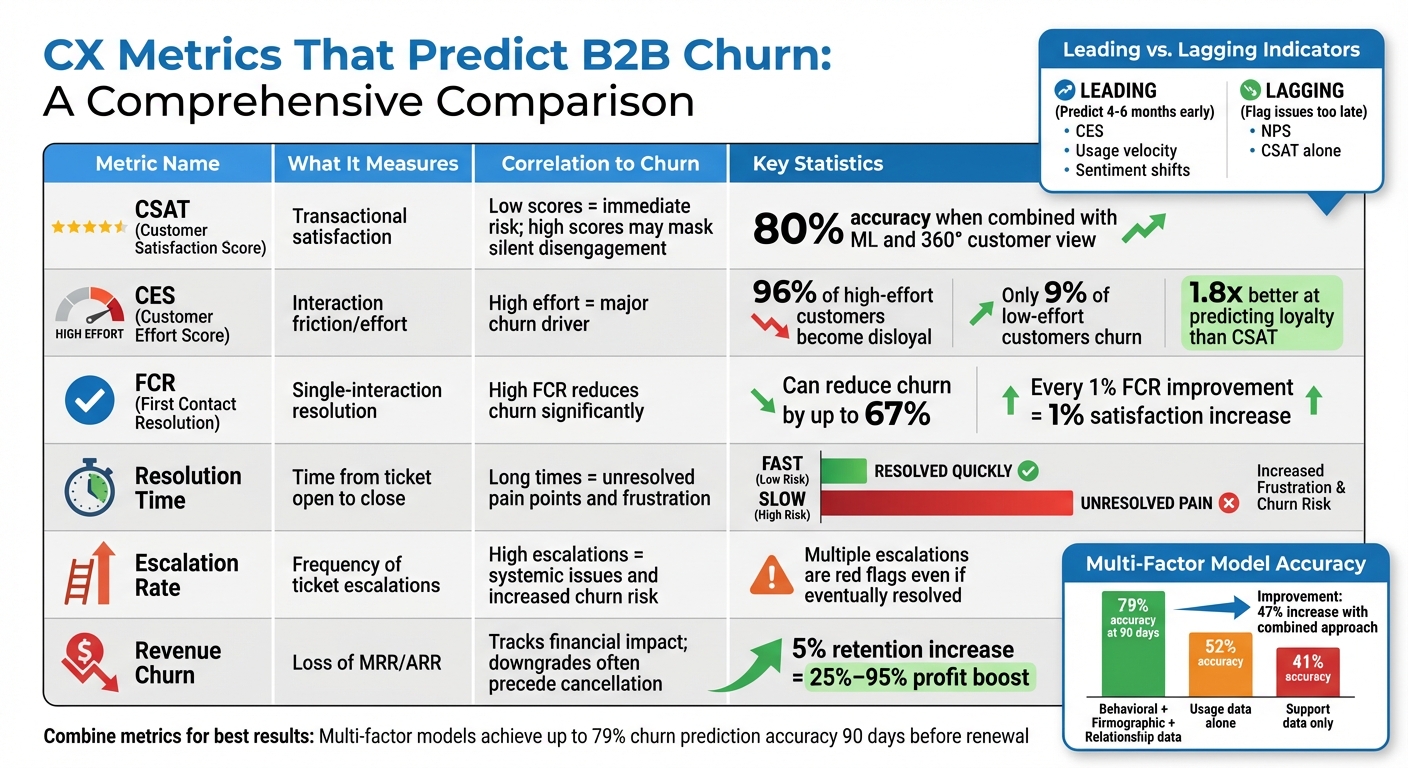
- High-effort interactions (CES) drives churn: 96% of customers with high-effort experiences leave, compared to just 9% with low-effort resolutions.
- Escalation rates and resolution time signal friction: Frequent escalations and delays highlight systemic issues that frustrate customers.
- Behavioral data beats surveys: Usage drops, sentiment shifts, and disengagement are better predictors than traditional surveys like CSAT or NPS.
- Combine metrics for accuracy: Multi-factor models integrating CES, product usage, and relationship data can predict churn with up to 79% accuracy.
Why It Matters:
Retaining just 5% more customers can boost profits by 25%-95%. By tracking the right metrics and using AI-driven tools, you can detect risks early and reduce churn significantly.
Let’s dive into the metrics and how to track them effectively.
Churn Risk Analytics: How to Predict and Prevent Customer Loss
CX Metrics That Predict B2B Churn
B2B CX Metrics Comparison: Churn Prediction Effectiveness
Traditional surveys like CSAT and NPS provide a limited view of customer experience. A more accurate way to predict churn combines transactional feedback with real-time behavioral data. By examining how customers actually interact with support, you can pinpoint friction points that often signal churn risks.
Customer Satisfaction Score (CSAT)
CSAT measures how satisfied customers are after an interaction, but it doesn’t always reveal deeper frustrations. For instance, a customer might rate an interaction highly because the agent was polite and the issue seemed resolved, yet they could still be annoyed if they had to repeat their problem multiple times.
Jonas Schuetz, Senior Director of Customer Experience at Kantar Germany, sums it up well:
"If you’re only measuring what’s easy to track, you’re missing what matters most".
To make CSAT more useful for predicting churn, pair it with tools like sentiment analysis. AI-driven platforms can scan open-ended survey responses for signs of frustration or disengagement, even when customers provide positive ratings. One company used this approach, integrating machine learning with a 360-degree customer view, and achieved an 80% accuracy rate in predicting churn.
Customer Effort Score (CES)
CES gauges how easy it is for customers to resolve their issues by tracking factors like follow-ups, escalations, and repeated interactions. In B2B settings, high-effort experiences – such as explaining the same issue to multiple agents – are a major churn driver. Research shows that 96% of customers with high-effort interactions become disloyal, compared to just 9% of those with low-effort resolutions.
Dan Guo from Pylon highlights this challenge:
"Effort can have a big impact on customers – even when they get a helpful answer, the experience can still feel frustrating if the customer has to repeat their issue to multiple people".
AI tools can automatically track CES by analyzing metrics like resolution time, the number of agent touches, and how often tickets are escalated. This real-time tracking helps identify accounts experiencing friction before customers decide to leave.
First Contact Resolution (FCR) Rate
FCR measures whether an issue is resolved in a single interaction, making it a key indicator of customer effort. Higher FCR rates significantly reduce churn, with studies showing that improving FCR can cut churn by up to 67%. Additionally, every 1% improvement in FCR typically boosts overall customer satisfaction by 1%.
However, traditional methods often struggle to measure true FCR, relying on agents to manually mark tickets as resolved. Advanced AI systems can analyze the entire case history – tracking follow-ups, reopened tickets, and customer sentiment – to determine whether an issue was genuinely resolved or if the customer simply gave up.
Resolution Time and Escalation Rates
Average Resolution Time (ART) measures how long it takes to close a ticket, while escalation rates track how often issues are passed to higher-level support. Long resolution times and frequent escalations often point to unresolved pain points and systemic inefficiencies.
For example, if a high-value customer’s ticket is escalated multiple times and involves several agents, it’s a red flag – even if the issue is eventually resolved. Such experiences can prompt customers to seek alternatives.
To address this, SLA management and workflow automation tools can monitor these metrics in real time. Alerts can notify account managers when a high-value ticket exceeds a certain number of touches or breaches an SLA, allowing for proactive intervention before the situation worsens. These metrics also contribute to a broader customer health score that links support performance to revenue retention.
Revenue Churn and Customer Health Scoring
In B2B contexts, the loss of an account (customer churn) and the loss of revenue (revenue churn) don’t always happen simultaneously. For instance, an account might stay active but reduce spending by downgrading plans or cutting seat counts, signaling an early warning of potential full cancellation.
Revenue churn is especially critical because losing a single high-value account can have a much greater financial impact than losing multiple smaller accounts. As Scribe’s Customer Success Lead explains:
"Churn is the ultimate indicator of a failure to retain customers. The impact of a customer churning is not just the loss of [a company’s] current revenue, but also all of their potential expansion revenue".
By combining support metrics like CSAT, CES, and escalation rates with product usage data – such as login frequency, feature adoption, and seat utilization – you can create a comprehensive customer health score. This score helps identify at-risk accounts early, giving teams a chance to act before customers cancel entirely. Even a 5% increase in retention rates can boost profits by 25% to 95%.
| Metric | What It Measures | Correlation to Churn |
|---|---|---|
| CSAT | Transactional satisfaction | Low scores indicate immediate risk; high scores may mask "silent" disengagement |
| CES | Interaction friction/effort | High effort is a major driver of churn; aligns with inefficiency |
| FCR | Single-interaction resolution | High FCR reduces churn by up to 67%; low FCR signals broken processes |
| Resolution Time | Time from ticket open to close | Long times highlight unresolved pain points and frustration |
| Escalation Rate | Frequency of ticket escalations | High escalations point to systemic issues and raise churn risk |
| Revenue Churn | Loss of MRR/ARR | Tracks financial impact; downgrades often precede full cancellation |
How to Build a Predictive Churn Model
Creating a predictive churn model involves combining structured data, selecting the right signals, and refining the approach over time. The aim is to spot at-risk accounts 90 to 180 days before renewal, giving teams enough time to act before customers make their final decision. The first step? Consolidate all your data sources.
Step 1: Integrate Your Data Sources
Data silos are a major hurdle. Behavioral, firmographic, and relationship data are often kept separate, which lowers prediction accuracy. To build a reliable model, you’ll need to unify metrics like CSAT, CES, ticket volume, sentiment analysis, CRM data, and product analytics into one cohesive dataset.
Here’s why this matters: multi-factor models that combine behavioral, firmographic, and relationship data can achieve up to 79% accuracy in predicting churn 90 days before renewal. In contrast, models relying solely on usage data hit only 52% accuracy. Combining these data types improves prediction accuracy by 47% compared to behavioral data alone.
Before diving into model creation, audit your data quality. Make sure CRM systems have accurate renewal dates and ownership details, and confirm that support platforms consistently track sentiment scores and resolution metrics. Modern AI platforms can help unify these sources automatically, reducing manual errors and ensuring predictions are based on up-to-date information.
| Data Category | Key Data Points to Integrate | Predictive Value |
|---|---|---|
| Behavioral | Login frequency, feature adoption, API usage, session duration | High (indicates product stickiness) |
| Firmographic | Company size, M&A activity, budget cycles, industry trends | Medium (indicates external pressures) |
| Relationship | Executive engagement, QBR attendance, response rates | High (indicates account resilience) |
| Support/CX | CSAT, CES, ticket volume spikes, sentiment scores | High (indicates immediate friction) |
Step 2: Select the Right Features
The secret to a successful model lies in identifying leading indicators – signals that appear early enough for intervention. Lagging indicators, like NPS scores, often reflect issues that have already escalated. Doug Norton, Senior Director of Customer Success at BILL, explains:
"The real magic happens when data scientists are able to uncover truly ‘leading’ indicators of churn – i.e. the things that correlate with churn AND that indicate the outcome is not already a foregone conclusion".
Start with a straightforward method: identify the top five signals from your historical data that correlate with churn. Examples might include a 30% drop in login frequency, a change in executive sponsorship, or a spike in billing-related tickets. Assign weights to these indicators and segment your models by customer size to avoid false positives.
Focus on early signals like usage velocity and sentiment analysis. For instance, Customer Effort Score (CES) is 1.8 times better at predicting loyalty than CSAT because it measures friction rather than satisfaction. Similarly, sentiment analysis using natural language processing (NLP) can detect customer frustration in tickets long before they submit a survey.
For enterprise accounts, churn risks might show up in relationship data, like disengaged executive sponsors or declining QBR attendance. On the other hand, SMB accounts are often more sensitive to metrics like usage frequency or time-to-value. Once you’ve identified the right features, you’re ready to train your model.
Step 3: Train and Refine Your Model
To build an effective model, you’ll need 12 to 24 months of historical data to identify patterns that emerge before renewal decisions. Test your model on past churned accounts to see if it would have flagged them as high-risk 90 days before cancellation. The best models typically achieve 75% to 82% accuracy at this prediction horizon.
Start with simple, rules-based models before moving to machine learning. Ed Powers, a Customer Success Leader at Service Excellence Partners, emphasizes simplicity:
"I teach my clients and students to build data-driven customer health scores using regression. This reduces subjectivity and dramatically improves predictive accuracy. For example, I recently helped a client implement a model that was 95% accurate using only 3 factors".
Refine your model by analyzing false negatives and adjusting weights. Include a "context override" feature so Customer Success Managers (CSMs) can flag false positives, like usage drops caused by holiday shutdowns, to maintain trust in the system.
Be cautious about data leakage – train your model only on information that would have been available at the time of prediction. For organizations managing 500+ clients, transitioning to machine learning can increase accuracy by up to 18 percentage points, but only if the data is clean and consistent.
sbb-itb-e60d259
How to Track CX Metrics in B2B Support
Once you’ve implemented a predictive model, keeping tabs on customer experience (CX) metrics becomes essential for staying ahead of potential churn. In complex, multi-channel environments, manual tracking just doesn’t cut it. AI-powered tools streamline data collection, highlight early warning signs, and enable timely interventions. By integrating these tools with your predictive model, you can maintain a constant pulse on customer health.
Automated Surveys and Sentiment Analysis
Traditional post-interaction surveys like CSAT or CES often miss the bigger picture. By the time a customer fills one out, their opinion has likely solidified. AI, however, brings a new level of insight by analyzing every single interaction – emails, Slack messages, call recordings, and ticket responses. This allows it to detect subtle shifts in emotional tone, frustration, or urgency that manual reviews might overlook.
Using Natural Language Processing (NLP), AI scans these interactions in real time, assigning sentiment scores that feed directly into your churn prediction model. For instance, in 2025, Cynet, a B2B cybersecurity firm, used Generative AI to arm their reps with instant answers and automate Tier 1 ticket handling. The results? A 14-point boost in CSAT (from 79 to 93), a 47% ticket deflection rate, and resolution times nearly halved.
It’s worth noting that Customer Effort Score (CES) is 1.8 times more effective at predicting customer loyalty compared to CSAT. That’s because CES focuses on the friction customers experience rather than their satisfaction.
Real-Time Dashboards and Alerts
Automated surveys are just one piece of the puzzle. Real-time dashboards pull everything together, offering a unified, actionable view of customer health. Unlike weekly or monthly reports, real-time dashboards provide instant visibility into trends like sentiment changes, ticket volumes, and behavioral patterns. These dashboards integrate data from tools like CRM systems, support desks, product analytics, and communication platforms, giving your team a complete picture.
Tracking trends over time is key. For example, a 30-day average sentiment score or a sudden dip from a historical baseline is a stronger indicator of churn than a single negative survey. To act quickly, set up tiered alerts based on account value. For a high-value enterprise account, a negative sentiment score might require immediate executive involvement, while lower-value accounts may follow standard check-in protocols.
Here’s a simple framework for volume-based alerts:
| Volume Pattern | CS Action | Timeline |
|---|---|---|
| 3x spike in 7 days | Immediate executive sponsor check-in | Within 24 hours |
| 50% increase for 30 days | Schedule deep-dive meeting to identify root causes | Within 1 week |
| Zero tickets for 60+ days | Launch a proactive engagement campaign | Within 1 week |
| Same issue >3 times | Escalate to product team for a permanent fix | Within 48 hours |
Pay attention to both surges in ticket activity and periods of inactivity. For example, no interactions for more than 60 days could indicate disengagement. AI-powered dashboards can flag these accounts automatically, giving your team the chance to re-engage before renewal discussions even start.
Workflow Automation and SLA Management
Managing complex B2B accounts manually – especially when urgency and account value vary widely – can quickly become overwhelming. AI-driven workflows take the guesswork out of ticket prioritization by routing cases to the right team based on factors like sentiment, account value, and issue complexity. This ensures that critical issues land in the hands of the right experts.
Dynamic SLA management adds another layer of precision. For example, if an enterprise account’s sentiment score drops below -35, the system can automatically tighten SLAs and escalate the case to a senior engineer – no manual input required. This kind of responsiveness is crucial in a world where 90% of customers expect an "immediate" response, with 60% defining "immediate" as within 10 minutes.
AI can also identify recurring friction points. If sentiment analysis reveals delays in resolving certain issues, the system can flag these for updates to internal documentation or product guides, preventing similar problems in the future. As Lindsay Fifield, Director of Customer Success at Forethought, puts it:
"A healthy CX team doesn’t just keep track of metrics – they really dig into what those numbers mean. Setting up a solid system to organize and review your metrics regularly helps spot trends and issues early, so you can make changes before problems get big".
Modern platforms like Supportbench embed these capabilities directly into case management. They automatically log key metrics like First Response Time (FRT) and Resolution Time, analyze sentiment shifts, and calculate churn probabilities (on a 0-100% scale) by combining support data with product usage insights. Businesses using AI-powered support tools report an impressive $3.50 return for every $1 invested.
Common Mistakes When Tracking CX Metrics
Even with advanced AI tools at their disposal, many B2B support teams still fall into traps that undermine their ability to predict churn effectively. These missteps can obscure key warning signs, leading to missed opportunities to intervene and retain valuable customers.
Relying on Point-in-Time Metrics
Metrics like CSAT or NPS provide a snapshot of past sentiment, but they’re not reliable for predicting future behavior. A single score doesn’t capture the bigger picture. Instead, the real value lies in observing trends over time. For example, a customer whose sentiment score drops from +40 to -10 over 30 days signals a much higher churn risk than someone who had one isolated bad experience scoring -15.
To address this, focus on continuous monitoring rather than isolated data points. Multi-factor models that track trends across behavioral, firmographic, and relationship data can achieve up to 79% accuracy in predicting churn 90 days before renewal. A better approach is to use 30-day rolling averages for sentiment and compare those against historical averages. This method filters out the noise from one-off incidents and highlights the true trajectory of the customer relationship.
As Sarah Mitchell, Chief Marketing Officer, explains:
"The pattern of decline matters more than absolute levels".
Ignoring Behavioral Signals
Another common mistake is focusing too heavily on survey-based metrics like CSAT or NPS while overlooking behavioral data. What customers do often tells a more accurate story than what they say. For example, a drop in login frequency, reduced feature usage, or a sudden spike in support tickets can signal trouble months before traditional churn indicators appear.
One overlooked sign is when a customer has no support interactions for over 60 days. This might seem like a positive sign, but it often points to disengagement and the risk of silent churn. Models that incorporate behavioral signals can predict churn as much as 4–6 months earlier than those relying on surveys alone.
To mitigate this, trigger proactive health checks when behavioral red flags arise, such as prolonged inactivity or declining usage trends.
Failing to Segment by Customer Value
Applying a one-size-fits-all approach to churn prediction can lead to inaccuracies. Churn drivers vary significantly across customer segments, and using a universal model can create unnecessary noise and false positives.
For instance, enterprise accounts with $100,000+ Annual Contract Value (ACV) are more influenced by relationship signals like executive sponsor engagement or quarterly business review (QBR) attendance. On the other hand, SMB accounts under $20,000 ACV are more impacted by product usage and onboarding success. Segment-specific models can improve prediction accuracy by 23%.
It’s also critical to track revenue churn alongside customer churn. Losing a single enterprise customer can have the same financial impact as losing ten small accounts. A blended churn rate might not reveal this disparity. Additionally, sentiment scores should be weighted by account value. For example, a -35 sentiment score from a high-value enterprise client should trigger immediate executive action, while the same score from a lower-value account might only require automated follow-up.
| Segment | Primary Churn Signals | Metric Weighting |
|---|---|---|
| Enterprise ($100K+ ACV) | Executive turnover, budget cuts, QBR attendance | Relationship signals take priority; usage is secondary |
| Mid-Market ($20-100K ACV) | Declining feature adoption, champion stability, competitive evaluations | Balanced focus on usage and relationship data |
| SMB (Sub-$20K ACV) | Usage frequency, onboarding success, payment issues | Heavy emphasis on usage; firmographic data matters less |
Conclusion
Predicting churn in B2B support isn’t about collecting endless amounts of data – it’s about focusing on the right signals. Behavioral trends, firmographic details, and relationship dynamics are the key indicators that drive accurate churn predictions. Models that integrate these factors can reach 79% accuracy up to 90 days before renewal, far outperforming the 41% accuracy of models relying solely on support data.
The financial impact of reducing churn speaks for itself. Retaining just 5% more customers can boost profitability by 25% to 95%, while improving First Contact Resolution not only lowers operating costs but can cut churn by as much as 67% . These results come from acting on leading indicators like usage velocity and sentiment trajectory, instead of waiting for lagging metrics like NPS scores or renewal deadlines.
AI-powered tools amplify this effort by identifying subtle shifts in sentiment and usage patterns. For instance, Natural Language Processing (NLP) extracts sentiment insights from every interaction, and machine learning uncovers patterns across thousands of variables that would otherwise go unnoticed. Companies adopting AI-driven support solutions see an average return of $3.50 for every $1 invested, with advanced models predicting churn 4–6 months earlier than traditional methods .
Integration is another critical piece of the puzzle. Real-time risk scores fed into your CRM and support systems enable immediate action when warning signs appear – like a drop in sentiment or a surge in ticket volume. These AI-driven risk scores can be segmented to match account value. For example, enterprise accounts often respond to relationship signals such as executive turnover, while SMB accounts are more influenced by usage trends. And don’t overlook the importance of reducing friction: 96% of customers who face high-effort interactions become disloyal. Tools like AI agents and visual guidance can make a huge difference in keeping interactions smooth and efficient.
As Sarah Mitchell, Chief Marketing Officer, aptly states:
"The companies that achieve 95%+ gross retention don’t react to churn – they predict it".
FAQs
How can I combine behavioral data with traditional CX metrics to predict churn more effectively?
Combining behavioral data with traditional customer experience (CX) metrics – like CSAT, CES, resolution time, and escalation rates – can paint a clearer picture of churn risk in B2B support. While traditional metrics focus on satisfaction and efficiency, behavioral data, such as sentiment from support tickets or call transcripts, reveals deeper insights into customer engagement and potential dissatisfaction.
AI-powered tools make this process even more effective. They can analyze behavioral trends, such as shifts in sentiment, escalation language, or usage patterns, alongside operational data like renewal timelines or gaps in feature adoption. By merging these pieces of information, support teams can create a unified churn risk score. This score enables teams to proactively address at-risk accounts with personalized retention strategies, improving prediction accuracy and aligning actions with customer needs to help reduce churn.
How does AI improve churn prediction in B2B customer support?
AI is transforming churn prediction in B2B customer support by making sense of complex customer data with speed and precision. It sifts through feedback, support tickets, and usage patterns to spot early signs of churn risk. This means support teams can step in before it’s too late. What used to take hours of manual analysis now happens in minutes, thanks to AI’s ability to automate the process while improving accuracy.
By integrating various data points – like sentiment analysis, escalation language, and customer effort scores (CES) – AI generates a unified risk score. This score helps teams monitor customer health in real-time and prioritize efforts where they’ll have the biggest impact. With its capacity to process massive datasets continuously, AI is reshaping how B2B companies approach churn prevention, making it more efficient and cost-effective.
Why is Customer Effort Score (CES) better than CSAT for predicting customer churn?
Customer Effort Score (CES) zeroes in on something crucial: how much effort a customer has to put in to resolve their issue. Research shows that when customers feel like they’re working too hard to get help, dissatisfaction skyrockets. And here’s the kicker – most of those frustrated customers will eventually take their business elsewhere.
What sets CES apart from Customer Satisfaction (CSAT) surveys is its focus. CSAT often relies on post-interaction surveys, which can be plagued by low response rates or biased feedback. CES, on the other hand, digs deeper, shining a light on the friction points in your support process. By identifying these trouble spots, businesses can take action to smooth out the experience, keeping customers happier and more loyal in the long run.