Building a churn-risk playbook involves identifying early warning signals from customer support interactions and acting on them quickly to prevent churn. Here’s how you can do it:
- Track Key Support Signals:
- Monitor patterns like increased ticket volume, repeated issues, or changes in customer tone.
- Use AI in customer support to analyze sentiment, ticket metadata, and engagement trends.
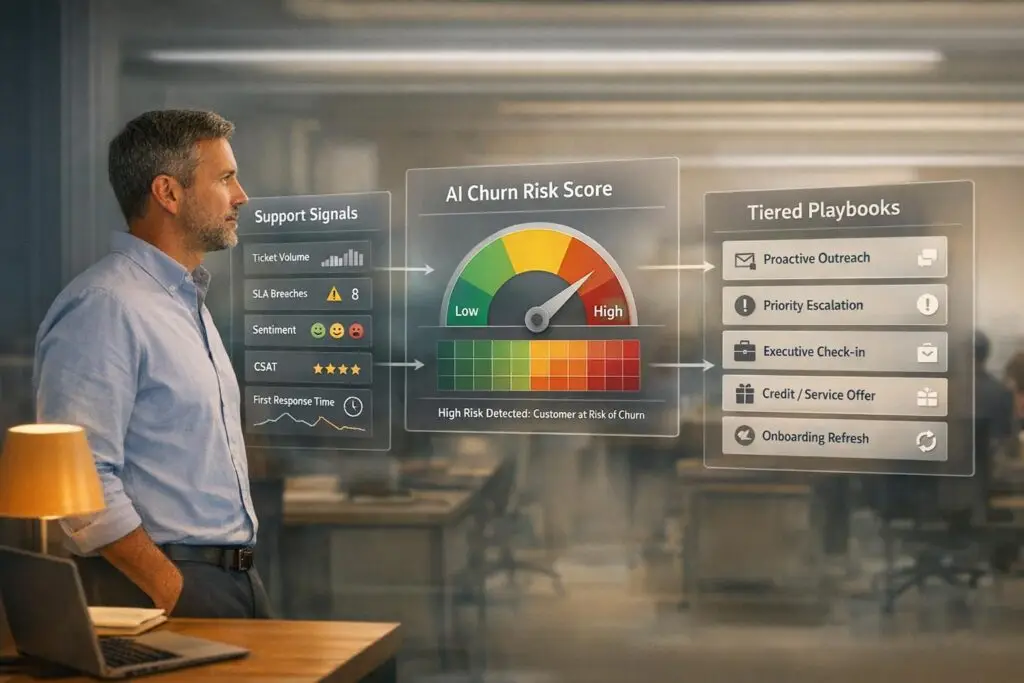
- Automate Alerts and Risk Scoring:
- Set up AI-driven systems to flag high-risk accounts based on signals like negative sentiment or usage drops.
- Create tiered alerts to prioritize actions based on account value and urgency.
- Develop a Tiered Playbook:
- Categorize accounts into risk levels (Watch, At-Risk, Critical).
- Define clear actions for each level, such as proactive outreach, root-cause analysis, or executive involvement.
- Automate Interventions:
- Use AI to trigger playbook actions automatically, like scheduling follow-ups or routing critical issues to specialists.
- Track outcomes like resolution time and customer satisfaction to measure success.
- Measure and Refine:
- Monitor metrics like retention rates, escalation reductions, and alert accuracy.
- Update your playbook regularly based on results and evolving customer behavior.
Key Stats:
- AI can predict churn with 85-92% accuracy.
- Companies using churn-risk playbooks see a 15-30% reduction in churn and faster issue resolution by 28%.
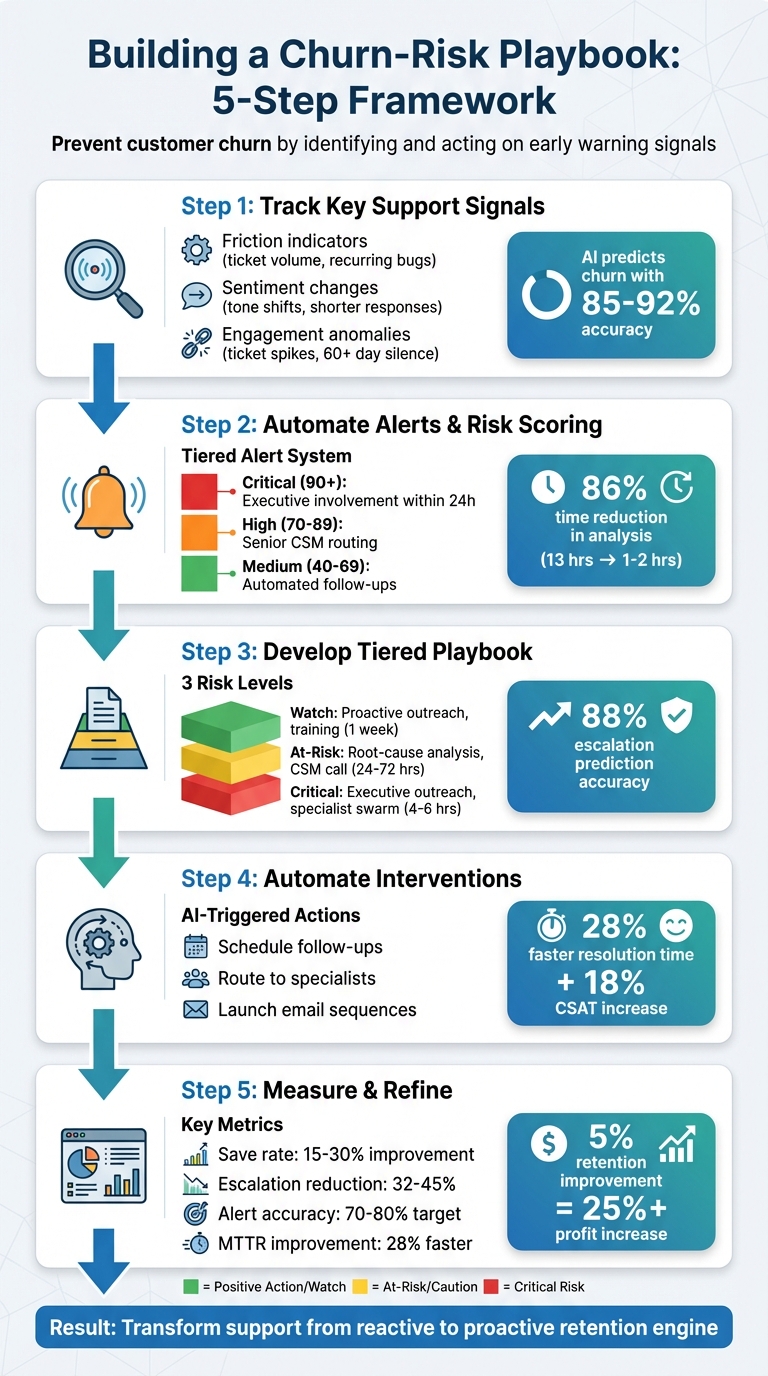
5-Step Churn-Risk Playbook Framework with Support Signals
Leveraging Data to Drive Customer Retention and Predict Churn
sbb-itb-e60d259
Step 1: Choose Which Support Signals to Track
Not all support signals are created equal. Some are much better at predicting customer churn than others. The challenge is figuring out which ones matter most for your business. Start by digging into your own data – look at customers who have left over the past six to twelve months and identify the patterns in their support history. This will help you zero in on the signals that actually matter, making it easier to build an effective monitoring system.
Examples of Support Signals That Indicate Risk
Support-related churn signals generally fall into three buckets: friction indicators, sentiment changes, and engagement anomalies.
- Friction indicators: These include things like increasing ticket volume, unresolved backlogs, recurring bugs, and negative feedback. For instance, if a customer reports the same problem more than three times, it’s a big red flag. It could point to a product issue that needs immediate attention from your product team.
- Sentiment changes: Watch for shifts in tone and language. Customers who start using more formal language, give shorter responses, or show frustration and passive-aggressive phrasing might already be pulling away. These changes often show up weeks before you notice any drop in engagement in your analytics.
- Engagement anomalies: Sudden spikes in tickets can indicate onboarding issues, while no tickets for over 60 days might signal disengagement or silent churn.
"If a signal doesn’t clearly answer who needs to act and why, it’s noise. Start narrow, validate impact, then expand." – Sprinklr
Here’s a quick guide to prioritizing signals based on their risk level and what action they require:
| Support Volume Pattern | Indicated Risk | Required Action |
|---|---|---|
| 3x spike in 7 days | Onboarding failure or major bug | Immediate executive sponsor check-in (within 24h) |
| 50% increase for 30 days | Chronic friction or product issue | Schedule a deep-dive to uncover root causes |
| Zero tickets for 60+ days | Disengagement/Silent churn | Launch a proactive health check campaign |
| Same issue >3 times | Unresolved product gap | Escalate to the product team for a permanent fix |
How AI Improves Signal Detection
AI can spot patterns that might fly under the radar during manual reviews. Tools powered by Natural Language Processing (NLP) are particularly good at analyzing sentiment, frustration markers, and tone shifts. For example, they can detect when a customer’s language becomes more formal or their replies get shorter. With AI-driven sentiment analysis, churn prediction accuracy can reach 85–92%, far outperforming manual reviews.
The time savings are just as impressive. Tasks that used to take 8–12 hours manually can now be done in 30–60 minutes with AI. AI models trained on historical ticket data can predict escalations with 88% accuracy, and businesses using these tools have seen a 45% drop in escalation rates.
AI also excels at clustering topics. If multiple tickets from the same account focus on a specific feature, it may point to an adoption issue. Beyond that, AI keeps an eye on ticket metadata, urgency markers, and even competitor mentions, while tracking sentiment trends over time. One smart move is to prioritize AI-detected signals by ARR (Annual Recurring Revenue). A negative sentiment score from a $500,000 account demands quicker action than the same score from a $5,000 account. By leveraging these insights, you can shift to real-time, automated signal monitoring with ease.
Step 2: Automate Signal Tracking and Alerts
Once you’ve identified the key signals to monitor, automation takes center stage. It transforms raw data into actionable insights, helping your team tackle churn risks before they spiral out of control. By automating signal tracking and setting up alerts, you can shift from reactive responses to a proactive approach that keeps customers engaged and satisfied.
Monitoring Customer Interactions in Real Time
Real-time monitoring is essential for identifying potential risks hidden within customer interactions – whether they come from tickets, emails, or chat messages. To get the full picture, you’ll need to unify data from various sources like product analytics, billing events, CRM records, and support logs. This consolidated view allows AI to connect technical issues with potential business risks.
Modern systems use AI to triage incoming tickets as they arrive, instantly evaluating factors like sentiment, urgency, and account history. These AI tools assign risk scores on the spot, enabling quick prioritization. For example, rather than reacting to one-off incidents, sentiment analysis tools can track a customer’s 30-day sentiment trend, offering a more accurate view of their overall experience. This level of automation can dramatically reduce the time spent analyzing escalations – from as much as 13 hours to just 1–2 hours, cutting the effort by 86%.
Patterns in ticket volume are another key indicator. A sudden spike – say, a 3x increase in tickets within a week – could point to onboarding challenges or a major product issue. Conversely, a lack of support interactions for 60+ days might suggest disengagement. Companies that use AI-driven monitoring have reported a 32% drop in escalation rates and a 28% faster average resolution time.
With these insights in hand, the next step is setting up a tiered alert system to ensure timely action.
Setting Up Alerts for Quick Action
Effective alerts should be tailored to the urgency of the situation and the value of the account. For instance, a negative sentiment score from a high-value customer should prompt an immediate response, while a similar score from a smaller account might require less urgency. To manage this, you can create tiered alert systems. Critical alerts for high-priority accounts can be sent via instant messaging platforms like Slack, requiring action within 24 hours. Medium-risk cases can be routed through email or CRM updates, with a resolution window of up to a week.
Defining clear thresholds for risk levels is crucial. For example:
- Scores of 90+ could be flagged as "Critical", triggering executive involvement.
- Scores between 70–89 might be categorized as "High", routed to senior customer success managers.
- Scores between 40–69 could be labeled "Medium", prompting automated follow-ups.
Dynamic service-level agreements (SLAs) can also adapt based on changing conditions. For example, as a renewal date approaches or if a high-value account faces multiple critical issues, SLAs can tighten to ensure faster responses.
"AI is revolutionizing the operational backbone of support by bringing intelligence and context-awareness to ticket routing and prioritization."
- Nooshin Alibhai, Founder and CEO of Supportbench
Step 3: Create a Tiered Churn-Risk Playbook
Once you’ve set up automated tracking for risk signals (as discussed in Step 2), the next step is building a playbook to guide your response. A tiered structure helps you address risks appropriately based on their severity, avoiding either overreacting or underreacting.
Defining Risk Levels: Watch, At-Risk, and Critical
The first step in creating a playbook is categorizing accounts into risk levels. These categories allow for tailored responses based on specific signals:
- Watch Level: These accounts show early warning signs like fewer logins, gaps in feature usage, or low seat utilization. While they’re not in immediate danger, proactive outreach can help prevent future problems.
- At-Risk Level: Accounts in this category display more serious issues, such as increased ticket volumes, negative feedback in NPS or CSAT surveys, recurring bugs, or SLA breaches. These require a deeper investigation and collaboration between support and customer success teams.
- Critical Level: These accounts are at the highest risk, showing signs like budget freezes, cancellation inquiries, unresolved high-impact issues, or the departure of a key stakeholder. Immediate escalation and executive involvement are necessary.
AI models can streamline this categorization process. Trained on historical data, these systems can identify potential escalations with about 88% accuracy. Companies using AI for risk scoring report a 45% drop in escalations and save 86% of the time compared to manual processes.
Thresholds for risk levels should be adjusted by segment. For instance, an Enterprise account might hit "Critical" status with a sentiment score of –35, while an SMB account might not reach that level until –55. Similarly, developer-focused segments might prioritize usage metrics like API error rates, while enterprise accounts might weigh support sentiment and executive escalations more heavily. For cases where AI predictions lack confidence, routing them to a customer success manager for manual review ensures proper handling.
The next step is to define clear, actionable steps for each risk tier.
Playbook Templates with Clear Action Steps
Every risk level should have predefined actions and timelines to ensure consistent and timely responses:
- Watch Level: Automate engagement by sending best practice guides, inviting customers to webinars, or scheduling health check calls.
- At-Risk Level: Human involvement is crucial. A customer success manager should conduct a root-cause analysis, collaborate with internal teams, and arrange a consultative call within 72 hours.
- Critical Level: Immediate action is non-negotiable. High-risk tickets need to be routed to a customer success manager within 4 to 6 hours, executive outreach should begin, and goodwill credits or urgent fixes might be necessary.
| Risk Level | Key Support Signals | Action Steps | Owner | Timeline |
|---|---|---|---|---|
| Watch | Declining logins, feature adoption gaps, low seat utilization | Send best practice guides, offer training, schedule health check | Marketing / Scaled CS | Within 1 week |
| At-Risk | Rising ticket volume, negative sentiment, SLA breaches, declining health scores | Conduct root-cause analysis, coordinate with support/product teams, schedule consultative call | CSM / Support Lead | Within 24–72 hours |
| Critical | Champion churn, cancellation inquiries, budget freeze, repeated unresolved bugs | Initiate executive outreach, deploy specialist swarms, offer goodwill credits, implement immediate fixes | CS Director / Sales Exec | Within 4–6 hours |
Including pre-written email templates and links to resources in your playbook ensures consistent communication and saves time. After taking action, follow up with a pulse check or an NPS survey to confirm customer satisfaction. Companies that proactively address high-risk tickets have seen an 18% boost in CSAT and a 28% faster resolution time.
Step 4: Use AI to Automate Intervention Workflows
With your tiered playbook in place, the next step is to let AI handle the heavy lifting by automating intervention workflows. Manual processes can lead to delays, but AI-powered automation ensures timely and accurate execution of your strategies.
Triggering Playbook Actions Automatically
AI systems analyze every incoming support ticket and customer interaction in real-time, scoring them to predict customer churn. These tools monitor key signals like sentiment changes, ticket surges, declining usage, and response delays. For instance, a jump in response time from 6 hours to 72 hours could be flagged as a risk. Based on these insights, the AI suggests Next Best Actions (NBA) such as proactive outreach, routing cases to specialists, or offering goodwill gestures.
Smart Risk Routing prioritizes actions by urgency and account value. For example, if a $500,000 ARR account receives a sentiment score below -40, the system might initiate an executive check-in and assign a specialist to address the issue within two hours. Meanwhile, a lower-value account with the same score might receive an automated email sequence instead. This approach ensures resources are allocated where they’ll have the most impact.
| Intervention Type | Trigger Signal | AI-Automated Action |
|---|---|---|
| Proactive Outreach | 3x ticket spike in 7 days | Schedule CSM touchpoint & notify Executive Sponsor |
| Playbook Routing | Negative sentiment + High ARR | Assign specialist "swarm" & suggest resolution templates |
| Enablement Sprint | Feature adoption drop > 60% | Launch automated checklist & email sequence |
| Commercial Save | Payment failure + Usage decay | Notify billing and CS; offer tiered discount or plan adjustment |
For predictions with high confidence, actions can be fully automated or assigned directly to customer success managers. When confidence is lower, the system can flag cases for manual review to ensure a personalized and accurate response. This seamless automation extends the earlier signal tracking, ensuring risks are addressed swiftly and effectively.
Monitoring Recovery Results
Once interventions are set in motion, it’s crucial to track their outcomes. AI dashboards monitor key metrics like Mean Time to Resolution (MTTR), save rates, and post-intervention health scores. One critical metric is "usage rebound" – whether customers return to regular engagement levels after an intervention. These systems also track sentiment trends over 30 days, helping teams identify and address deteriorating relationships before they escalate.
To refine your approach, label each intervention (e.g., "goodwill credit", "expert routing", "callback") and analyze which actions are most effective in preventing churn. Regularly update AI models with resolution outcomes to improve prediction accuracy. Some teams even maintain "holdout queues" – a group of customers who don’t receive AI-driven interventions – to measure the direct impact and ROI of automated playbooks.
Proactive AI interventions have been shown to increase CSAT for high-risk tickets by 18% and cut resolution times by 28%.
"By preventing surprises and accelerating resolutions, teams commonly preserve CSAT for at-risk accounts and protect renewal revenue tied to escalations." – The Pedowitz Group
Step 5: Track Results and Improve Your Playbook
Metrics That Show Playbook Performance
To gauge how well your playbook is working, focus on retention and revenue metrics like Gross Retention Rate (GRR) and Net Retention Rate (NRR). Teams using effective churn-risk playbooks often achieve a 15–30% boost in save rates. On the support side, tracking escalation rate reduction is key – optimized playbooks can cut escalations by 32–45%. Another critical metric is alert accuracy, which measures how many flagged accounts genuinely need intervention. Top-performing teams aim for 70–80% actionability, reducing unnecessary workload for CSMs.
For customer satisfaction, monitor CSAT scores for high-risk customer groups. These scores reveal whether your interventions are preserving relationships. Additionally, track usage rebound to see if customers return to their usual engagement levels after an intervention, confirming long-term recovery. Finally, calculate your cost-to-save ratio by comparing intervention costs against retained ARR. Tagging actions in your CRM helps directly link interventions to outcomes.
| Metric Category | Key Performance Indicator | Target Impact Example |
|---|---|---|
| Retention | Save Rate / Retention Uplift | 15–30% increase |
| Support | Escalation Rate Reduction | 32–45% reduction |
| Customer Health | CSAT for High-Risk Tickets | Positive trend in satisfaction |
| Accuracy | Alert Accuracy | 70–80% actionability |
| Resolution | Mean Time to Resolution (MTTR) | 28% faster |
"Companies that improve retention by just 5% can see over a 25% increase in profit." – Bain & Company
These metrics create a solid framework for improving and fine-tuning your playbook.
Reviewing Results to Optimize Templates
Once you’ve established your metrics, use them to refine your playbook continuously. Quarterly reviews help ensure your strategies stay aligned with changing customer behaviors. Dive into the data to identify which intervention steps are effective and which ones fall flat. If certain actions consistently fail to re-engage customers, tweak or remove them altogether. Tools like A/B testing and monthly updates to AI models can further enhance your playbook by adapting to new customer trends.
AI plays a crucial role in spotting patterns that might otherwise go unnoticed. Conduct post-churn analyses to uncover signals your current playbook may be missing, then incorporate those insights into future iterations. To measure the true impact of your playbook, maintain holdout groups – accounts that don’t receive AI-driven interventions. This allows you to evaluate the causal effects of your strategies. By consistently measuring and adjusting, you’ll ensure your playbook evolves alongside customer needs, keeping it effective in preventing churn over time.
Conclusion: Building a Churn Prevention System with Support Signals
Creating an effective churn-risk playbook means spotting early warning signs and stepping in before customers decide to leave. By focusing on the right support signals, automating risk detection, designing tiered playbooks, and using AI to prompt timely actions, your support team can shift from simply solving problems to actively preventing churn. When support and customer success teams work together, every ticket becomes a health indicator, not just a task to close. This approach transforms your support team into a proactive force for retention.
AI plays a key role in making this system both efficient and scalable. Tasks like manual ticket scanning, which often take 10–22 hours, are reduced to just 1–3 hours with AI – saving up to 86% of the time. AI also combines data from multiple sources, such as product analytics, support tickets, billing systems, and emails, to uncover actionable insights that might otherwise go unnoticed. It identifies "silent drift", the subtle yet gradual decline in usage that signals high churn risk but doesn’t set off immediate alarms. AI even provides Next Best Action recommendations, giving Customer Success Managers (CSMs) clear guidance on how to respond.
"The silent drift is what kills you. A customer goes from 50 logins a month to 40… Nothing triggers an alarm because there’s no single catastrophic moment. But over eight weeks, that’s a 60% drop in usage, a massive red flag you never saw coming." – Datagrid Team
The financial and operational benefits of such a system are hard to ignore. Research shows that improving retention by just 5% can boost profits by more than 25%. Teams using AI-driven playbooks have reported a 45% drop in support escalations, a 28% faster Mean Time to Resolution, and an 18% increase in CSAT for high-risk tickets. Companies like Comcast Business and Broadridge have successfully implemented AI systems that flag at-risk accounts 45 days before renewal, allowing them to execute targeted playbooks that improve both Gross Retention Rate and Net Retention Rate.
To keep this system effective, it’s crucial to monitor the accuracy of your alerts, aiming for a 70–80% actionability rate to prevent CSMs from becoming overwhelmed. Regularly updating AI models and using holdout groups to measure the impact of your strategies ensures continuous improvement. By treating support signals as predictive tools rather than reactive tasks, you build a system that not only protects revenue but also deepens customer trust and loyalty over time.
FAQs
What key support signals should I monitor to prevent customer churn?
To predict and prevent customer churn effectively, pay close attention to key support signals that may reveal dissatisfaction or disengagement. Start with behavioral signals – things like a drop in product usage, accounts sitting idle, or customers abandoning essential features. These patterns often hint at waning interest or involvement.
Next, watch for support friction signals, such as unresolved tickets, repeated escalations, or negative feedback from CSAT or NPS surveys. These issues can signal mounting frustration. Lastly, keep an eye on commercial stress signals like overdue payments, account downgrades, or questions about cancellation policies. These could indicate financial struggles or dissatisfaction with the terms of the service.
By combining these data points with qualitative feedback – like negative sentiment in support tickets or call transcripts – you can spot at-risk customers early. This holistic approach allows support teams to step in, address concerns, and improve the overall customer experience.
How can AI improve the effectiveness of churn-risk playbooks?
AI takes churn-risk playbooks to the next level by analyzing customer behavior and automating workflows with unmatched speed and precision. By pulling together data from sources like support tickets, product usage analytics, and billing systems, it can spot early warning signs of churn – think drops in product engagement, unresolved issues, or shifts in customer sentiment. The result? Teams can identify potential risks weeks or even months before they become serious problems.
What’s more, AI simplifies the process by assigning scores to customers based on predictive signals and triggering timely, proactive responses. This allows support teams to zero in on high-risk accounts and roll out personalized strategies to retain those customers. By automating both data crunching and intervention planning, AI makes churn-risk playbooks more accurate, scalable, and efficient, giving businesses a powerful edge in keeping their customers loyal.
What are the advantages of automating workflows to prevent customer churn?
Automating workflows to prevent churn offers clear benefits for improving efficiency and keeping customers engaged. By constantly monitoring support indicators – such as shifts in sentiment, unresolved issues, or patterns of escalations – automation flags accounts that might be at risk. This gives teams an early opportunity to step in and address concerns before customers decide to leave.
On top of that, automated workflows ensure quick and consistent responses by initiating predefined actions whenever specific churn signals arise. This not only cuts down on manual effort but also speeds up how quickly teams can act, making it easier to manage larger customer bases effectively. With these streamlined processes, businesses can reduce churn, boost customer satisfaction, and drive up overall customer lifetime value.