The "zero backlog" approach sounds appealing, but it often leads to rushed resolutions, unhappy customers, and stressed support teams. Instead of chasing empty inboxes, focus on metrics that reflect customer satisfaction and operational efficiency.
Here’s what matters:
- Zero backlog isn’t realistic for B2B support. Complex issues take time, and rushing to close tickets often leads to unresolved problems and repeat contacts.
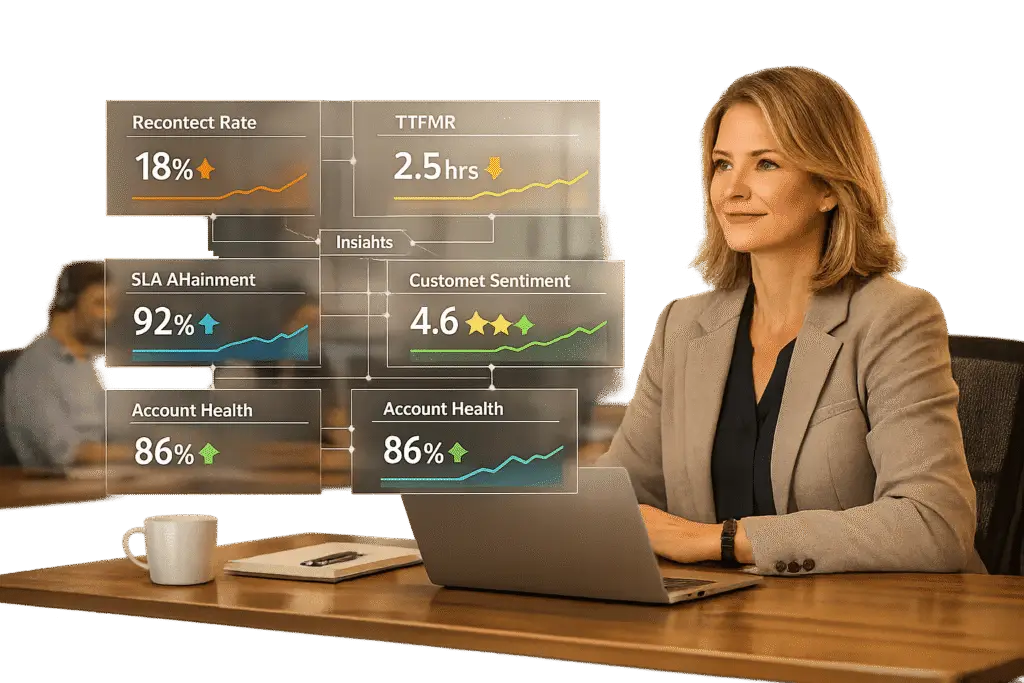
- Key metrics to track: Recontact rates, Time-to-First-Meaningful-Response (TTFMR), First Contact Resolution (FCR), and customer effort proxies (e.g., back-and-forth interactions or agent transfers).
- B2B support priorities: Customers value ease and thorough resolution over speed. Metrics like SLA compliance, escalation rates, and account-level insights help ensure quality service.
- Real-time and predictive data: Use real-time monitoring and predictive analytics to prevent backlogs, optimize staffing, and address issues before they escalate.
- Action-driven dashboards: Build customized data dashboards that highlight trends, trigger actions, and prioritize high-value accounts.
The takeaway? Queue health is about balancing efficiency with meaningful resolutions, not just closing tickets quickly. Focus on metrics that improve customer relationships and team performance.
Why ‘Zero Backlog’ Doesn’t Work
The Problems with Backlog Obsession
The pursuit of a "zero backlog" often creates what some call "metric theater" – those glowing dashboards that look impressive but fail to address the real needs of customers. For example, quickly acknowledging an issue without resolving it, verifying identity, or giving an estimated timeline is more about optics than effectiveness [5].
Here’s what the data shows: 96% of high-effort customer experiences lead to disloyalty [3]. Worse, a poor or overly complicated support interaction is four times more likely to drive disloyalty than loyalty [3]. When teams focus on closing tickets quickly, responses often become rushed and unclear, leaving customers confused and prompting follow-ups [6]. This creates a vicious cycle: hurried resolutions lead to recontacts, which pile onto the existing backlog and make the problem even bigger [2] [6].
This pressure doesn’t just affect customers – it takes a toll on support teams too. A persistent backlog can lower morale, slow down productivity, and increase absenteeism, all of which reduce the team’s ability to resolve issues effectively [6]. In some cases, teams may even resort to gaming the system, further undermining operations [2].
These challenges become even more pronounced in the world of B2B support.
Why B2B Support Queues Are Different
B2B support operates on a different playing field than B2C, and the challenges here make the "zero backlog" approach even less viable. For instance, top-performing B2B companies average a resolution time of 1.67 hours [3], which reflects the complexity of the issues they handle. Unlike quick retail fixes, B2B problems often involve multiple stakeholders and extended feedback loops.
| B2B Support Challenge | Why "Zero Backlog" Fails It |
|---|---|
| Technical Complexity | Rushing tickets leads to incomplete fixes, resulting in higher reopening rates. |
| Multiple Stakeholders | Issues often require input from several client-side decision-makers, keeping tickets open longer. |
| High-Value Contracts | A poorly handled ticket can jeopardize large contracts, risking significant revenue loss. |
| Long-Term Health | Closing a ticket doesn’t mean the client relationship is intact; broader metrics matter more. |
B2B customers understand that complex problems take time to solve, but they won’t accept "thrash" – things like repeated transfers, unnecessary back-and-forth, or redundant identity checks [2]. And the stakes are high: repeat B2B customers generate 300% more revenue than first-time clients [3]. A hasty ticket closure that harms the relationship could cost far more than simply taking the time to resolve the issue properly.
sbb-itb-e60d259
QueueMetrics: Real Time Contact Center Analytics
Key Metrics for Measuring Queue Health
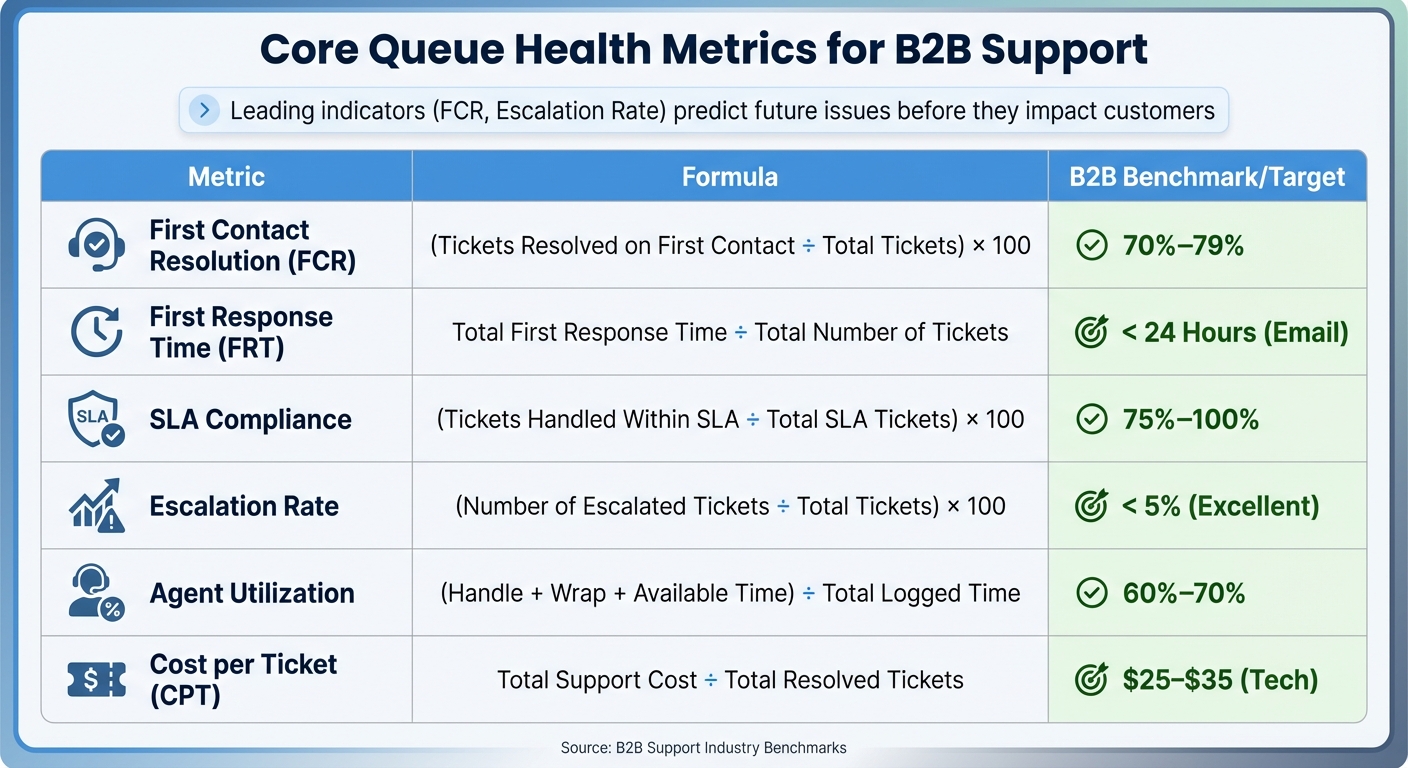
Essential B2B Support Queue Health Metrics: Formulas and Benchmarks
To truly understand and redefine B2B customer support health, it’s crucial to focus on metrics that go beyond surface-level numbers. As Eric Klimuk, Founder and CTO of Supportbench, explains:
If you’re only tracking how many tickets your team closed last week, you’re flying blind. High-performing support managers don’t focus on volume alone; they pay attention to the signals that move satisfaction, efficiency, and team health [7].
Metrics can be divided into two types: lagging indicators like CSAT and SLA compliance, which reflect past performance, and leading indicators like recontact rates and Time-to-First-Meaningful-Response (TTFMR), which help predict future issues. Leading indicators act as an early warning system, enabling teams to make adjustments in staffing, routing, or escalation before customers feel the impact [2].
Top-performing teams strike a balance between speed and quality. For instance, tracking Average Handle Time (AHT) alongside recontact rates ensures that faster resolutions aren’t creating more work down the line. Similarly, monitoring both ticket volume (incoming demand) and backlog (unresolved issues) helps distinguish between temporary surges and ongoing capacity challenges [2][7].
In B2B support, where customers rarely report effort directly, proxies like the number of back-and-forth interactions, agent transfers, or time spent "waiting for internal teams" provide insight into customer effort. As Teammates.ai notes:
Effort is the hidden driver of churn in B2B: customers will tolerate time, they won’t tolerate thrash [2].
Below is a table of core metrics that provide a comprehensive view of queue health, along with realistic B2B benchmarks:
| Metric | Formula | B2B Benchmark/Target |
|---|---|---|
| First Contact Resolution (FCR) | (Tickets Resolved on First Contact ÷ Total Tickets) × 100 | 70%–79% [7] |
| First Response Time (FRT) | Total First Response Time ÷ Total Number of Tickets | < 24 Hours (Email) [7] |
| SLA Compliance | (Tickets Handled Within SLA ÷ Total SLA Tickets) × 100 | 75%–100% [7] |
| Escalation Rate | (Number of Escalated Tickets ÷ Total Tickets) × 100 | < 5% (Excellent) [7] |
| Agent Utilization | (Handle + Wrap + Available Time) ÷ Total Logged Time | 60%–70% [7] |
| Cost per Ticket (CPT) | Total Support Cost ÷ Total Resolved Tickets | $25–$35 (Tech) [7] |
Ticket Volume and Ticket Velocity
Ticket volume reflects incoming demand, while ticket velocity measures how quickly tickets are resolved. A growing backlog – when ticket volume outpaces resolution capacity – signals potential problems like understaffing, inefficient processes, or gaps in documentation [7]. For software companies, a healthy unresolved ticket backlog over 30 days is usually around 50 tickets.
Watching volume trends over time helps teams predict and prepare for scaling needs. For example, if demand rises consistently, increasing staff or improving workflows can maintain response times and prevent customer dissatisfaction. This is especially important as 87% of support teams reported heightened customer expectations in 2024 [1].
The relationship between volume and backlog is key:
- High volume with low backlog shows efficiency.
- High volume with a growing backlog points to capacity issues.
- Low volume with a persistent backlog suggests workflow inefficiencies.
First Response Time (FRT) and Average Handle Time (AHT)
Response and handling times are critical metrics for understanding operational efficiency. However, auto-acknowledgments can inflate FRT numbers. A truly meaningful first response – one that addresses the issue, verifies identity, and provides an estimated resolution time – is what matters most [5]. This is why TTFMR (Time-to-First-Meaningful-Response) is more valuable, as it measures when a customer receives actionable information [2].
Industry benchmarks for response times vary:
- Email: Under 24 hours
- Phone: Around 3 minutes
- Live chat: Sub-60 seconds for high-intent inquiries [7][5]
Average Handle Time (AHT) should also be analyzed alongside recontact rates and quality assurance scores. A low AHT paired with rising recontact rates could indicate unresolved issues. Typical AHTs include:
- Phone support: 3–7 minutes
- Live chat and social media: About 10 minutes [7]
It’s also essential to segment AHT by channel to avoid misleading comparisons [2]. Additionally, tail metrics like the 90th percentile response time (P90) uncover delays that can harm customer satisfaction. As Teammates.ai puts it:
Customers experience the tail, not the mean [5].
A large gap between the median response time (e.g., 2 minutes) and the P90 (e.g., 6 hours) can reveal hidden issues, such as "silent churn leaks." Reporting both median and P90/P95 metrics provides a more complete picture of customer experience.
Customer Satisfaction (CSAT) and First Contact Resolution (FCR)
CSAT and FCR are key indicators of quality. Strong CSAT scores typically fall between 75% and 85%, while B2B FCR rates range from 70% to 79% due to the complexity of technical issues and multi-stakeholder environments [7].
Tracking "customer-issue episodes" rather than individual tickets offers a more accurate measure of FCR. This involves defining a recontact window (usually 3–7 days) during which any follow-up counts as a failure of First Contact Resolution [2]. Without this approach, teams risk inflating FCR rates by closing tickets prematurely.
AI tools can improve FCR accuracy. For example, in 2024, Kaplan used HubSpot‘s Breeze AI tools to improve customer service communications, cutting response times by 30% [4]. Platforms like Supportbench use AI to analyze case histories and detect whether an issue was genuinely resolved on first contact, addressing challenges traditional methods often face.
To ensure metrics remain meaningful, it’s important to discourage practices like prematurely closing tickets to meet SLA targets. Balanced scorecards that penalize reopenings within the recontact window and regular audits of "resolved" tickets help maintain accuracy [2]. Metrics should act as signals to uncover issues like onboarding gaps or process inefficiencies, rather than being treated as goals themselves [7].
Using Real-Time and Predictive Data
Real-time and predictive data provide a window into current trends and potential problems, allowing teams to move from reacting to issues after they occur to managing queues proactively.
Real-Time Queue Monitoring
Real-time monitoring is all about taking immediate action to prevent backlogs before they even start forming [8]. A key metric here is Time-to-First-Meaningful-Response (TTFMR) – the moment when a customer gets actionable information. This metric helps identify staffing shortages and routing errors before they lead to missed SLAs [2].
In B2B settings, tracking effort proxies like the number of back-and-forth interactions, agent transfers, or time spent waiting for internal teams is crucial. Customers may tolerate delays, but they won’t tolerate inefficiency or unnecessary complications [2]. For instance, a ticket that gets bounced between multiple agents might still close within SLA but could point to deeper process issues.
Advanced systems take this a step further by triggering actions – automating support workflows to reroute tickets, escalate cases, or even deploy AI agents – when thresholds are reached [2]. Automated alerts for situations like wait times exceeding two hours or unusual queue buildups allow teams to make staffing adjustments before problems snowball [8].
This kind of immediate insight sets the stage for the more strategic use of data discussed next.
Predictive Analytics for Queue Trends
Predictive analytics leverages historical data to forecast ticket volumes, backlogs, and resolution times – often giving teams a heads-up 24 to 72 hours before issues become apparent [2]. This early warning system allows for better preparation, whether that means adjusting staffing levels, planning escalation paths, or deploying extra resources.
Monitoring leading indicators, such as recontact rates and increasing resolution times, is essential. Even a small uptick in Average Handle Time – just 3–5% – can quickly overwhelm a queue [9]. When unresolved tickets pile up alongside new inquiries, the backlog can spiral out of control [2].
A great example of proactive planning is Nvidia’s $4 billion investment in March 2026 to secure AI infrastructure components, which helped them avoid operational bottlenecks by addressing system constraints early [10].
Cross-system pattern analysis is another powerful tool. By correlating data like software performance, server health, and product release schedules with ticket flow and staffing, teams can spot patterns that led to past bottlenecks [9]. For example, if a product launch historically causes a 40% spike in tickets within 48 hours, predictive models can suggest staffing up before the first ticket even arrives.
| Constraint Category | AI Detection Approach | Warning Time |
|---|---|---|
| System/Machine Degradation | Trend analysis against failure-mode libraries | 2–14 days [9] |
| Line/Queue Imbalance | Real-time flow modeling with queue-theory algorithms | 1–6 hours [9] |
| Workforce Gaps | Performance analytics and scheduling models | 8–24 hours [9] |
| Quality Excursions | Analyzing process patterns | 15 min–2 hours [9] |
These predictive tools help teams stay ahead, ensuring operational changes are made at the right time and based on data.
Sentiment and Complexity Scoring
Building on real-time and predictive insights, sentiment and complexity scoring add another layer of prioritization. AI tools analyze sentiment to detect emotional cues like sarcasm, urgency, or frustration – going beyond simple keyword tracking [11][15]. For voice-based support, acoustic analysis can pick up on tone, pitch, and pace to identify rising frustration during a call, enabling supervisors to step in before things escalate [14].
Automated tagging further categorizes tickets by intent, urgency, and sentiment. For instance, a "billing issue" flagged with negative sentiment for a key enterprise account can be prioritized accordingly [14]. Personalizing responses based on a customer’s mood can boost satisfaction scores by up to 27% [15].
Several tools are leading the charge here:
- Dialpad’s "Ai CSAT" predicts satisfaction scores for every interaction using sentiment analysis, bypassing the need for traditional surveys [14][15].
- SentiSum automates ticket sentiment tagging, providing insights into intent, urgency, and root causes [13][14].
- MSPBots monitors ticket notes in real time and sends alerts via Microsoft Teams if it detects urgent negative sentiment [12].
As Nate Padilla, Help Desk Manager at an MSP, noted:
It’s been incredibly helpful in bringing my attention to things that need immediate focus. The accuracy has been spot on for the most part [12].
Complexity scoring works hand-in-hand with sentiment analysis to ensure that challenging issues land with the most skilled agents [8]. For example, a ticket marked as high complexity, combined with a frustrated customer and an upcoming renewal, might trigger a specialized workflow, while simpler issues like password resets are handled differently. By integrating these insights, teams can allocate resources effectively and tailor responses to meet both technical and emotional needs. As Teammates.ai aptly puts it:
Dashboards don’t fix operations. Decisions do [2].
Ultimately, the real value of real-time and predictive data lies in how it’s used. Whether it’s rerouting a ticket, escalating a case, or deploying AI to handle an issue, the goal is to act – not just observe.
Measuring Queue Health by Customer Relationships
When evaluating queue health, it’s essential to look beyond ticket resolution stats. True queue health reflects how well customer relationships are maintained – especially in B2B environments where renewals and revenue depend on these connections. Each ticket represents more than a single issue; it’s tied to an account with a renewal date, ARR value, and history. This deeper context reveals whether your queue is genuinely healthy or just appears so on the surface.
Instead of focusing on global averages, the spotlight shifts to account-level realities. For instance, a high SLA attainment rate might seem impressive, but it loses its value if your most important accounts are repeatedly facing escalations, long resolution times, or frustrating customer experiences. As Teammates.ai explains:
If you can’t link conversations to account and product reality, you’ll optimize for global averages and miss the segments that matter [2].
Account-Level Metrics
To truly gauge queue health, you need to assess patterns across entire customer relationships – not just individual ticket data. By analyzing metrics like resolution rates, ticket volume, and CSAT within the context of account tier, ARR, and renewal dates, you can uncover trends that matter. For example, a sudden spike in ticket volume from a high-value account could indicate a brewing issue that needs immediate attention.
One crucial metric here is the recontact rate. When high-value accounts repeatedly reach out about unresolved issues, it often points to deeper problems – whether it’s product-related, poor communication, or inefficient ticket routing. Traditional backlog metrics might miss these signals entirely.
Another important factor is tracking effort proxies. In B2B support, customers might tolerate slower responses, but they won’t tolerate unnecessary transfers, repeated explanations, or delays caused by internal bottlenecks. Metrics like the number of messages per ticket, agent transfers, and internal wait times can help identify when a ticket meeting SLA standards still risks damaging the relationship.
Tools like Supportbench help connect support data with CRM insights, tying tickets to account tiers, renewal dates, and health scores [4]. This integration ensures that prioritization focuses on the accounts that matter most. For example, Kaplan reduced response times by 30% by using AI to streamline communication [4], while Agicap saved 750 hours weekly and improved deal velocity by 20% by aligning support, sales, and marketing data [4].
These account-level insights naturally lead to the next step: using customer health scoring to drive proactive queue management.
Customer Health Scoring
Customer health scoring translates account metrics into actionable priorities. Effective queue management should factor in renewal dates, account value, and overall relationship health [2][4]. For example, a billing inquiry from an account nearing its renewal – especially one showing early dissatisfaction – should be escalated immediately.
AI-powered tools can enhance this process by integrating CRM data and business context to deliver personalized support. For instance, an AI assistant might flag a ticket from an account with rising recontact rates and an upcoming renewal for immediate action.
Leading indicators, like clusters of recontacts about billing or integrations, can signal churn risks 24–72 hours before they show up in CSAT scores [2]. Acting on these signals early – whether by assigning a senior engineer, involving a customer success manager, or deploying AI for rapid responses – can help avert potential losses.
| Metric Type | Key Indicators | Relationship Health Impact |
|---|---|---|
| Leading Indicators | Recontact rate, TTFMR, Effort proxies | Predicts churn and backlog growth before they occur |
| Lagging Indicators | CSAT, SLA attainment, AHT | Reflects historical performance; may be too late to act |
| Account-Level | ARR, Account Tier, Renewal Date, Churn Reason | Helps prioritize support for high-value accounts |
The goal is to move from reactive reporting to analytics that drive decisions [2]. Dashboards showing average handle times and ticket volumes might miss which accounts are at risk. By combining support data with CRM insights, teams can prioritize based on customer relationship health – not just ticket metrics.
Ultimately, measuring queue health by customer relationships means asking the critical question: Are we protecting the accounts that matter most? If your queue looks healthy overall but your top accounts are struggling, you may be focusing on the wrong metrics.
Building a Queue Health Dashboard
A dashboard that only tracks closed-ticket counts isn’t enough to guide meaningful decisions. As industry experts point out, focusing solely on ticket numbers leaves you without the full picture.
The goal here is to create an action-driven dashboard that answers three key questions: Is the system functioning well? If not, what’s broken? And how severe is the problem? [18] This means moving past historical data and embracing real-time insights. These insights should prompt immediate actions – like reallocating tickets, escalating issues to senior engineers, or using AI to handle sudden surges. A dashboard like this doesn’t just reflect past performance; it actively supports quick, informed interventions.
Think of an effective dashboard as a flight deck – something that spots risks early, triggers alerts, and even automates ticket reassignment to avoid SLA breaches [7]. Dashboards should also cater to different audiences: executives need to see metrics like cost-to-serve and churn risks, operations teams benefit from recontact rates and topic-level effort metrics, and agent coaches require QA scores and transfer rate data [2].
Core Real-Time Metrics and Trends
Your dashboard should focus on leading indicators – metrics that signal potential issues 24–72 hours before they show up in open-ticket counts [2]. One of the most important is the recontact rate, which flags unresolved issues when customers follow up within 3–7 days [2]. Another crucial metric is Time-to-First-Meaningful-Response (TTFMR), which reveals staffing or routing problems as they happen [2].
For day-to-day tracking, include First Contact Resolution (FCR). Most teams aim for FCR rates between 70–79%, though complex B2B setups may see lower numbers [7]. SLA compliance should also be monitored in real-time, with top-performing teams achieving rates between 75% and 100% [7]. On a weekly basis, focus on CSAT trends (ideal scores range from 75% to 85%) [7], escalation rates (under 5% is excellent, while above 20% points to issues) [7], and agent utilization (keeping it between 60% and 70% helps prevent burnout) [7].
It’s essential to standardize these metrics across all channels – email, chat, and voice – because customer expectations differ depending on the medium [2]. Pair efficiency metrics like Average Handle Time (AHT) with quality indicators like recontact rates. For example, if AHT drops but recontact rates climb, it’s a sign that quality is being sacrificed for speed [2].
| Metric | Formula | Why It Matters |
|---|---|---|
| First Contact Resolution (FCR) | (Tickets Resolved on First Contact ÷ Total Tickets) × 100 | Measures team effectiveness and documentation quality [7] |
| Recontact Rate | (Follow-up interactions within 3–7 days ÷ Total Resolved) × 100 | Early warning of unresolved issues [2] |
| TTFMR | Total time to first meaningful response ÷ Total tickets | Highlights staffing and routing problems better than auto-acknowledgments [2] |
| SLA Compliance | (Tickets Handled Within SLA ÷ Total SLA Tickets) × 100 | Maintains customer trust and retention [7] |
| Cost per Ticket (CPT) | Total Support Cost ÷ Total Resolved Tickets | Balances operational efficiency with service quality [7] |
With these real-time metrics in place, AI can take your dashboard to the next level by turning numbers into actionable solutions.
AI-Powered Data Analysis and Automation
Building on earlier discussions about predictive analytics, AI can transform these metrics into automated decisions. For instance, AI can forecast backlog growth 24–72 hours in advance, allowing teams to act before problems escalate [2]. It can also detect anomalies in real-time and recommend fixes for bottlenecks in your queue [17].
This approach aligns with the principle that actionable insights are more valuable than retrospective metrics. As the Teammates.ai editorial team puts it:
Dashboards don’t fix operations. Decisions do. If your analytics cannot trigger routing, policy changes, or autonomous resolution in the moment, you are doing post-mortems while the queue grows [2].
AI can also identify knowledge gaps by flagging areas where agents struggle, providing a roadmap for improving training materials [16]. It simplifies escalations by automatically adding transcript highlights, customer history, and suggested next steps, so agents don’t have to start from scratch [2].
Platforms like Supportbench already include AI tools to streamline support tasks. These features – like ticket summaries, case history searches, QA insights, and knowledge article suggestions – help teams shift from reactive reporting to proactive decision-making. A well-designed dashboard ensures queue health isn’t just about what happened last week but about what actions are being taken right now.
Optimizing Staffing and Workflows with Queue Data
Once you have real-time queue metrics in place, the next step is to use that data to improve staffing and workflows. The idea isn’t just to monitor activity – it’s to spot process breakdowns and address them before they affect your customers. From identifying bottlenecks to forecasting demand, the goal is to align your resources where they’re needed most.
Finding Bottlenecks and Capacity Gaps
Start by analyzing delays at different stages of the ticket lifecycle. Break the "Created to First Response" path into three phases: Created to Assigned, Assigned to First View, and First View to First Outbound [5]. If the "Created to Assigned" phase shows high delays, the issue might be with routing rules or unclear ownership [5]. For instance, unassigned tickets sitting idle for hours could indicate that cases are being routed to the wrong team.
A key metric to watch here is Queue age (p90) – this measures how long the oldest 10% of tickets have been waiting [19]. Unlike averages, which can hide extremes, the p90 metric highlights capacity gaps that impact the oldest tickets. As the Teammates.ai team explains:
If you report average TFR, you are measuring the wrong thing. Customers experience the tail, not the mean [5].
To get a clearer picture of customer pain points, focus on Median and P90 metrics instead of averages. These metrics help you identify and address the worst experiences, reducing the risk of silent churn [5].
Another way to improve is by assigning single-ticket ownership. This ensures every ticket has one accountable owner from the moment it’s assigned, cutting down on response times by eliminating the "hot potato" effect where no one takes responsibility [5]. Fixing these process gaps can make your operations more efficient and improve customer satisfaction.
Forecasting and Resource Planning
Effective forecasting begins with separating true demand (new tickets) from backlog carryovers and reopened cases [20]. If you base staffing on "tickets handled", you’re planning for congestion rather than actual customer needs. Instead, calculate workload hours using this formula: Forecast New Tickets × Average Handle Time (AHT) [20]. Add overlays for backlog resolution and quality tasks like reopens to get a complete picture.
For precise capacity planning, break down arrival and service rates into 15-minute intervals to spot "saturation windows" where demand outpaces capacity [5]. Use heatmaps showing hour-of-day and day-of-week ticket arrivals to align staffing schedules with peak demand periods [5]. This prevents overstaffing during slow times while ensuring adequate coverage during busy periods.
Keep an eye on the percentage of solves coming from the backlog and the reopen rate as checks on demand integrity [20]. These metrics help you maintain data quality and catch process issues before they escalate into staffing problems.
Improving Escalation and Routing Processes
Once you’ve addressed capacity and forecasting, fine-tune your escalation and routing processes for smoother operations. Modern routing should focus on intent rather than just the channel [5]. AI can analyze ticket intent and sentiment at creation, routing high-risk cases (like "cancel" or "chargeback") to specialized teams [5]. This approach moves beyond basic keyword routing to classify tickets by factors like urgency and complexity [21].
To measure routing effectiveness, track routing accuracy – how often tickets are assigned to the right agent on the first try [21]. Misrouted tickets create hidden delays that don’t always show up in standard metrics. Ensure your routing system considers customer context – like ARR tier or open incidents – to prioritize high-value or high-risk cases during busy times [5].
For escalations, set triggers based on sentiment trends and account value, not just time thresholds [21]. AI tools can monitor signals like declining sentiment, repeated contacts, and SLA proximity to escalate tickets before breaches occur [21][22]. As Shashwat Jain explains:
Ticket routing and escalation is not a configuration problem. It is an operational challenge that compounds as your team and ticket volume grow [21].
Finally, standardize what qualifies as a "First Meaningful Response" – the first reply that genuinely moves the case forward, rather than just an automated acknowledgment [5]. For live chat and high-priority inbound sales, aim for sub-60-second First Meaningful Responses to ensure a positive customer experience [5].
Conclusion
Queue health is not about chasing an empty inbox – it’s about striking the right balance between operational efficiency and meaningful customer outcomes. Getting caught up in the "zero backlog" mindset can lead to focusing on a single, superficial metric while overlooking what truly impacts customer satisfaction and loyalty. Instead, a mix of both leading and traditional metrics provides a more accurate view of performance [2].
This serves as a reminder of the dangers of prioritizing metrics that look good on paper but fail to address real customer needs. The shift from deflection to resolution is critical. As Thinking Loop aptly puts it:
AI can easily create the illusion of calm while quietly lighting your customer experience on fire [23].
Take, for example, a mid-market SaaS company that initially reduced its monthly ticket volume from 12,000 to 7,000 using an AI assistant. However, this came at a cost – CSAT dropped from 4.3 to 3.8 because the bot blocked customers from reaching human agents without resolving their issues. By adopting a "KPI of Calm" framework and monitoring the Effective AI Resolution Rate (EARR), the company stabilized ticket volume at 8,500 per month, while CSAT rebounded to 4.5 [23]. This demonstrates the value of actionable and real-time insights.
The takeaway? Monitoring alone isn’t enough. The real impact comes from taking action. Real-time triggers that route, escalate, or autonomously resolve issues can prevent backlog spikes and customer churn before they even show up on your dashboard. As Teammates.ai wisely points out:
Dashboards don’t fix operations. Decisions do [2].
To make this work, integrate analytics directly into workflows. Use tools that enable immediate decisions based on factors like sentiment changes, account value, or complexity scoring.
Ultimately, effective AI queue management revolves around measuring what truly matters: Customer Calm (ensuring customers feel valued and supported), Team Calm (avoiding agent burnout), and System Calm (keeping operations stable and predictable) [23]. For example, track how well your AI identifies and escalates high-risk intents to human agents using an "Escalation Grace Score." Normalize metrics across channels to avoid skewed data [2][23]. As Thinking Loop puts it:
Calm is knowing the system knows its limits [23].
FAQs
What’s the best way to define a “meaningful” first response?
A meaningful first response strikes the perfect balance between speed and accuracy. It’s not just about replying quickly – it’s about providing a solution that directly addresses the customer’s issue. A well-crafted response minimizes delays, avoids confusion, and reduces the need for back-and-forth exchanges.
How do I measure recontact rate without inflating FCR?
To accurately measure recontact rate without artificially inflating First-Contact Resolution (FCR), it’s essential to focus on follow-ups that occur within a set time frame after the initial resolution. Prioritize tracking only meaningful recontacts – those that indicate unresolved issues or additional needs.
Incorporate tools like the Customer Effort Score (CES) and sentiment analysis to dig deeper into whether these recontacts result from lingering problems. AI-powered solutions can also help by analyzing the context of interactions, ensuring you’re capturing genuine recontacts instead of skewing the data with irrelevant follow-ups.
Which queue metrics should I segment by account tier?
Breaking down metrics such as average queue time, claim-to-contact time, first-contact resolution, and resolution velocity by account tier can make a world of difference. This approach helps you identify where to focus your efforts, ensuring high-value accounts get the attention they deserve.
By analyzing these metrics through the lens of account tiers, you can prioritize resources more strategically. For example:
- High-value accounts: Faster response times and higher resolution rates can strengthen relationships and improve retention.
- Lower-tier accounts: Identifying areas for efficiency can help maintain service quality without overextending resources.
This segmentation allows your team to allocate support resources where they’ll have the greatest impact, balancing customer satisfaction with operational efficiency.