Metric confusion wastes time and causes bad decisions. Teams often argue over unclear definitions like what counts as "resolved" or "first response." This leads to inflated dashboards, misaligned priorities, and poor customer experiences. The solution? Clear, standardized definitions for SLA, TTR, and FCR.
- SLA (Service Level Agreement): Sets response and resolution time goals. Avoid confusion by using business hours for team efficiency and calendar hours for customer experience.
- TTR (Time to Resolution): Measures how long it takes to solve issues. Use medians and percentiles (e.g., P90) to uncover delays hidden by averages.
- FCR (First Contact Resolution): Tracks resolution on the first attempt. Define "resolved" clearly and exclude reopened or unrelated follow-ups to avoid inflating metrics.
AI tools can automate tracking, reduce errors, and ensure consistent reporting. This eliminates manual disputes and lets teams focus on improving service, not debating numbers.
First Call Resolution: Boost FCR in 8 Minutes
sbb-itb-e60d259
Defining SLA: Setting Clear Response and Resolution Expectations
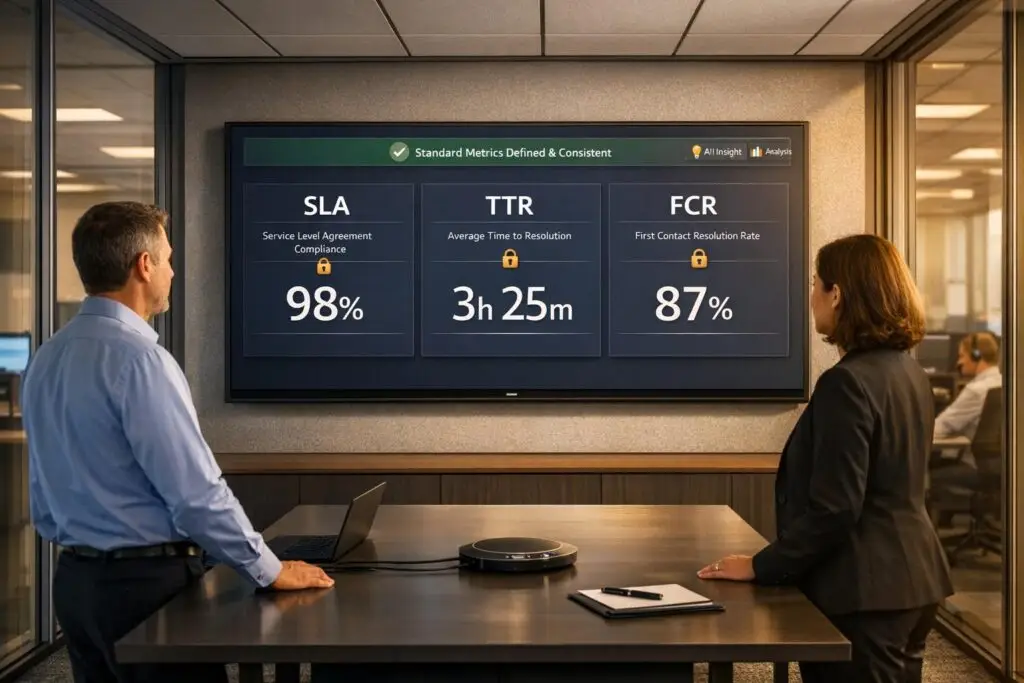
To avoid confusion over metrics, having clear definitions is crucial. A Service Level Agreement (SLA) is essentially a formal promise between your support team and customers. It sets specific goals for how quickly your team will respond to and resolve issues. For example, it might state that tickets will be acknowledged within a certain number of hours (X) and resolved within another set timeframe (Y). This structure creates a predictable service standard and helps you measure whether your team meets customer expectations.
What Is SLA and Why It Matters
SLAs focus on two key timeframes: first response time (how quickly your team acknowledges a ticket) and resolution time (how long it takes to completely solve the issue). Top-performing support teams aim for impressive benchmarks: less than 1 hour for email responses (compared to a 12-hour baseline), under 1 minute for live chat (versus a 1.5-minute average), and just 1 hour for social media replies (versus a 5-hour standard) [5].
How to Calculate SLA Compliance
SLA compliance is calculated using this formula: (SLA-met tickets ÷ Total SLA-bound tickets) × 100 [4]. For instance, if your team resolves 85 out of 100 SLA-bound tickets within the specified timeframe, your compliance rate is 85%.
It’s important to track two separate compliance rates:
- First Response SLA%: This measures the percentage of tickets acknowledged within the SLA timeframe. The formula is (Tickets with first response within SLA ÷ Total tickets with first response sent) × 100.
- Resolution SLA%: This tracks the percentage of tickets resolved on time. The formula is (Tickets resolved within SLA ÷ Total tickets resolved) × 100 [4].
One key point: SLAs should be measured in business hours – excluding nights and weekends – to provide an accurate view of team efficiency. At the same time, tracking calendar time separately is important for understanding the customer’s overall wait experience. For example, a ticket resolved in 8 business hours may span 3 calendar days if submitted late on a Friday, which could impact how the customer perceives the delay [5].
Common Problems in SLA Reporting
SLA reports can become misleading when they include irrelevant data, such as reopened tickets, spam, or non-support inquiries. These inflate compliance rates and obscure real performance issues [5]. Up next, we’ll dive into Time to Resolution (TTR) and how it helps fine-tune these metrics.
Understanding TTR: Measuring Resolution Speed Consistently
SLA compliance shows whether you’re keeping your promises, but Time to Resolution (TTR) goes a step further – it tells you how long customers actually wait for their problems to be solved. In B2B support, TTR directly affects customer downtime and potential business risks [1]. As Mike Taylor, a marketer at SurveyNinja, explains:
Time to Resolution is one of the most honest service metrics because it measures what customers ultimately care about: how long problems last [1].
What Is TTR and How to Measure It
TTR tracks the total time from when a support ticket is created to when it’s resolved. The formula is simple: Time of Resolution minus Time of Ticket Creation, averaged across all tickets. However, defining what counts as "resolved" can be tricky. Teams need to agree on clear criteria, such as customer confirmation or a predefined inactivity period, before marking a ticket as closed [1][3].
It’s important to distinguish TTR from top support metrics like First Response Time (FRT) and First Contact Resolution (FCR). FRT measures how quickly a ticket is acknowledged, while FCR focuses on resolving issues in a single interaction. TTR, on the other hand, measures the entire resolution journey. For instance, a fast FRT but a slow TTR could indicate superficial responsiveness without meaningful progress [1]. Understanding these differences is key to avoiding common reporting mistakes.
Common Problems in TTR Reporting
One common issue is treating all tickets the same. Averaging simple tasks, like password resets, with complex problems can obscure meaningful performance insights [1][6]. To get a clearer picture, segment TTR data based on factors like issue type, priority, and complexity. For example, you might aim for a 2–4 hour resolution time for critical (P1) issues but allow up to 5 business days for low-priority requests [6].
Reopened tickets can also skew TTR metrics. If the resolution clock resets improperly, reopened cases may inflate TTR or be counted twice [6]. Similarly, cross-team handoffs – such as waiting for input from engineering or logistics – can significantly delay resolutions. To address this, set internal SLAs for these handoffs and track "waiting for" statuses to identify bottlenecks [5].
Relying solely on average TTR can be misleading. Instead, monitor the median TTR and the 90th and 95th percentiles to highlight outliers and uncover systemic delays [2]. This approach provides a more complete view of performance and helps pinpoint areas needing improvement.
Defining FCR: Tracking First Contact Resolutions Accurately
After discussing how to measure resolution speed, it’s equally important to evaluate whether issues are resolved correctly on the first attempt.
While Time to Resolution (TTR) focuses on how long it takes to resolve an issue, First Contact Resolution (FCR) zeroes in on whether the problem was effectively handled during the initial interaction. In B2B support, FCR isn’t just about speed; it’s about effectiveness – did the agent have the tools, information, and authority to resolve the issue without requiring follow-ups? As Chris Kontes, Co-Founder of Balto, explains:
First Contact Resolution isn’t just a performance metric – it’s a reflection of how well your contact center understands and supports its customers [8].
In B2B SaaS and tech, where the stakes are high, resolving issues on the first contact builds trust, reduces customer effort, and cuts costs by avoiding repeat interactions that consume additional resources.
What Is FCR and How to Calculate It
The formula for FCR is straightforward: (Tickets resolved in a single contact ÷ Total tickets) × 100. However, defining what counts as "resolved" adds complexity. Many teams prefer to use Net FCR, which excludes cases that can’t be resolved on the first contact, such as abandoned calls or necessary escalations. This provides a clearer picture of agent performance. On the other hand, Gross FCR includes all interactions and is often used for capacity planning [8].
To ensure accurate tracking, it’s helpful to implement a resolution window of 48–72 hours before officially closing a case. This allows time for any delayed follow-ups and prevents premature closure [7][8]. For instance, if a customer reopens a ticket within 72 hours regarding the same issue, that case shouldn’t count as FCR. Industry benchmarks for Technology and SaaS companies typically range between 70% and 85% [8], offering a realistic goal for teams.
Now, let’s dive into the challenges that can complicate FCR tracking.
Common Problems in FCR Tracking
One of the biggest hurdles in tracking FCR is inconsistent definitions of what qualifies as "resolved." Some teams consider a ticket resolved as soon as an agent sends a response, while others require explicit confirmation from the customer. Without a standardized definition across all communication channels – like email, chat, and phone – FCR data can become unreliable [8].
Omnichannel disconnects further complicate tracking. For example, if a customer starts a conversation in chat but follows up via email, many systems fail to link these interactions, incorrectly logging them as separate first contacts [8]. Similarly, unrelated follow-ups can distort data. A customer might reopen a resolved ticket to ask a completely different question, and many systems mistakenly count this as an FCR failure [7].
Manual tracking also introduces inconsistencies due to human error and unclear criteria [8]. This is where AI-driven tools come in. These tools analyze case history and customer behavior to automatically determine whether an issue was genuinely resolved on the first contact, eliminating the guesswork. Platforms like Supportbench, for instance, offer AI-powered FCR detection, ensuring consistent and accurate reporting without relying on manual input.
How Teams Misinterpret SLA, TTR, and FCR
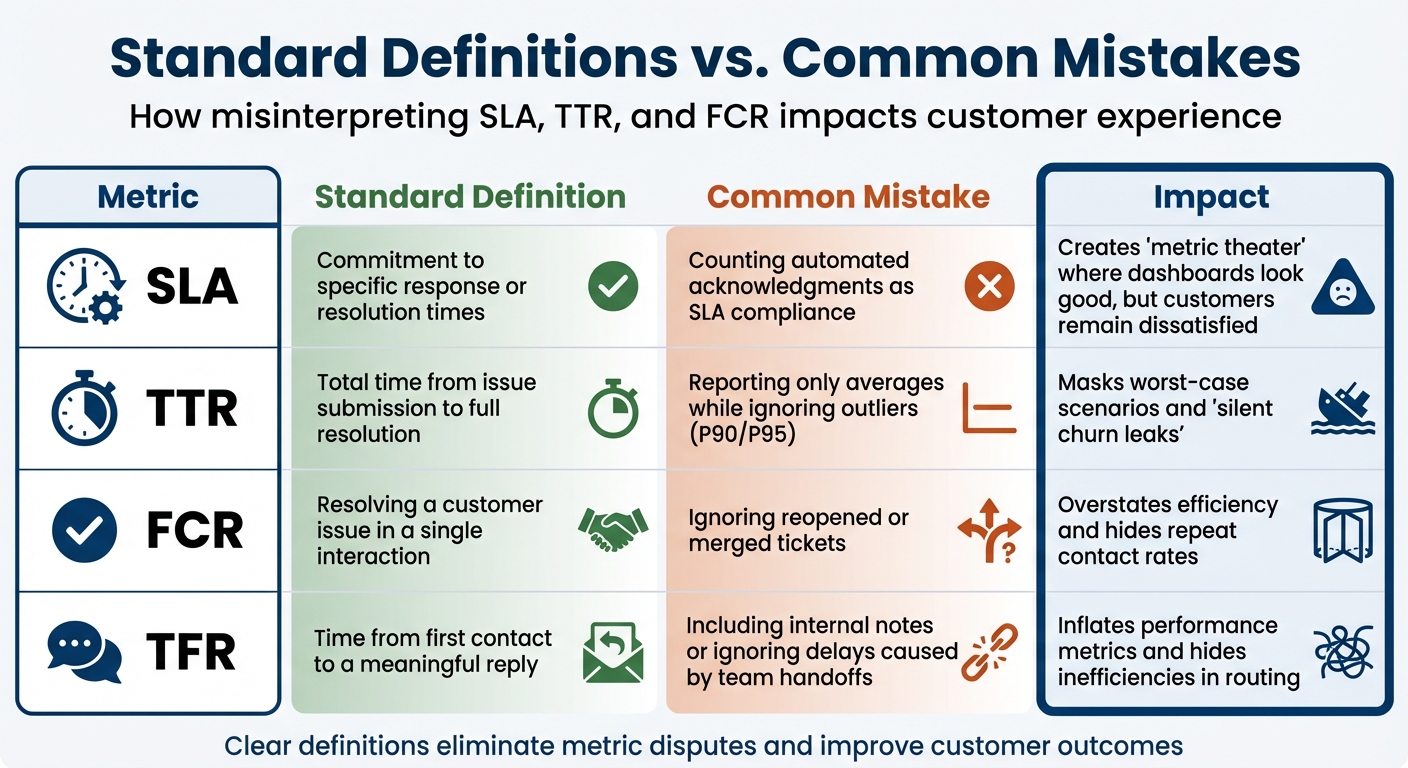
Support Metrics: Standard Definitions vs Common Mistakes (SLA, TTR, FCR)
Even when teams agree on which metrics to track, they often interpret them differently. And this isn’t just a minor issue – it can mess up reporting, skew accountability, and ultimately hurt the customer experience. The root cause? A lack of clear, standardized definitions and rules across departments. Without this alignment, both internal processes and customer satisfaction take a hit.
One recurring issue is something often called "metric theater." This happens when teams focus on looking good on paper rather than delivering real value to customers. For example, some teams count automated "we received your request" emails as meeting an SLA. While it might make dashboards look great, it does little to help customers who are still waiting for a real response. As Teammates.ai explains:
A fast acknowledgement that does not answer the question, verify identity, or set an ETA is not revenue protection. It is optics [2].
Another misstep is focusing on averages instead of outliers. Reporting only average TTR (Time to Resolution) can hide the worst customer experiences. Teammates.ai highlights this problem:
If you report average TFR, you are measuring the wrong thing. Customers experience the tail, not the mean [2].
Consider the difference between a 2-minute median and a 6-hour P90 (90th percentile); that gap represents what Teammates.ai calls a "silent churn leak" [2].
Misinterpreting FCR (First Contact Resolution) is another common pitfall. For instance, reopened or merged tickets are sometimes treated as new resolutions, inflating FCR performance. But a reopened ticket means the issue wasn’t truly resolved the first time.
Table: Standard Definitions vs. Common Mistakes
| Metric | Standard Definition | Common Mistake | Impact |
|---|---|---|---|
| SLA | Commitment to specific response or resolution times | Counting automated acknowledgments as SLA compliance | Creates "metric theater" where dashboards look good, but customers remain dissatisfied [2] |
| TTR | Total time from issue submission to full resolution | Reporting only averages while ignoring outliers (P90/P95) | Masks worst-case scenarios and "silent churn leaks" [2] |
| FCR | Resolving a customer issue in a single interaction | Ignoring reopened or merged tickets | Overstates efficiency and hides repeat contact rates [2] |
| TFR | Time from first contact to a meaningful reply | Including internal notes or ignoring delays caused by team handoffs | Inflates performance metrics and hides inefficiencies in routing [2] |
Getting these definitions right is crucial for aligning teams and improving operations. Clear, standardized metrics also set the stage for using built-in AI to automate tracking and ensure consistent, reliable reporting.
Using AI to Standardize Metrics and Improve Reporting
When metrics are clearly defined, AI can take over the heavy lifting of tracking and reporting. By automating these processes, AI reduces manual errors and ensures consistency. Instead of juggling spreadsheets or relying on subjective interpretations, AI provides a single source of truth for tracking SLA, TTR, and FCR across teams [9]. This creates a foundation for setting clear, actionable benchmarks throughout your operations.
Step 1: Align Teams on Metric Definitions
Before diving into AI implementation, it’s crucial to standardize metric definitions through cross-department collaboration.
Take "resolved", for instance. Does it mean the customer has confirmed the issue is fixed? Or does it mean no follow-up activity has occurred for 48 hours? Often, resolution is tied to customer confirmation or a period of inactivity after a bot’s response [3]. Similarly, decide whether you’ll measure performance in business hours (team efficiency during shifts) or calendar hours (customer experience, including nights and weekends) [5]. Business hours highlight internal efficiency, while calendar hours show the customer’s perspective.
You’ll also need to agree on data cleaning standards. Determine which tickets to exclude from reports, such as spam, internal requests, marketing inquiries, or reopened cases [5]. Without this alignment, even the most advanced AI tools can produce unreliable data.
Step 2: Automate Tracking with AI
AI tools excel at automating the tracking of metrics like SLA compliance, TTR, and FCR – eliminating manual data entry and subjective judgment. This removes debates over whether a ticket met its SLA or was resolved on the first try.
For example, modern AI, powered by LLMs, can analyze conversations to verify ticket resolution and avoid false FCR counts [3]. It can track "Repeat Call Rates" over a specific timeframe, such as 7 days, to ensure FCR accuracy. If a customer revisits the same issue within that window, the AI flags it as a failed resolution – even if the ticket was initially marked "resolved" [9].
AI also enables real-time SLA alerts, notifying agents when a ticket is nearing its SLA deadline. This allows teams to act quickly and prevent breaches [5]. High-priority issues, like billing errors or integration failures, can be escalated automatically to the appropriate team, ensuring SLA targets are met [5].
Another powerful feature is automated MTTR segmentation. AI can separate Mean Time to Resolution for AI-handled cases versus escalated ones. If escalated MTTR is high, it signals issues with handoffs or Tier 2 capacity – not the AI itself [9]. This level of detail helps pinpoint bottlenecks and improve resource allocation.
With these tools in place, the next step is to focus on setting measurable benchmarks and tracking performance.
Step 3: Set Benchmarks and Monitor Performance
Once AI ensures consistent metric tracking, you can establish benchmarks and monitor progress through AI dashboards. These benchmarks provide clear goals and help identify areas for improvement.
For example:
- Aim for a First Call Resolution (FCR) rate of 70–80%. Top-tier performance exceeds 80% [3].
- Target a Mean Time to Resolution (MTTR) of 4–8 minutes for AI-resolved cases [9].
- Keep the Repeat Call Rate under 8% to validate FCR accuracy [9].
- Maintain an escalation rate below 20%, ensuring AI handles most routine inquiries [3].
Dashboards should also track escalation quality, aiming for 75% of escalations scoring 4 or 5 on a 1–5 scale [9]. This ensures that when AI passes a ticket to a human, it includes all the necessary context for quick resolution. Reducing escalations to Tier 2 can save $25–50 per ticket in engineering time [9].
AI analytics can also highlight underperforming areas. For instance, if certain issues have an FCR below 50% after 60 days, it may indicate a need to refine workflows or update knowledge base content [9]. This creates a feedback loop where AI identifies gaps, and your team addresses them, making the system smarter over time.
| Metric | Target Benchmark | Purpose |
|---|---|---|
| First Call Resolution (FCR) | 70–80% | Measures initial problem resolution [9] |
| Repeat Call Rate | <8% | Validates FCR accuracy [9] |
| MTTR (AI-resolved) | <8 minutes | Measures automated resolution speed [9] |
| Escalation Quality Score | 4.0+ / 5 | Assesses AI-to-human handoff effectiveness [9] |
| Customer Effort Score (CES) | 6+ / 7 | Evaluates ease of process [9] |
Conclusion: Stop Metric Fights with Clear Definitions
Metric disagreements often arise when definitions lack clarity, scope rules are undefined, and terms like "resolved" or "first response" are interpreted differently. For instance, one team might count bot acknowledgments as valid responses, while another insists on waiting for a human reply. This isn’t a performance comparison – it’s a clash of interpretations [2].
The solution lies in creating standardized definitions. Decide what "resolved" means, clarify whether you’re tracking business hours or calendar hours, and specify which tickets should be excluded from reports. Define SLA pause reasons in advance, distinguish between "first touch" and "first meaningful response", and establish a contact window for measuring First Contact Resolution (FCR) [2]. Without these standards, even the most advanced AI tools can’t deliver reliable data.
AI can help by removing manual effort and subjective bias, which are often at the root of metric disputes. It enforces strict scope rules, tracks repeat call rates to identify false resolutions, and shifts the focus from averages to metrics like median and P90, which highlight the worst customer experiences that averages can mask [2]. Companies that measure FCR consistently for over a year have reported up to a 30% improvement in performance [10].
"If you do not standardize what ‘first response’ means and what counts, teams will game it unintentionally." – Teammates.ai [2]
With clear definitions and AI-driven automation, your team can move past internal debates and focus on delivering better customer outcomes. Metrics should not be treated as tools for internal competition but as instruments to identify bottlenecks, refine processes, and improve service. When definitions are standardized and AI handles tracking, your team can dedicate their energy to addressing real challenges rather than arguing over metrics.
FAQs
What should count as “resolved” in our reports?
In support reporting, the term "resolved" indicates that the customer’s issue has been completely addressed during the very first interaction. This means there’s no need for any follow-up or escalation. When it comes to metrics like First Contact Resolution (FCR), it specifically refers to successfully handling the issue in a way that ensures the customer doesn’t have to reach out again. By standardizing this definition across teams, you can ensure consistent and accurate reporting while avoiding misunderstandings about what counts as a resolution.
Should we measure SLA in business hours or calendar hours?
If your support team works specific business hours, you should measure SLA in business hours to reflect your operating schedule. For teams offering 24/7 support, it’s better to use calendar hours, as they account for all time, regardless of schedules. This approach ensures your SLA aligns with your promised availability while accurately tracking your team’s performance and commitments.
How can we prevent reopened or follow-up tickets from distorting FCR and TTR metrics?
To prevent reopened or follow-up tickets from distorting FCR (First Contact Resolution) and TTR (Time to Resolution), it’s crucial to clearly define what "resolution" means and ensure consistent tracking. For FCR, only include cases resolved during the first interaction, and treat follow-ups as new tickets unless they address ongoing, unresolved issues. For TTR, focus on measuring the total time it takes to fully resolve a ticket, rather than just the time to the initial response. Using AI tools and standardizing how tickets are categorized can help maintain accurate metrics and ensure clarity across teams.