
When replacing Pylon, the biggest challenge is maintaining a unified view of customer interactions and preserving key insights like customer sentiment, SLA compliance, and account health. Without proper planning, you risk fragmented data, missed signals, and disruptions in workflows tied to customer retention.
Here’s the quick answer:
- Define meaningful KPIs: Focus on metrics that align with your business goals (e.g., CSAT, NPS, FCR, and Cost per Ticket).
- Audit reporting gaps: Identify where Pylon falls short in integrating data, real-time insights, and SLA tracking.
- Preserve workflows: Document critical processes (e.g., handling ticket spikes or at-risk accounts) to maintain continuity.
- Choose AI-native tools: Opt for platforms that offer real-time dashboards, omnichannel integration, and predictive analytics.
- Build custom scorecards: Group metrics into categories like efficiency, quality, and cost, and automate updates using AI.
Example Impact: AssemblyAI reduced first response times by 97% (from 15 minutes to 23 seconds) and doubled AI resolution rates during their migration. The key? Clear KPIs, real-time insights, and automation.
Replacing Pylon isn’t just about replicating its features – it’s about creating a smarter, more efficient reporting system that drives better customer outcomes.
What a Good KPI Report Actually Looks Like
Defining Core KPIs for B2B Support Operations
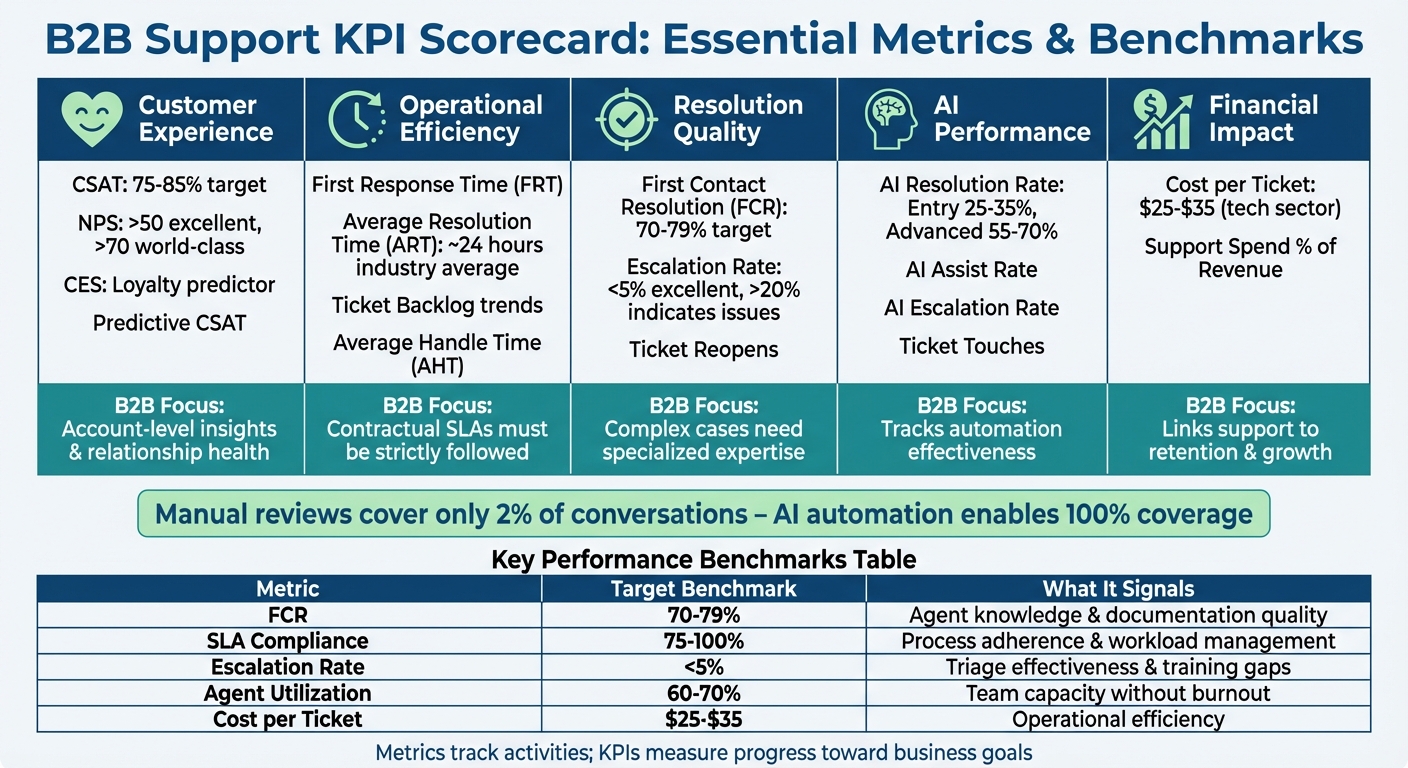
B2B Support KPI Scorecard Framework: Key Metrics and Benchmarks
To address the reporting challenges mentioned earlier, it’s essential to distinguish metrics from KPIs. Metrics track everyday activities like response times, while KPIs focus on progress toward specific goals – such as the percentage of tickets meeting SLA standards. Simply tracking ticket volume won’t tell you much about its effect on retention or churn.
B2B support requires a different mindset compared to typical help desk operations. Instead of concentrating solely on individual ticket ratings, the focus should shift to account-level health. For instance, recurring issues with a high-value account could signal a renewal risk, even if your overall CSAT score appears strong. As one expert puts it:
"If you’re only tracking how many tickets your team closed last week, you’re flying blind. High-performing support managers don’t focus on volume alone; they pay attention to the signals that move satisfaction, efficiency, and team health."
Key Metrics to Track
B2B support success hinges on a balanced scorecard that evaluates customer experience, operational efficiency, resolution quality, and financial impact. For customer experience, monitor CSAT (target range: 75%–85%), NPS (above 50 is excellent; above 70 is world-class), and Customer Effort Score (CES), which often predicts loyalty more effectively than CSAT.
Operational metrics include First Response Time (FRT), Average Resolution Time (ART) – which generally averages around 24 hours across industries – and ticket backlog trends.
Resolution quality metrics like First Contact Resolution (FCR) (typically 70–79%) and escalation rates (below 5% is ideal; above 20% indicates issues with documentation or triage) are critical. For AI-driven operations, track AI Resolution Rate (entry-level AI resolves 25–35% of tickets, while advanced systems handle 55–70%), AI Escalation Rate, and ticket touches to pinpoint automation gaps. Financial metrics such as Cost per Ticket (averaging $25–$35 in the tech sector) and support spend as a percentage of revenue help justify budgets and demonstrate ROI.
| Category | Key Metrics | B2B Nuance |
|---|---|---|
| Customer Experience | CSAT, NPS, CES, Predictive CSAT | Emphasize account-level insights and relationship health |
| Operational Efficiency | FRT, ART, Ticket Backlog, AHT | SLAs are often contractual and must be strictly followed |
| Resolution Quality | FCR, Escalation Rate, Ticket Reopens | Complex cases require specialized expertise |
| AI Performance | AI Resolution Rate, AI Assist Rate | Tracks how well automation supports operations |
| Financial Impact | Cost per Ticket, Support Spend % of Revenue | Links support efforts to retention and growth |
Once these metrics are defined, the next step is ensuring they align with your broader business objectives.
Aligning KPIs with Business Goals
Every KPI you track should tie directly to a business goal. For example, use CSAT and NPS to measure customer retention and loyalty, Cost per Ticket to evaluate efficiency, and SLA compliance to ensure contractual obligations are met. For renewal-focused workflows, consolidate support data by account to identify at-risk clients during QBRs. This requires moving from static weekly reports to real-time dashboards that notify managers of potential SLA breaches or escalation spikes before they affect customers.
The goal is to make metrics actionable. If a data point can’t inform decisions or lead to changes, it shouldn’t be prioritized. For instance, a drop in CSAT should prompt an investigation into root causes – whether it’s product issues, training deficiencies, or gaps in documentation – rather than just being logged as a statistic. Similarly, high ticket touch counts for AI-managed cases indicate automation inefficiencies that need attention.
Auditing Pylon‘s Reporting Gaps and Defining New Requirements
Take a close look at your current system to identify reporting gaps that might be holding back your B2B support operations. The aim is to document these gaps clearly so you can outline the exact requirements for your next platform.
Common Limitations in Pylon Reporting
One major issue to check for is whether support data integrates smoothly with systems like CRM, product analytics, and billing. Without this integration, key risk signals can slip through the cracks. For example, if your customer success team doesn’t realize that a high-value account has reported the same issue three times in two weeks, you could miss a clear sign of renewal risk.
Another challenge is relying on manual processes like Excel pivot tables for data analysis. This can eat up valuable time – up to 26 hours annually per team – and delay spotting critical trends. Imagine a support manager spending two hours compiling data only to discover that 40% of tickets involve a specific feature. By the time this is uncovered, the issue may have already impacted customers for several days.
Real-time insights are often missing as well. Standard dashboards tend to focus on what happened, not why. If recurring problems are only identified after they escalate into full-blown crises, your reporting system isn’t providing actionable insights.
Sentiment analysis is another area to evaluate. Does your current system track sentiment trends for individual accounts? Modern AI-powered sentiment tools, when fine-tuned for industry-specific language, can achieve accuracy rates of 85–90%. Additionally, consider whether your system monitors "radio silence" – accounts with no interactions for 60 days or more. These periods often signal disengagement.
Lastly, assess how well SLA (Service Level Agreement) tracking aligns with your needs. While Pylon tracks metrics like median response and resolution times (both including and excluding support hours), it may lack the flexibility required for dynamic SLAs. These might need to adjust based on factors like account value, renewal timing, or support tiers.
By identifying these gaps, you can set the stage for a smoother migration while ensuring that critical workflows remain intact.
Maintaining Continuity for Business-Critical Workflows
When migrating to a new platform, it’s crucial to preserve workflows tied to escalations, renewals, and long-term customer relationships. Start by documenting your existing playbooks. For instance, if a threefold increase in ticket volume within seven days currently triggers an executive sponsor check-in within 24 hours, this workflow must remain uninterrupted. Such continuity is vital for keeping your KPI scorecards accurate post-migration.
Clearly define tiered alerting thresholds before the transition. For example, if enterprise accounts trigger alerts at a sentiment score of –35 but mid-market accounts use –45, these rules need to be documented to avoid alert fatigue and ensure timely responses for key accounts.
Don’t overlook account intelligence workflows. If your CS team uses support data for quarterly business reviews or renewal discussions, your new system should consolidate ticket history, sentiment trends, and resolution patterns at the account level. Losing this context during migration could harm customer relationships.
Also, review how support signals are shared with product and success teams. For example, if recurring bug reports or feature requests are part of your product roadmap, make sure these handoffs are properly documented. Many organizations discover during migration that informal workflows were never clearly mapped, leading to disruption after the switch.
Finally, standardize data hygiene practices before setting up your new system. Issues like inconsistent naming conventions, unclear data ownership, or poor categorization can undermine new health scores or automated alerts. Cleaning up your historical data now will help avoid these problems down the line.
Here’s a quick look at some practical thresholds to maintain service continuity during the transition:
| Volume Pattern | CS Action | Timeline |
|---|---|---|
| 3× spike in 7 days | Immediate executive sponsor check-in | Within 24 hours |
| 50% increase for 30 days | Schedule deep-dive meeting to identify root causes | Within 1 week |
| Zero tickets for 60+ days | Proactive engagement campaign to check health | Within 1 week |
| Same issue >3 times | Escalate to product team for permanent fix | Within 48 hours |
Source:
Selecting AI-Native Tools with Built-In KPI Scorecards
Once you’ve identified reporting gaps and mapped out essential workflows, the next step is selecting an AI-native platform with built-in KPI scorecards. These tools are key to maintaining seamless and unified reporting, especially during the transition from Pylon.
Key Features to Look For
When evaluating platforms, focus on tools that offer predictive analytics. These go beyond historical data to forecast metrics like CSAT, CES, and FCR based on conversation sentiment – even before surveys are completed. This proactive approach allows your team to address potential issues in real time, rather than reacting after problems escalate.
Another essential feature is a 360-degree customer view. The platform should consolidate support tickets, product usage data, and CRM information into a single dashboard. This enables your team to see the bigger picture. For instance, if a customer reports a billing issue, the dashboard should instantly display their renewal date, recent interactions, and sentiment trends – without requiring your team to jump between systems.
AI-powered quality assurance is a game-changer. Instead of manually reviewing a fraction of customer interactions, modern tools can automatically evaluate 100% of tickets for empathy, tone, and accuracy. This ensures consistent quality across your team while saving time on spot-checking.
Don’t forget omnichannel integration. Customer support now spans platforms like Slack, Microsoft Teams, email, and in-app chat. Your chosen tool should unify these channels to eliminate data silos. Additionally, if you’re using AI agents to handle tickets, the platform should track AI-specific metrics such as assist rates, resolution rates, and escalation rates over time.
Lastly, prioritize customizable KPI dashboards that are ready to use immediately. You should be able to create scorecards by agent, team, or issue type without needing IT assistance. Many B2B teams adopting AI help desk software report faster response times and reduced ticket volumes within the first month.
Once you’ve identified platforms with these features, evaluate their cost structure and scalability to ensure they meet your long-term needs.
Evaluating Cost-Efficiency and Scalability
When comparing platforms, check whether their AI capabilities are built-in or added later. Tools designed with AI from the start typically offer smoother experiences and transparent pricing. In contrast, platforms that integrate AI through acquisitions often have fragmented interfaces and additional fees for resolutions.
Calculate the total cost of ownership, factoring in hidden costs like per-resolution fees, seat upgrades, and IT support. Many modern platforms can cut costs by 40–60% by including essential features in their base plans. In fact, AI-powered tools are known to reduce support expenses by 35–55%.
Deployment time is another consideration. AI-native platforms can be up and running in hours or days with minimal IT involvement, whereas legacy systems may take weeks and require external partners. These modern tools not only save time but also deliver measurable improvements in response and resolution rates.
"Our customers are developers who expect quick, actionable support. We needed a way to meet them where they work without slowing down." – Lee Vaughn, Manager of Support Engineering, AssemblyAI
For scalability, look for features like tiered alerting (critical, important, informational) and AI-prioritized workflows to manage growing ticket volumes without overwhelming your team. Ensure the platform allows you to customize how metrics – like ticket spikes or negative sentiment – affect overall customer health scores. This adaptability is essential as your business evolves.
sbb-itb-e60d259
Building and Implementing Custom Scorecard Templates
After selecting the right platform, the next step is crafting scorecard templates that align with how your B2B support team operates. Generic templates won’t cut it – you need tailored scorecards that track agent performance, escalations, customer health, and SLA adherence. These customized templates ensure continuity and measurable improvements after migration.
Designing Scorecard Templates
To start, organize your metrics into five key categories:
- Efficiency: Metrics like First Response Time and Average Resolution Time.
- Quality: Includes CSAT, NPS, and First Contact Resolution.
- Productivity: Tracks Tickets per Day and Agent Utilization.
- Compliance: Focuses on SLA adherence and Escalation Frequency.
- Cost: Measures Cost per Ticket.
Grouping metrics this way cuts through the noise, helping your team focus on data that drives results.
A good scorecard includes several components: reviewers, review periods, measurable goals, rating categories with weights and scales, and space for qualitative feedback. Keep rating categories limited to critical areas – like solution accuracy, empathy, and personalization – to avoid overloading reviewers.
Weighted scoring can emphasize the outcomes that matter most. For example, if your priority is boosting product engagement, assign higher weights to "personalization" and "solution accuracy." On the other hand, for enterprise accounts, you might focus more on "empathy" and "tone".
Choosing the right rating scale is equally important. Use a 2-point binary scale for straightforward tasks like verifying ticket tagging, while a 5-point scale works better for subjective areas like empathy or personalization. Standardizing definitions (e.g., how First Response Time is measured) ensures consistent data collection across the team.
Here’s how benchmarks can guide your template:
| Metric | Target Benchmark | What It Signals |
|---|---|---|
| First Contact Resolution (FCR) | 70–79% | Agent knowledge and documentation quality |
| SLA Compliance | 75–100% | Process adherence and workload management |
| Escalation Rate | < 5% (Excellent) | Triage effectiveness and training gaps |
| Agent Utilization | 60–70% | Team capacity without burnout risk |
| Cost per Ticket | $25–$35 (Technology sector) | Operational efficiency |
Since manual reviews cover only 2% of customer support conversations, designing scorecards with AI automation in mind can scale quality assurance to 100% of interactions without overwhelming your team.
Integrating AI Automation for Real-Time Updates
AI automation transforms static scorecards into dynamic tools that provide real-time insights. Metrics like First Response Time and Time to Resolution are continuously updated, turning your scorecards into live dashboards.
Set up automated SLA monitoring to flag tickets at risk of SLA breaches based on age and priority. This proactive approach allows managers to address issues before they escalate, potentially preventing up to 80% of escalations.
For customer health scoring, AI integrates data from your support system, CRM, and product analytics into a unified view. It tracks sentiment trends, survey responses, and interaction frequency to calculate real-time health scores. When scores drop, your team gets instant alerts, avoiding delays in addressing customer concerns.
AI-powered quality assurance reviews 100% of conversations for tone, empathy, and solution accuracy. Instead of manually reviewing a handful of tickets, AI surfaces outliers needing attention, ensuring consistent quality while freeing managers to focus on coaching.
Large language models (LLMs) can even explain metric shifts. For instance, if resolution times spike, AI can identify a specific product feature driving increased support volume. These insights help teams take immediate action – whether updating documentation, reporting bugs, or adjusting staffing levels.
Centralize data from all communication channels to maintain accuracy in real-time updates. Disjointed systems can skew metrics, making it harder to gauge true agent performance or customer health.
"Reliable tracking (like an AI assistant that monitors TTR) paired with verification means performance evaluations are backed by real data, not guesswork."
– Yoona Kim, Pylon
Lastly, use AI to automate executive summaries. Instead of spending hours compiling reports, let the platform condense complex scorecard data into concise insights and recommendations. For example, manual data gathering from multiple sources can take 30 minutes weekly – adding up to 26 hours per year before analysis even begins. AI eliminates this time sink, allowing your team to focus on actionable insights rather than data collection.
Monitoring and Measuring Success Post-Migration
A migration isn’t truly complete until your new reporting system delivers better outcomes. To maintain high support standards after the transition, it’s essential to focus on dashboards and KPIs that drive continuous improvement. This means creating tools that highlight actionable insights, tracking measurable progress in key metrics, and refining team operations based on findings. These practices build on the custom scorecard designs discussed earlier.
Setting Up Dashboards and Reports
Forget static PDF reports – real-time dashboards are the way to go. Think of them as your command center, enabling you to spot risks early and make quick adjustments. For clarity, ensure dashboards use US-standard formatting, like MM/DD/YYYY dates, comma-separated numbers, and dollar signs, so stakeholders can make fast, informed decisions.
Your dashboards should standardize metrics across channels – email, chat, voice, and self-service – making it easier to identify performance gaps. For B2B teams, go beyond individual ticket metrics and focus on account-level health. Track trends in satisfaction and SLA adherence for key clients, rather than relying on aggregate data. Add drill-down features so managers can dig into the "why" behind trends by accessing raw conversation data.
Set up automated SLA alerts to flag, reassign, or escalate tickets before breaches occur. Leverage AI-driven tools like predictive CSAT and CES to detect dissatisfaction before feedback is even collected.
"The best metrics don’t just track history – they change what happens next."
- Eric Klimuk, Founder and CTO of Supportbench.
Tracking Performance Improvements
Compare your new system’s performance to Pylon’s baseline, but ensure you’re making fair comparisons by standardizing KPI definitions upfront. Clearly document how each metric is calculated – for example, whether First Response Time starts at ticket creation or assignment. Use consistent tags, priority levels, and categories to ensure your data reveals meaningful patterns instead of noise.
Keep an eye on key benchmarks: First Contact Resolution (FCR) should fall between 70–79%, SLA compliance between 75–100%, and escalation rates under 5%. For Cost per Ticket, aim for the $25–$35 range typical of tech companies. If you’re using AI agents, track their assist and resolution rates separately to measure how automation impacts your team’s workload.
When metrics shift, dig deeper. Analyze customer messages to uncover root causes like unclear product steps or outdated documentation. Share these insights with product and account management teams to address underlying issues. This data can then guide targeted workflow improvements.
Iterating Workflows Based on Insights
Use the insights from your dashboards to fine-tune workflows. For example, if ticket reopens increase, audit your knowledge base and create better troubleshooting guides. If resolution times rise for specific product areas, review ticket transcripts to identify points of confusion. High AI escalation rates? It might be time to update your knowledge base or tweak AI response logic.
Pay attention to ticket touches – a high number often signals inefficiencies like unclear instructions or training gaps. Balance speed and quality by combining Average Handle Time with CSAT and FCR metrics. Automated ticket analytics can also reveal workflow issues, such as aging backlogs, escalation spikes, or declining FCR.
"Metrics should be signals, not goals. Low First Contact Resolution (FCR) might point to onboarding problems, while rising backlog often signals documentation gaps."
- Eric Klimuk.
Pair Customer Effort Score (CES) with CSAT to identify friction points in your processes, even when resolutions seem successful. By turning reporting into a tool for steering operations rather than just reflecting past performance, your team can continuously improve and deliver better outcomes.
Conclusion
Replacing Pylon means creating a reporting system that delivers real, measurable business outcomes. The focus should be on aligning your KPIs with your company’s broader objectives – not just tracking ticket volumes. Scorecards should highlight the metrics that truly impact your business, such as customer retention, revenue growth, and proactive interventions.
Once KPIs are clearly defined, modern tools can make a big difference. AI-native platforms turn support conversations into actionable insights, boost agent productivity, and lower costs through smart deflection strategies. But these advantages only come to life if you consistently update your scorecards, thresholds, and playbooks to reflect shifting customer needs.
Taking a dynamic approach to KPIs is key to long-term success after migration. High-performing teams use KPIs as real-time signals, leveraging sentiment analysis to spot at-risk accounts up to 40–60% faster and conducting quarterly workflow reviews to guide future strategies.
To stay ahead, build dashboards that provide real-time visibility and use AI to detect patterns and predict outcomes. By aligning scorecards with intelligent automation, your team can move beyond reactive problem-solving and focus on proactive customer success. This framework not only replaces Pylon but also sets your support team up for sustained success in an AI-driven world.
FAQs
What are the key KPIs to track for effective B2B customer support?
The key KPIs for B2B customer support revolve around two main areas: operational efficiency and customer satisfaction. Together, these metrics provide a clear picture of how well the support team is performing. Some of the most important ones include:
- First response time: Tracks how quickly your team responds to customer inquiries.
- Resolution time: Measures how long it takes to fully resolve an issue.
- Ticket volume: Keeps tabs on the number of support requests coming in.
- Customer satisfaction scores: Metrics like CSAT (Customer Satisfaction Score) and NPS (Net Promoter Score) gauge client happiness and loyalty.
In addition to these, other metrics play a big role in evaluating team performance. For instance, SLA compliance ensures your team meets service level agreements, while ticket backlog and agent utilization highlight workload and resource management. Escalation rates can reveal how often issues require higher-level intervention, pointing to potential gaps in first-line support.
For B2B companies, monitoring account health signals, retention rates, and support sentiment analysis is especially important. These metrics provide deeper insights into the challenges of maintaining strong, long-term client relationships.
The real challenge lies in choosing the right mix of KPIs. You need a balance between metrics that measure speed and productivity and those that assess customer experience and relationship quality. This balance becomes even more critical when creating reports or KPI scorecards, particularly during platform transitions or upgrades.
How can AI-powered tools enhance customer support reporting and KPI tracking?
AI-driven tools are transforming customer support reporting by automating the way data is collected, analyzed, and presented. They pull information from various sources – such as support tickets, CRM platforms, and product analytics – and bring it all together in unified dashboards. This makes it easier for teams to quickly identify trends, recurring problems, and even understand customer sentiment. The best part? It eliminates the need for manual data processing, allowing teams to make faster, more informed decisions.
These tools go a step further by using machine learning to spot anomalies, flag accounts that might be at risk, and create concise summaries. Essentially, they turn raw data into insights that teams can act on. By simplifying reporting and sharpening KPI tracking, these solutions help support teams work more efficiently, retain customers, and consistently improve the quality of their service.
What are the key steps to successfully transition from Pylon while building effective reporting and KPI scorecards?
To move seamlessly from Pylon and set up effective reporting and KPI scorecards, start by pinpointing the key metrics and KPIs that directly support your customer service and success objectives. Make sure to identify the essential data you need to preserve and confirm it’s accurately transferred to your new system.
Once that’s in place, create workflows that leverage AI-powered automation to simplify reporting and KPI tracking. This approach ensures your operations stay efficient and minimizes disruptions during the migration process. After the transition, carefully check the accuracy of your data, monitor metrics to spot any inconsistencies, and adjust workflows as necessary.
Lastly, keep communication open with stakeholders and provide thorough training for your team on any new tools or processes. These steps will help you maintain consistency, enhance efficiency, and ensure your operations stay aligned with your goals during and after the migration.