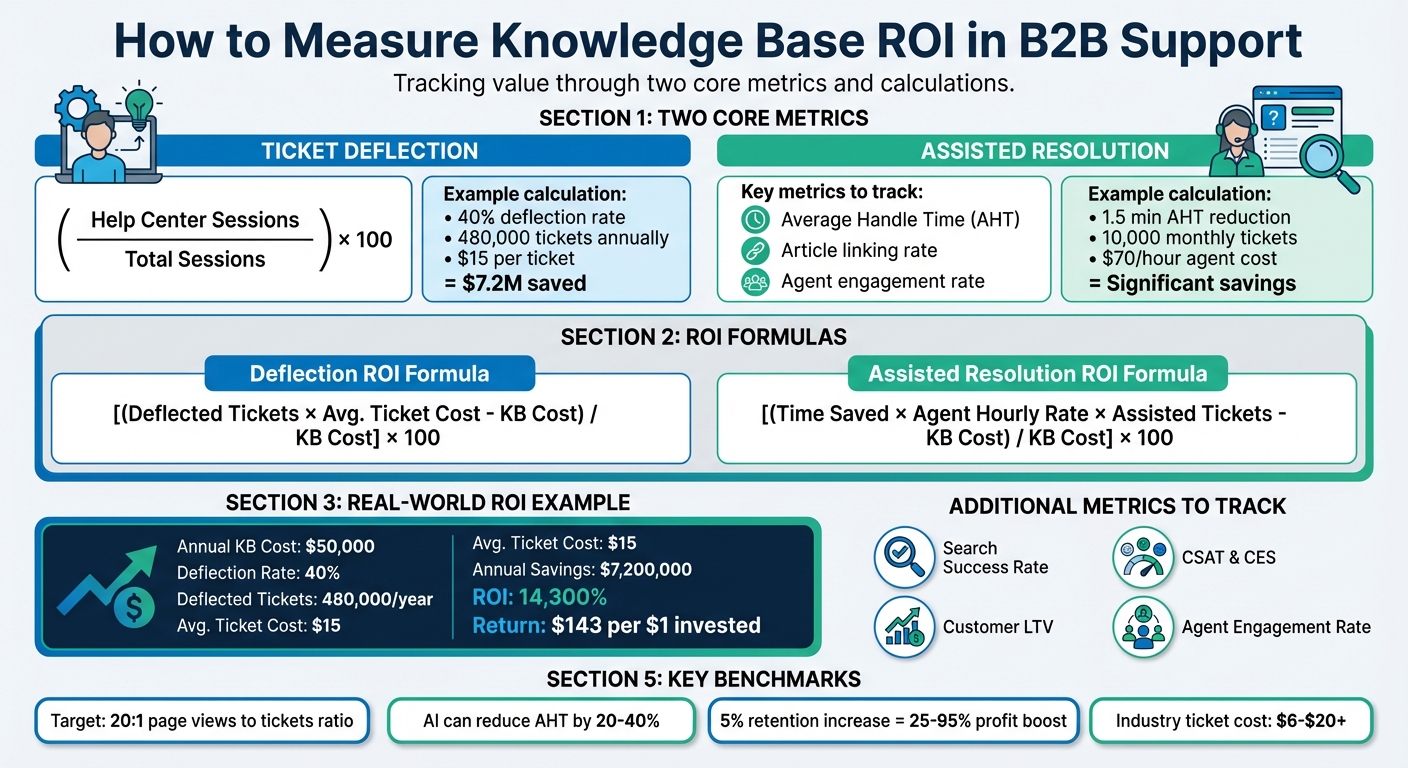
To measure the ROI of a knowledge base in B2B, focus on two critical metrics: ticket deflection and assisted resolution. These metrics directly show how a knowledge base impacts support costs and efficiency:
- Ticket Deflection: Tracks how many users solve issues independently through self-service, reducing ticket volume. Calculate deflection rate as:
(Help Center Sessions Without Ticket Submission / Total Help Center Sessions) × 100.
Example: A 40% deflection rate for 480,000 tickets annually at $15 per ticket saves $7.2M. - Assisted Resolution: Measures how much faster agents resolve issues using the knowledge base. Track key customer service metrics like Average Handle Time (AHT), article linking rate, and agent engagement rate.
Example: Reducing AHT by 1.5 minutes for 10,000 monthly tickets at $70/hour yields significant savings.
Key ROI Formulas:
- Deflection ROI:
(Deflected Tickets × Avg. Ticket Cost – Knowledge Base Cost) / Knowledge Base Cost × 100 - Assisted Resolution ROI:
[(Time Saved × Agent Hourly Rate × Assisted Tickets) – Knowledge Base Cost] / Knowledge Base Cost × 100
Additional Metrics to Track:
- Search Success Rate: Percentage of searches leading to article views.
- Customer Satisfaction (CSAT) and Customer Effort Score (CES): Link knowledge base usage to improved customer experience.
- Customer Lifetime Value (LTV): Retention improvements from self-service directly impact profitability.
Regularly review metrics, update outdated content, and use AI tools to enhance efficiency. A strong knowledge base not only reduces costs but also improves resolution speed and customer retention.
Knowledge Base ROI Calculation Guide for B2B Support
Key Metrics to Track
When evaluating the impact of your knowledge base, focus on metrics that demonstrate its ability to reduce support costs rather than simply expanding content. These measurements are essential for showcasing the return on investment (ROI) in B2B support settings.
Deflection Rate: Measuring Self-Service Success
The deflection rate reveals how many users resolve their issues through the knowledge base instead of submitting a support ticket. Calculating it is simple: divide the number of help center sessions that didn’t result in a ticket by the total help center sessions, then multiply by 100.
For example, if your help center sees 10,000 sessions and 6,000 of those result in ticket submissions, your deflection rate is 40%. This means four out of ten visitors found solutions without needing assistance, directly contributing to cost savings and operational efficiency.
But don’t stop at pageviews. Another critical metric is the search success rate, which measures the percentage of searches that lead to article views instead of "no results" pages. Searches that fail to deliver relevant results often lead to ticket submissions. Regularly reviewing your top "no results" search terms can help you pinpoint gaps in your content.
Additionally, track your self-service score – comparing total sessions to ticket submissions. For example, a 40:1 session-to-ticket ratio compared to a 4:1 industry benchmark highlights a well-performing knowledge base.
Once you’ve assessed self-service performance, shift focus to how the knowledge base supports agents in resolving tickets more efficiently.
Assisted Resolution Rate: Measuring Agent Efficiency Gains
While deflection metrics focus on self-service, assisted resolution rate measures how effectively your knowledge base helps agents resolve tickets faster and with greater accuracy.
This involves monitoring the article linking rate – how often agents link knowledge base articles to tickets – and the resolution success rate that follows. High linking rates paired with successful resolutions signal that your content is aiding agents effectively.
Another key metric is average handle time (AHT). Compare AHT before and after implementing the knowledge base. For instance, a drop in resolution time from 24 to 16 hours demonstrates its positive impact. AI tools that surface relevant content for agents can further cut down search time and improve efficiency.
Lastly, track the agent engagement rate, which measures how often agents use knowledge base tools during ticket resolution. Low engagement may indicate that agents lack trust in the content or face accessibility issues, which can undermine the system’s ROI.
sbb-itb-e60d259
How to Calculate Deflection ROI
Calculating deflection ROI accurately is crucial for making informed decisions in AI-driven B2B support operations.
Deflection ROI Formula with Example
Here’s the formula to calculate deflection ROI:
(Deflected Tickets × Average Ticket Cost – Knowledge Base Cost) / Knowledge Base Cost × 100.
This formula tells you the return on every dollar spent on your knowledge base. Let’s break it down with an example:
- Annual Knowledge Base Cost: $50,000
- Help Center Activity: 100,000 sessions per month
- Deflection Rate: 40% (preventing 40,000 tickets monthly or 480,000 annually)
- Average Ticket Cost: $15
Annual savings from deflected tickets: 480,000 × $15 = $7,200,000.
ROI: (($7,200,000 – $50,000) / $50,000) × 100 = 14,300%.
This means a $143 return for every dollar invested – far exceeding the standard 5:1 ROI benchmark for B2B support activities.
To calculate the average ticket cost accurately, include all relevant expenses like agent salaries, benefits, software licenses, and overhead. Divide the total by the number of tickets handled annually. Depending on ticket complexity, costs typically range from $6 to $20+.
Once you’ve calculated ROI, use analytics to refine and validate these numbers further.
Using Analytics to Measure Deflection Impact
Raw deflection numbers alone don’t tell the whole story. To get a more complete picture, combine various metrics. Start by tracking your search success rate – the percentage of searches that lead to article views rather than "no results" pages. Failed searches often result in ticket submissions, so identifying and addressing top "no results" queries can help close costly content gaps.
Another approach is comparing ticket volumes before and after launching or updating your knowledge base. Be sure to factor in customer base growth to avoid skewed data. For instance, if your customer base grows by 20% but ticket volume only rises by 5%, your knowledge base is effectively absorbing the extra demand. Segment data by customer type (e.g., free vs. paid accounts) or product feature to identify where content improvements will have the greatest financial impact.
Use both quantitative data (like search success rates) and qualitative feedback (such as helpfulness ratings and scroll depth) to confirm that customers are finding solutions.
"Setting ROI benchmarks for the first time is about creating a starting point, not achieving perfection. It’s better to have an informed baseline to work from than to operate without any measurable goals."
- Meg Cintorino, VP of Marketing at Conveyor Marketing Group
Understanding these analytics nuances can help you avoid common tracking mistakes, which are discussed next.
Common Deflection Tracking Mistakes
One frequent mistake is overestimating deflection by assuming every session would have resulted in a ticket. In reality, not every visitor intends to submit a ticket; some may simply be browsing or researching. Metrics like Search Exit Rate and Time on Page can help identify whether short sessions or immediate exits indicate unsuccessful deflection.
Another common error is ignoring the Total Cost of Ownership (TCO) when calculating ROI. Beyond platform fees, consider implementation costs, internal training, ongoing content audits, and system administration. Overlooking these hidden expenses can inflate ROI expectations and lead to budget issues.
Finally, treating ROI as a one-time calculation is a missed opportunity. Support demands evolve, so it’s important to review deflection metrics regularly. Audit your top 10 most-visited articles for accuracy, and update outdated content to maintain user trust. Regular validation is especially critical in B2B environments, where 56% of marketers cite data accuracy as a major challenge.
How to Calculate Assisted Resolution ROI
After exploring deflection ROI, let’s dive into assisted resolution ROI – a key metric for evaluating how your knowledge base boosts productivity during complex B2B support interactions. This calculation highlights how much time and cost your agents save by using the knowledge base while resolving tickets, showcasing its impact on efficiency and error reduction.
Assisted Resolution ROI Formula with Breakdown
The formula for assisted resolution ROI is:
Assisted Resolution ROI = [(Time Saved × Agent Hourly Rate × Assisted Tickets) – Knowledge Base Cost] / Knowledge Base Cost × 100.
Here’s a quick explanation of each variable:
- Time Saved: The reduction in Average Handle Time (AHT) per interaction due to the knowledge base.
- Agent Hourly Rate: The fully loaded hourly cost of an agent, factoring in salary, benefits, taxes, and overhead.
- Assisted Tickets: The total number of cases where agents utilized knowledge base content.
- Knowledge Base Cost: Includes software licenses, implementation, and maintenance expenses for the knowledge base.
For example, Innovate Solutions Inc. managed to cut AHT by 1.5 minutes per interaction across 10,000 monthly cases. With agents costing $70/hour and a knowledge base investment of $120,000, they achieved an impressive annual gain of $710,000. This translates to a 492% ROI with a payback period of just two months.
Don’t overlook additional benefits like faster onboarding for new hires and reduced escalation rates to higher-tier support. A well-structured knowledge base serves as a virtual guide, helping new agents ramp up quickly and cutting down on extended training costs.
Industry Benchmarks for Resolution Time Improvements
Setting realistic goals is easier when you understand industry benchmarks. For instance, a searchable knowledge base can cut the time agents spend hunting for information by up to 35%. In B2B support, reducing ticket resolution time from 24 hours to 16 hours represents a 33% improvement in efficiency.
The cost of handling a single support ticket ranges from $6 to over $20, depending on complexity. To establish your baseline, track metrics like AHT, First Contact Resolution (FCR), and average hold times over a 3–6 month period before rolling out your knowledge base. This "before" data is essential for meaningful comparisons.
Another key metric to monitor is your Search Success Rate, which measures how often agent searches lead to useful article views. Failed searches waste time, increase escalations, and negatively impact ROI.
Using AI to Track Assisted Resolution More Accurately
Manually tracking which tickets leverage knowledge base content can be tedious and error-prone. AI-powered tools simplify this process with features like auto-tagging and sentiment analysis, which automatically identify when agents use knowledge base resources to resolve tickets – no manual input required.
AI copilots further enhance efficiency by surfacing relevant knowledge base articles and past ticket data in real-time during live interactions. This not only reduces research time but also improves the accuracy of your ROI calculations. Additionally, intelligent triage systems categorize tickets more consistently than manual processes, ensuring cleaner and more reliable data.
Some advanced platforms go a step further, incorporating predictive CSAT (Customer Satisfaction) and CES (Customer Effort Scores) to flag dissatisfied customers before they churn. This links your knowledge base’s performance directly to retention metrics – a crucial consideration in B2B environments, where improving customer retention by just 5% can boost profits by 25% to 95%. These AI-driven tools integrate seamlessly into your ROI tracking efforts, strengthening the case for investing in a robust knowledge base system.
Additional Metrics That Support ROI Measurement
Expanding on metrics like deflection and assisted resolution, there are other key performance indicators (KPIs) that paint a fuller picture of your knowledge base’s impact on the business. Metrics like CSAT, CES, and NPS, and customer lifetime value (LTV) provide insights into how your knowledge base influences loyalty, retention, and long-term profitability – especially important in B2B settings where strong customer relationships are essential for revenue growth.
Tracking CSAT and CES Changes
You can connect knowledge base activities – like article views, search success rates, and resolution times – to CSAT and CES scores to better understand their effects.
In B2B support, CSAT is closely tied to Average Handle Time and hold times. A well-structured knowledge base enables agents to locate information faster, which makes interactions feel more efficient and professional to customers. Additionally, by helping agents resolve issues on the first attempt, a reliable knowledge base reduces the effort customers need to exert, improving CES by eliminating frustrating follow-ups.
Some AI-driven platforms, such as Supportbench, take this a step further by generating Predictive CSAT and CES scores. These scores use interaction data and knowledge base usage patterns to predict dissatisfaction before it happens. For instance, by flagging interactions that require high effort, these tools can trigger proactive retention strategies to prevent churn. Tracking metrics like "Article Usefulness Scores" (based on "Was this helpful?" feedback) also provides a granular look at satisfaction levels for individual articles, which can reveal broader sentiment trends.
"Increasing customer retention rates by just 5% can increase profits by 25% to 95%" – Bain & Company
To make meaningful comparisons, it’s helpful to measure average hold time and time-to-resolution before and after implementing your knowledge base. Breaking down CSAT data by customer type – like free versus paid accounts – can also highlight where self-service has the biggest impact on retention. Low Article Usefulness scores can point to content gaps, and addressing these issues directly reduces the effort customers need to find answers.
These satisfaction-related metrics go beyond time and cost savings, offering a window into how your knowledge base supports customer loyalty.
Linking Knowledge Base Impact to Customer LTV
The benefits of an effective knowledge base extend beyond operational efficiency. By reducing churn through improved self-service, you can directly enhance customer lifetime value (LTV) – a crucial metric in B2B environments. To calculate the impact, use this formula:
(Number of Customers) × (Estimated Churn Rate Reduction) × (Average Customer LTV).
Research shows that effective self-service platforms can boost customer retention rates by up to 31%. In B2B settings, where customer acquisition costs are high and renewals drive revenue, this kind of retention improvement can significantly impact profitability. By analyzing churn data, you can compare retention rates between customers who use the knowledge base and those who don’t, uncovering the link between self-service and loyalty.
You can also incorporate reduced churn value into your overall ROI calculations, alongside productivity and deflection savings. Platforms with 360-degree customer views, like Supportbench, make this process easier by combining performance metrics with contract renewals and product history. These tools use predictive AI to identify customers with low predicted CSAT, enabling Customer Success teams to take proactive steps to prevent churn.
In B2B, where every customer matters, these insights can make a measurable difference in maintaining long-term profitability.
Best Practices for Measuring Knowledge Base ROI
To ensure your knowledge base continues to deliver value, it’s essential to track key metrics consistently and accurately. The most effective ROI measurement strategies combine real-time data integration, regular audits, and clear benchmarks. These approaches build on earlier discussions about deflection and assisted resolution, enabling steady improvement in your knowledge base’s performance.
Setting Up AI-Powered ROI Dashboards
Modern AI-driven platforms can integrate knowledge base analytics with tools like help desks and CRMs. This setup links article engagement directly to ticket creation or deflection, offering a full view of how your content impacts customer support operations.
Your dashboard should highlight AI-specific metrics such as Containment Rate (the percentage of issues resolved by AI without human help) and Assisted Resolution (how much Average Handle Time decreases when agents use AI tools). For example, industry standards for AI containment rates in tier 1 support often range between 60% and 80%, while AI adoption can reduce Average Handle Time by 20% to 40% compared to pre-AI levels.
To quantify financial impact, automate cost calculations by multiplying saved agent hours by their hourly rates. For instance, deflecting 500 interactions at $15 each would save $7,500 a month. Many platforms also provide predictive CSAT/CES scores, helping you measure retention impacts before customer churn occurs.
Start by recording 3-6 months of baseline data for Average Handle Time, ticket volume, and CSAT. This baseline is crucial for measuring changes accurately. Additionally, track metrics like "Search Success Rate" and "Article Usefulness" to identify gaps in your content that may need updates powered by AI. These methods streamline measurement while supporting a cost-efficient, AI-enabled approach to customer support.
While dashboards simplify tracking, it’s important to avoid common mistakes that can skew ROI calculations.
Common ROI Measurement Mistakes to Avoid
A frequent mistake is assuming correlation equals causation. For example, a drop in ticket volume doesn’t necessarily mean your knowledge base is the cause. Confirm the connection by monitoring team usage, individual agent performance, and specific content metrics.
"Determining true ROI means determining causation, not correlation." – Shelf
Another error is counting every help center visit as a deflection. Instead, define "content interaction" as users who engage beyond just visiting the landing page or navigating to a ticket form. Be aware that reporting tools may vary; for example, some platforms count API-based views, while Google Analytics only tracks actual page visits, leading to discrepancies in view counts.
ROI calculations often fall short by ignoring hidden costs such as implementation fees, training, change management, and ongoing content maintenance. For a complete picture, include these expenses in your analysis. Also, don’t rely solely on numbers – quantitative data tells you what’s happening, but qualitative feedback (like user comments or ratings) explains why. Combining metrics like page views with usefulness scores provides better insights.
To ensure consistency, use a standardized deflection formula: (Total Help Center Sessions with No Ticket Submission / Total Help Center Sessions) × 100. Track failed search terms monthly to uncover content gaps and guide new article creation. Regularly flag extreme highs or lows in metrics to identify problem areas or successes.
For long-term accuracy, integrate regular reviews into your ROI strategy.
Quarterly Benchmarking and Iteration
Consistent monitoring ensures your knowledge base evolves with your business. For established knowledge bases, quarterly reviews are ideal, while newer implementations may require monthly reviews to quickly address gaps.
"Leaders fund what they can measure. If you can show reduced support costs or faster resolutions, you can secure budget for content improvements or automation." – HelpSite
Adopt a structured approach: identify outlier metrics, update targeted content, and re-measure after 1-2 months. Focus on one specific goal per quarter, like increasing deflection by 10% or improving article helpfulness scores from 75% to 85%. Quarterly content audits can help flag outdated pages, duplicate topics, or gaps revealed by "no results" search queries.
For B2B organizations, segment your analysis by customer type, such as free versus paid accounts or by product feature. This allows you to target improvements where they’ll have the most impact. Experts suggest aiming for a 20:1 ratio of knowledge base page views to support tickets, meaning fewer than 5% of visitors should need to contact an agent after viewing content.
AI-powered tools can speed up these processes dramatically, with review cycles up to 80% faster, content creation 85% faster, and quality control 90% faster. This agility ensures your knowledge base remains aligned with customer needs, driving consistent ROI over time. By following these practices, you can measure and maintain the effectiveness of your knowledge base as your business grows.
Conclusion
Tracking the ROI of a knowledge base in B2B support means looking at both ticket deflection and assisted resolution. These two metrics together reveal the full financial impact. Self-service done right can cut ticket volumes by as much as 40%. When you pair this with the average cost of a support interaction – ranging from $6 to over $20 – it’s easy to see how the savings can add up significantly each month.
Deflection directly reduces costs, but assisted resolution shows its value by improving efficiency. It shortens Average Handle Time and lets support agents focus on tasks that add more value by using the essential toolset for modern B2B support teams.
For the clearest ROI picture, combine these metrics with others like customer satisfaction (CSAT), customer effort (CES), and customer lifetime value (LTV). High deflection rates mean little if customers leave the experience frustrated or abandon your help center altogether. These additional metrics not only highlight cost reductions but also point to improved customer retention and profitability. This shift turns your knowledge base into more than just a cost-saving tool – it becomes a key asset for protecting revenue.
"Leaders fund what they can measure. If you can show reduced support costs or faster resolutions, you can secure budget for content improvements or automation." – HelpSite
To prove the impact, centralize data from your knowledge base analytics, help desk, and CRM. Show how specific content updates reduce ticket submissions and speed up resolution times. A strong benchmark for self-service success is achieving a 20:1 ratio of page views to tickets – meaning fewer than 5% of visitors need agent assistance after using your content.
Accuracy is especially crucial in B2B support. A wrong automated answer about compliance or contract terms could lead to financial losses that outweigh the benefits of ticket deflection. By taking a comprehensive approach to ROI – factoring in cost savings, productivity improvements, and customer retention – you demonstrate that your knowledge base is more than just a scalable tool. It becomes an AI-powered cornerstone of efficient, reliable B2B support. This method secures its place in modern support strategies.
FAQs
How can AI improve the effectiveness of a knowledge base in B2B support?
AI brings a lot to the table when it comes to improving a knowledge base. It can take over tasks like creating, updating, and managing content, saving time and effort. For instance, AI can analyze resolved tickets and use that information to draft new articles, cutting down on manual work while keeping the knowledge base up to date. On top of that, AI-driven search tools leverage semantic understanding to deliver precise results, making it easier for both customers and support agents to find what they need quickly.
Another standout feature is AI’s ability to spot outdated content and recommend updates in real time. This keeps the information accurate without requiring long, manual review processes. AI also tracks gaps in content and anticipates customer needs, enabling ongoing improvements. The result? Higher ticket deflection rates, quicker resolutions, and reduced operational costs. These benefits make AI a powerful tool for delivering efficient and scalable B2B support.
What hidden costs should I consider when evaluating the ROI of a knowledge base?
When evaluating the ROI of a knowledge base, it’s easy to overlook hidden costs that can significantly impact your budget. These include the initial investment in purchasing and setting up the software, along with the time and effort needed for creating content manually and keeping it updated. Without the help of AI-driven automation, staying on top of content accuracy and relevance can quickly turn into a labor-intensive and expensive task.
You also need to factor in the expense of training your team to use the platform effectively and the potential downtime during the setup process. Ignoring these considerations can result in underestimating the true costs involved in building and maintaining a successful knowledge base.
How does a knowledge base help improve customer retention in B2B support?
A well-designed knowledge base can significantly improve customer retention in B2B support by offering users quick and easy access to self-service solutions. This not only cuts down on their reliance on support teams but also ensures faster issue resolution, leading to higher satisfaction levels.
When customers can solve problems on their own, they feel more empowered and appreciated, which builds trust and loyalty. On top of that, reducing the number of support tickets saves money – resources that can be redirected toward enhancing the customer experience, making retention even stronger.