

Customer journey mapping for support is about visualizing the steps your customers go through to solve issues, from identifying a problem to resolution. Unlike marketing-focused maps, these maps focus on support-specific pain points, such as delays, handoffs, and repetitive interactions. By addressing these, companies can improve satisfaction, cut costs, and streamline processes.
Key Takeaways:
- Focus on recurring, impactful issues (e.g., billing disputes, login problems).
- Include both visible (customer-facing) and behind-the-scenes actions.
- Start small – map one scenario at a time, like account recovery or system outages.
- Use real customer data to ensure accuracy and avoid idealized versions.
- Tie improvements to measurable outcomes (e.g., reducing ticket volumes, improving CSAT).
Steps to Create a Support Journey Map:
- Pick a specific persona and scenario (e.g., "Admin locked out of account").
- Break the process into stages (e.g., discovery, self-service, contact, resolution).
- Identify customer actions, thoughts, and emotions at each stage.
- Assign team ownership for each touchpoint and document handoffs.
- Highlight problem areas and prioritize fixes based on impact and effort.
How to Facilitate a Customer Journey Mapping Workshop
When to Use Support Journey Mapping (and When Not To)
Support journey mapping isn’t a one-size-fits-all solution for every issue in customer service. It’s most effective when tackling specific, recurring problems that impact your business in a measurable way. The key is to prioritize high-impact challenges rather than trying to address every possible scenario.
Signs You Need Journey Mapping
You should consider creating a support journey map when you notice patterns that hint at deeper, systemic problems instead of isolated incidents. For instance, if you’re seeing a high number of escalations to senior teams, it’s a clear sign that something in your front-line processes isn’t working as it should. Similarly, repeated customer contacts often point to incomplete resolutions, which not only increase costs but also lead to customer frustration.
Take a closer look at your CSAT (Customer Satisfaction) or Customer Effort Score (CES) data. If certain ticket types – like billing disputes – consistently receive low scores compared to others, such as technical issues, you’ve identified a journey that needs attention. Additionally, churn risks tied to poor support experiences – like exit surveys mentioning "poor support" or "took too long to resolve" – are another strong indicator. Other warning signs include unclear ownership of specific touchpoints, high ticket volumes for common requests (e.g., password resets or cancellations), and analytics showing performance plateaus (like stagnant retention rates or underused self-service tools) without clear explanations.
These clues highlight the need for a structured approach to journey mapping. While it’s not a magical fix, formal mapping programs can dramatically reduce support costs by uncovering the actual customer experience, rather than relying solely on internal metrics and dashboards.
Mistakes to Avoid
Trying to map out every persona or every possible scenario all at once is a common misstep. This approach often results in a generic and ineffective map that provides little actionable insight.
“Maps that do not align to a business goal will not result in applicable insight”.
Instead, start small. Focus on one high-impact journey – like resolving a login issue or addressing a billing dispute – and dig deep into that flow before expanding to others.
Another frequent mistake is mapping out an idealized version of the journey rather than the real one. Teams often create polished maps that overlook real-world friction points, confusing handoffs, and dead ends. Without validating the map using real customer data – such as support transcripts, surveys, or interviews – you risk creating a “fairy tale” rather than a practical diagnostic tool.
“If you don’t conduct research and validation activities directly with the customer, you won’t have a true customer journey map”.
Don’t forget to account for internal handoffs and behind-the-scenes actions. For example, when a ticket transitions from Tier 1 to Tier 2 support or moves from Support to Engineering, customers might feel like nothing is happening because they can’t see the internal progress. These transitions are often where SLA breaches and repeat contacts occur. Lastly, avoid treating your map as a static document. Customer behaviors and product features are always evolving, and your journey map should evolve with them.
How to Build a Support Customer Journey Map
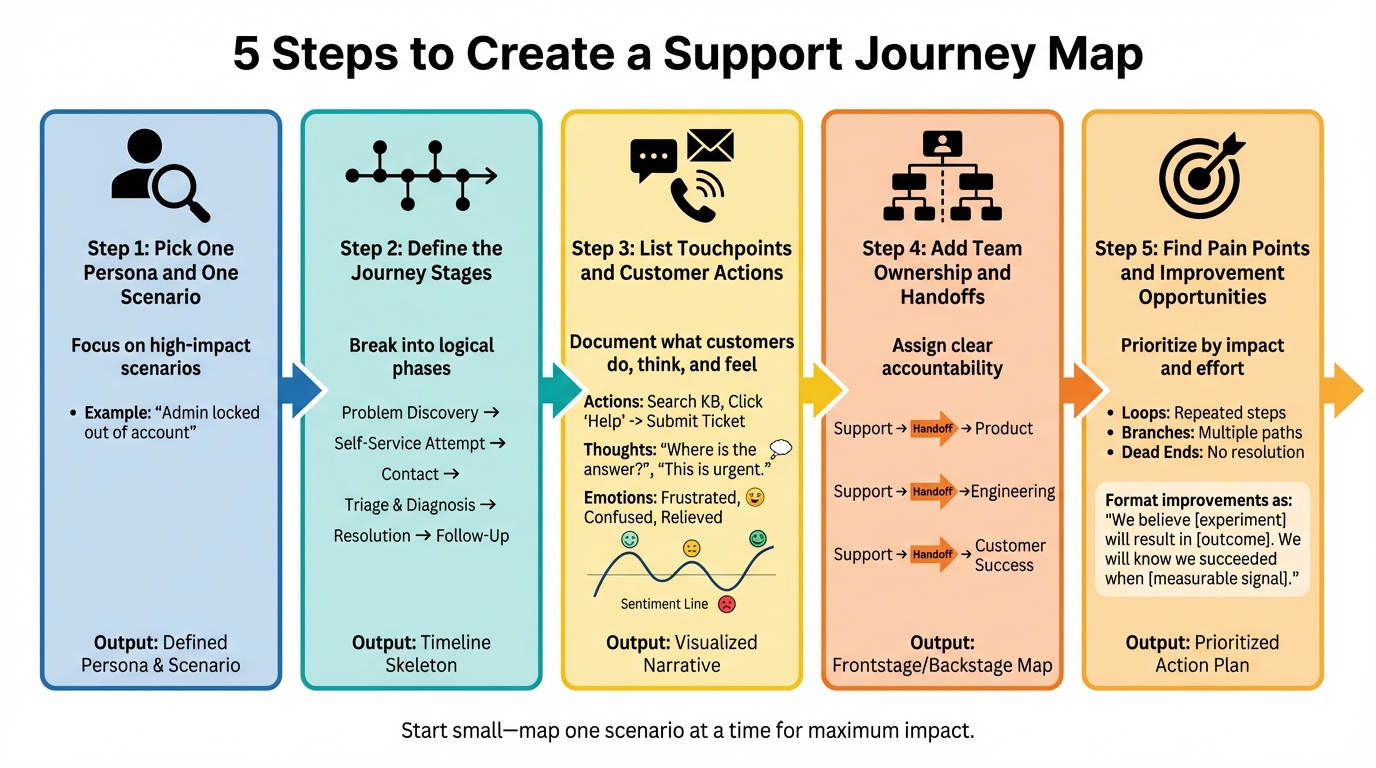
5-Step Process for Creating a Support Customer Journey Map
Creating a support customer journey map is all about identifying where processes break down. The goal? To document the current journey, including all the bumps, workarounds, and dead ends your customers face. Start with basics: grab a whiteboard and some sticky notes. Physical tools make it easier to rearrange steps and encourage real-time brainstorming with your team.
Your support agents are your secret weapon here. They know exactly where customers hit roadblocks, the questions they ask on repeat, and the "hacks" your team uses to navigate broken systems. Without their input, you risk building a polished but unrealistic version of the customer journey that overlooks the actual pain points.
"Journey mapping creates a holistic view of customer experience, and it’s this process of bringing together and visualizing disparate data points that can engage otherwise disinterested stakeholders."
- Kate Kaplan, Senior User Experience Specialist, NN/G
Before diving in, start with a hypothesis map based on existing ticket data and team interviews. This step helps you pinpoint knowledge gaps and gives you a starting framework. Then, validate your assumptions by talking to customers or analyzing transcripts. This ensures your map reflects reality.
The final product isn’t just a pretty diagram – it’s a prioritized action plan with clear ownership and measurable goals. Each improvement should be framed like this:
"We believe [experiment] will result in [outcome]. We will know we succeeded when [measurable signal]."
This forces you to define success before making any changes.
Step 1: Pick One Persona and One Scenario
Start small. Choose one persona and one specific scenario to map. Trying to cover multiple personas or every possible issue at once leads to scattered results. Focus on a high-impact scenario that’s causing measurable problems, like high escalation rates, low CSAT scores, or recurring customer frustrations.
For instance, instead of tackling vague "login issues", zero in on something like "Admin user locked out of their account." Other common scenarios worth mapping include cancellation processes, bug reporting, billing disputes, or access issues.
Define the goal for the chosen persona in this scenario. What does success look like for them? For a locked-out admin, success might mean quickly regaining access without multiple support contacts or tedious manual checks. This goal becomes your guiding light as you identify friction points.
Pull ticket data to confirm the scenario’s importance. Look for patterns in resolution times, transfer rates, and customer sentiment. If the same issues pop up repeatedly, you’ve found a journey worth mapping.
Once you’ve nailed down the scenario, break it into clear stages.
Step 2: Define the Journey Stages
Divide the journey into logical steps, starting from the moment the problem arises to its resolution and any follow-up. Keep the stages simple, so each segment can be analyzed without getting bogged down in unnecessary details.
For most support journeys, the stages might look like this:
- Problem Discovery: The customer realizes something is wrong.
- Self-Service Attempt: They try to fix it themselves.
- Contact: They reach out to support.
- Triage and Diagnosis: Support investigates the issue.
- Resolution: The problem is resolved.
- Follow-Up: Feedback is collected, and the resolution is confirmed.
These stages form the backbone of your map. While you might refine them later, capturing the full experience – including often-overlooked steps like self-service attempts – is essential.
Step 3: List Touchpoints and Customer Actions
For each stage, list every interaction between the customer and your brand. These touchpoints could include help center searches, live chat, automated emails, phone calls, status pages, or in-app messages.
For each touchpoint, document three key details:
- What the customer does: Actions like clicking "Forgot Password."
- What they’re thinking: Questions such as "Will this reset my settings?"
- How they’re feeling: Emotions ranging from frustration to relief.
Use different colored sticky notes for these layers. To visualize emotional highs and lows, draw a sentiment line below the stages. Sudden drops in sentiment often highlight where expectations clash with reality.
"A pain point early in the journey might also result in negative feelings later on, as experiences accumulate."
Be sure to distinguish between visible (on-stage) and behind-the-scenes (off-stage) actions. This helps expose transparency gaps. Once you’ve mapped customer actions and thoughts, identify internal responsibilities.
Step 4: Add Team Ownership and Handoffs
Assign clear ownership to each touchpoint by identifying which team manages it – whether that’s Support, Product, Engineering, or Customer Success. Accountability ensures that when you spot areas for improvement, you know exactly who should act.
Pay special attention to handoffs between teams. These transitions are often where things go wrong – like SLA breaches or customers needing to repeat themselves. Document handoff details, including transfer information, duration, and status updates.
To make this visually clear, use swimlanes. Create horizontal rows for each department and place their actions in the relevant lane. This format makes it easy to spot when a journey has too many handoffs or unclear responsibilities.
Step 5: Find Pain Points and Improvement Opportunities
With your journey map in hand, focus on the touchpoints that have the biggest impact – whether they’re causing the most frustration or generating the highest volume of issues. Look for patterns like:
- Loops: Where customers have to repeat steps, like re-explaining their issue to multiple agents.
- Branches: Where the process gets unnecessarily complicated, such as requiring manual steps when automation could work.
- Dead Ends: Where customers hit a wall with no clear next step.
Prioritize these pain points based on their impact and the effort needed to fix them. Use data like ticket volumes, CSAT scores, and resolution times to guide your decisions. Then, turn each pain point into a testable hypothesis. For example:
"We believe that [experiment] will result in [outcome]. We will know we succeeded when [measurable signal]."
Finally, assign owners and deadlines to each improvement. Without accountability, your map risks becoming a static document instead of a tool for driving change.
Here’s a summary of your journey mapping process:
| Stage | Key Output | Description |
|---|---|---|
| 1. Scope | Defined Persona & Scenario | A specific "actor" and a sequence of events (e.g., "Admin locked out"). |
| 2. Phases | Timeline Skeleton | The journey divided into logical stages from start to finish. |
| 3. Actions | Visualized Narrative | A map capturing customer actions, thoughts, and emotional sentiment. |
| 4. Ownership | Frontstage/Backstage Map | Clear separation between what the customer sees and internal team responsibilities. |
| 5. Insights | Prioritized Action Plan | A list of pain points paired with measurable hypotheses and clear next steps for improvement. |
sbb-itb-e60d259
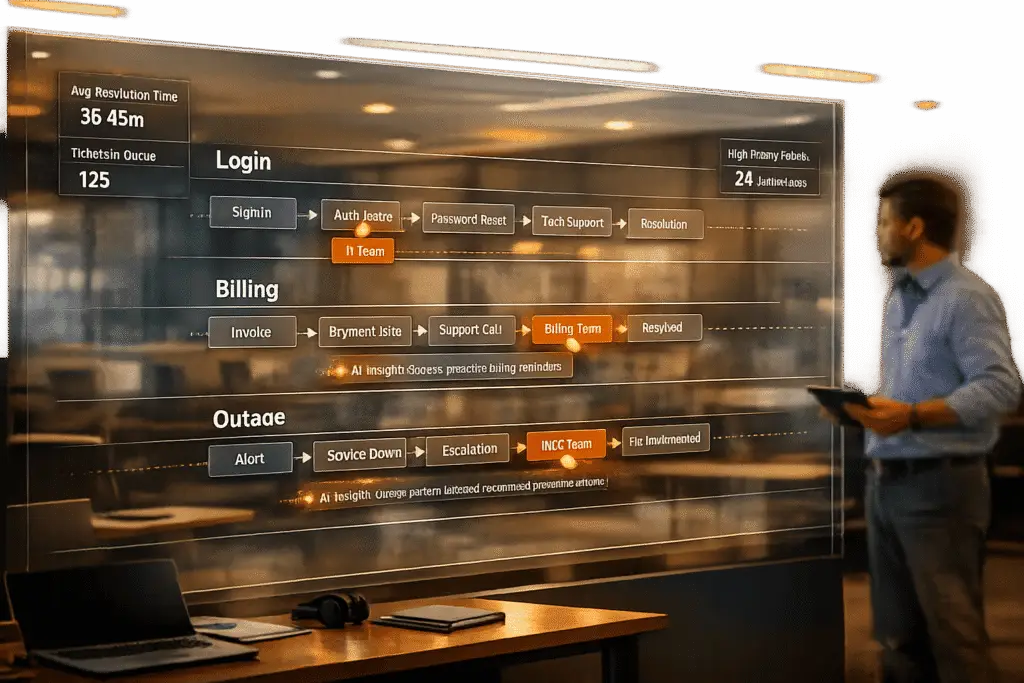
3 Support Journey Map Examples
These three examples highlight how mapping customer support journeys can uncover key pain points and lead to actionable solutions. Each scenario provides a snapshot of common challenges and demonstrates how targeted improvements can make a real difference.
Example 1: Login or Access Issue
Scenario: An admin user gets locked out of their account after multiple failed login attempts.
This scenario emphasizes the importance of pinpointing specific pain points in the support journey. The process typically unfolds in six stages: discovering the issue, attempting a password reset, contacting support when the reset email doesn’t arrive, account verification by an agent, regaining access, and completing a follow-up survey. Common touchpoints include the login screen, "Forgot Password" link, automated reset emails, help center articles, support forms, and live chat windows.
Key pain points arise during self-service and initial contact. Reset emails often fail to arrive or land in spam, and help articles may be outdated. When users finally reach support, they may face long wait times – sometimes exceeding six hours for email responses – and are often asked to repeat information they’ve already provided. Behind the scenes, support agents manually verify account details and unlock accounts, but this process remains invisible to the user, adding to their frustration.
Potential improvements include:
| Improvement | Impact | Effort | Measurable Signal |
|---|---|---|---|
| Add real-time status updates to password reset emails (e.g., "Your reset link was sent at 2:14 PM EST and expires in 15 minutes") | High | Low | 30% reduction in "didn’t receive email" tickets |
| Update help center articles with accurate screenshots and test reset flows monthly | High | Medium | 20% increase in self-service resolution rate |
| Pre-fill agent chat with user-provided form data to avoid repeated questions | High | Medium | 15-point CSAT improvement on access issues |
| Automate account unlocks for common scenarios (e.g., three failed attempts within 10 minutes) | Medium | High | 40% drop in manual unlock requests |
Next, let’s look at how billing disputes present unique challenges.
Example 2: Billing or Invoice Dispute
Scenario: A customer disputes an unexpected charge on their monthly invoice.
This journey begins with the customer noticing an incorrect charge, reviewing billing details, contacting support, providing transaction information, waiting for a Finance review, and finally receiving resolution confirmation. Key touchpoints include the billing dashboard, invoice PDFs, help center articles, support tickets, and email exchanges with both Support and Finance teams.
The biggest friction occurs during transitions between Support and Finance. Customers often have to re-explain their issue after being transferred, as disconnected systems prevent Finance from accessing support notes. This leads to conflicting refund timelines – one agent may promise two business days, while another cites five to seven. The gap between customer expectations (an immediate refund) and the actual process (a multi-day wait) compounds frustration.
"A journey map… exposes the critical gaps between what customers are expecting and what your company is delivering to them so that you can prioritize improvements and intentionally design better experiences."
- Matt Lombardi, Global Head of Customer Experience Strategy, ServiceNow
Potential improvements include:
| Improvement | Impact | Effort | Measurable Signal |
|---|---|---|---|
| Create a unified billing view accessible to both Support and Finance teams | High | High | 50% reduction in "please re-explain" complaints |
| Add automated refund status tracking visible to customers (e.g., "Refund approved 1/28/26, processing, expected 2/2/26") | High | Medium | 35% drop in "where’s my refund" follow-ups |
| Route billing disputes directly to Finance-trained agents, skipping initial Support triage | Medium | Low | 2-day reduction in resolution time |
| Standardize refund timeline communication across all agents (e.g., consistently stating "3–5 business days") | Medium | Low | 20-point CSAT improvement on billing issues |
| Test one complete billing cycle before assessing impact | Low | Low | Accurate month-over-month ticket comparison |
Now let’s examine how production outages demand immediate attention and transparency.
Example 3: Production Bug or System Outage
Scenario: A customer’s production environment goes down due to a system bug, blocking access to critical features.
This journey is fast-paced, involving outage discovery, status page checks, urgent ticket submissions, error log sharing, Engineering escalation, periodic updates, fix deployment, resolution confirmation, and a post-incident survey. Key touchpoints include error messages, the status page, the ticket portal, email updates, phone escalations, internal Engineering tools (e.g., Slack), and deployment notifications.
Critical pain points stem from transparency gaps. Customers often wait over 15 minutes for acknowledgment of high-priority tickets, leaving them uncertain if their issue has been noticed. Automated systems may request information already provided, forcing customers to repeat themselves during a stressful outage. Internally, Support escalates the issue to Engineering, but customers remain unaware of these efforts and may assume no action is being taken. When the issue is resolved, generic resolution emails fail to confirm whether the fix has been applied to their specific environment.
Potential improvements include:
| Improvement | Impact | Effort | Measurable Signal |
|---|---|---|---|
| Send auto-acknowledgments within 60 seconds for severity-1 tickets, including estimated response time | High | Low | 40% reduction in duplicate "Did you see my ticket?" inquiries |
| Provide proactive status page updates every 30 minutes during outages | High | Medium | 50% drop in "What’s happening?" calls |
| Establish a fast-track protocol where severity-1 tickets immediately alert Engineering | High | Medium | 20-minute reduction in time-to-engineer response |
| Pre-fill escalation forms with data from the initial ticket to avoid repeated questions | Medium | Low | 25-point CSAT improvement on critical issues |
| Include environment-specific resolution confirmations (e.g., "Fix confirmed live in your production environment as of 3:47 PM EST") | Medium | Medium | 30% drop in "Is it really fixed?" follow-ups |
Companies that adopt journey mapping as a formal process often see dramatic improvements in customer service efficiency, making these efforts a smart investment. These examples lay the groundwork for connecting measurable outcomes to your journey map, which will be explored in the next section.
How to Connect Metrics to Your Journey Map
A journey map becomes far more impactful when paired with specific support KPIs. By linking observations to measurable outcomes, you can turn your map into a powerful tool for driving change and making a solid business case to leadership.
Which Metrics to Track
Each stage of the customer journey calls for its own set of metrics. Here’s how you can align key performance indicators (KPIs) to different phases of the journey:
For self-service, monitor the search-to-ticket ratio – how often customers find answers through your help center versus submitting support tickets. A high ratio suggests that your documentation is effective, while a nearly one-to-one ratio signals that your knowledge base may need significant updates.
At the initial contact stage, First Contact Resolution (FCR) is critical. It tells you how often your team resolves issues on the first attempt. Combine this with channel preference data. If simple inquiries, like password resets, are coming through phone calls instead of self-service options, it points to friction in your digital support channels.
During troubleshooting, focus on Time to Resolution and Customer Effort Score (CES). Long resolution times often reveal inefficiencies, like excessive handoffs between teams. A high CES indicates customers are putting in too much effort to solve their problems, which can lead to dissatisfaction.
In the post-resolution stage, track reopen rates and CSAT (Customer Satisfaction Score). High reopen rates suggest that tickets marked as "resolved" aren’t actually fixing the root issue, leading to frustrating loops for customers.
To measure long-term impact, look at churn rate, Net Promoter Score (NPS), and renewal rates. These metrics help you understand how support interactions influence customer loyalty and retention.
| Journey Stage | Key Metric | What It Reveals |
|---|---|---|
| Self-Service / Discovery | Search-to-Ticket Ratio | Effectiveness of documentation in deflecting tickets |
| Initial Contact | First Contact Resolution (FCR) | Success in resolving issues on the first attempt |
| Troubleshooting | Time to Resolution | Delays caused by internal processes or handoffs |
| Resolution | Customer Effort Score (CES) | The effort customers need to resolve their issues |
| Post-Resolution | Reopen Rate | Whether resolved tickets truly address customer needs |
| Long-Term Relationship | Churn Rate / NPS | Impact of support quality on retention and loyalty |
Each of these metrics ties directly to a specific stage, providing actionable insights to improve your customer journey.
Using Metrics to Make Your Business Case
Once you’ve identified the right metrics, use them to advocate for meaningful operational changes. Support leaders need concrete data to justify updates, and journey maps with metrics highlight exactly where improvements can drive results. Take a hypothesis-driven approach: for example, "We believe adding real-time status updates to password reset emails will reduce follow-up tickets within one billing cycle." This makes your proposal measurable and easy to test.
Focus on the "Moments that Matter" – those high-stakes touchpoints that carry the most emotional weight for customers. For instance, during a production outage, a long wait for acknowledgment can create significant stress. Reducing that wait time can dramatically improve how customers perceive your support team. A great example is T-Mobile’s 2012 journey overhaul, where CEO Mike Sievert introduced the "Team of Experts" model to address specific pain points, resulting in improved retention.
It’s also important to distinguish between on-stage (customer-facing) and off-stage (internal) metrics. For example, if Time to Resolution is high but First Response Time is low, the problem likely lies in internal workflows rather than customer interactions. Tracking off-stage metrics helps you identify hidden bottlenecks that might otherwise go unnoticed.
When implementing changes, start small. Test new protocols with a limited group and measure their impact on metrics like CSAT and time-to-engineer response over a set period. This data-driven approach minimizes risk and builds confidence before scaling improvements. Assigning clear metrics ensures that your journey map isn’t just a static document but an actionable tool for ongoing progress.
Finally, assign ownership of each metric to ensure accountability. For instance, if the Product team is responsible for the search-to-ticket ratio, they must keep the knowledge base updated. If Support owns FCR, they need to equip agents with the tools and training to resolve issues efficiently. Clear accountability turns your journey map into a dynamic framework for continuous improvement.
Conclusion: Why Customer Journey Mapping for Support Works
Customer journey mapping for support works because it transforms customer frustrations into clear, solvable issues. By visualizing the entire support experience – from the moment a customer encounters a problem to the follow-up after resolution – you can pinpoint areas of friction that often go unnoticed in ticket queues or dashboards. According to McKinsey, improving customer journeys can increase satisfaction by 20%, boost revenue by 15%, and cut service costs by up to 20%.
The real advantage lies in teamwork. Journey mapping breaks down barriers between teams like Support, Product, Engineering, and Customer Success, offering everyone a unified view of the customer experience. Sharing these maps across departments encourages accountability and smoother handoffs. Companies that use formal journey mapping techniques report 54% higher returns on investment and see 56% more revenue from cross-selling and up-selling opportunities.
To make the most of these benefits, start small and focus on one specific customer journey. For instance, tackle a common issue like password resets or billing disputes. Involve frontline agents who have firsthand knowledge of where customers tend to get stuck. As Atlassian wisely puts it:
"Don’t let perfect be the enemy of good! Sometimes a team just needs to get started, and you can agree to revisit with more rigor in a few months’ time".
This approach ties back to the step-by-step strategies discussed earlier.
FAQs
How can I choose the best scenario for creating a customer journey map in support?
When mapping customer journeys in support, it’s smart to focus on areas where customers often run into problems or where the support experience heavily influences their satisfaction and loyalty. Think about scenarios like recurring login issues, disputes over billing, or handling critical outages. These situations tend to reveal major pain points and areas where support can improve.
To get started, pick a specific customer persona and focus on a single support scenario. This approach keeps the process manageable and ensures actionable results. Trying to cover every interaction or persona at once can spread your efforts too thin. Instead, prioritize scenarios that are both common enough to provide valuable insights and specific enough to lead to real changes. By narrowing your focus, you can zero in on the most important touchpoints and make meaningful improvements that truly enhance your customers’ experience.
What are the key metrics to track the success of a support journey map?
To gauge how well your support journey map is working, focus on metrics that reflect key stages and interactions in the customer support process. Here are some important ones to track:
- First Contact Resolution (FCR): Measures how often issues are solved during the first interaction with support.
- Reopen Rate: Indicates whether customers need to reach out again about unresolved problems.
- Time to First Response: Tracks how quickly your team acknowledges a customer inquiry.
- Time to Resolution: Looks at the total time it takes to fully resolve an issue.
- Escalation Rate: Shows how frequently problems are escalated to higher support levels.
- CSAT/CES: Evaluates customer satisfaction and effort during the support experience.
- Deflection Rate: Examines how well self-service tools, like FAQs or knowledge bases, help customers without needing direct support.
- Backlog Aging: Monitors how long unresolved tickets stay open in your system.
Each of these metrics sheds light on different parts of the customer journey, helping you pinpoint areas that need improvement and monitor the results of any changes you implement.
How can I make sure my support journey map reflects real customer experiences?
To build a support journey map that genuinely captures customer experiences, start by diving into the data. Review recent support tickets, chat or call transcripts, and customer feedback to identify recurring pain points, common questions, and the emotions customers experience along the way. For a deeper understanding, consider conducting customer interviews or surveys to reveal hidden needs or frustrations that might not surface in other data.
Don’t stop there – bring in your frontline support agents, managers, and even other teams involved in the customer journey. These individuals have invaluable insights into workflows, frequent escalations, and issues that customers may not openly discuss. Their input will not only validate your map but also highlight areas of friction you might otherwise miss. And remember, keeping the map up-to-date with fresh data ensures it evolves alongside changing customer behaviors and support trends.
By basing your journey map on actual interactions, you’ll uncover practical ways to enhance the support experience and tackle critical pain points head-on.