Support and success teams often work in silos, but customers expect a unified experience. By aligning on shared KPIs, companies can improve customer outcomes, reduce churn, and boost satisfaction.
Here’s why shared metrics matter:
- Customers see one company, not separate teams. Misalignment creates gaps, like unresolved issues or missed churn signals.
- Companies using shared KPIs report:
- 25-30% faster issue resolution
- 15-20% higher satisfaction scores
- 10-15% better retention rates
Key shared metrics include:
- Customer Retention Rate: Tracks long-term loyalty. Collaboration identifies at-risk accounts early.
- Net Promoter Score (NPS): Reflects overall customer perception from all interactions.
- First Contact Resolution (FCR): Measures efficiency. Higher rates reduce churn.
- Time-to-Value: Tracks how quickly customers achieve results post-purchase.
- Churn Rate: Combines support insights with success strategies to prevent cancellations.
How to implement shared KPIs:
- Define Ownership: Align metrics with company goals and assign responsibilities.
- Use Transparent Reporting: Real-time dashboards ensure visibility and quick action.
- Build Feedback Loops: Regularly refine processes using KPI insights.
AI tools simplify this process by automating tracking, offering predictive analytics, and providing actionable dashboards. Start by focusing on 1-2 metrics, automate tracking, and use real-time data to guide decisions. The payoff? Lower churn, happier customers, and stronger retention.
The Top 10 KPIs for Customer Service in 2025
sbb-itb-e60d259
Core Shared Metrics for Support and Success Teams
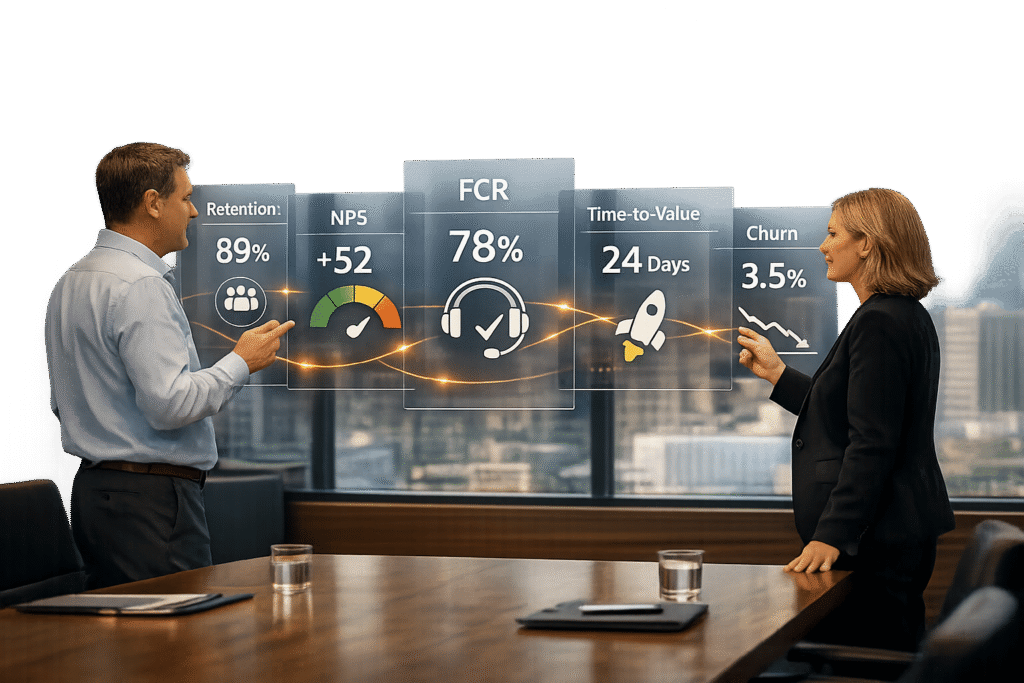
5 Shared KPIs for Support and Success Teams: Metrics, Focus Areas, and Benchmarks
Shared KPIs are the glue that binds support and success teams, aligning their efforts toward a shared mission: delivering an outstanding customer experience. Let’s break down key metrics and how they impact both teams.
Customer Retention Rate
Retention rate tracks how many customers stick with your business over a certain timeframe. For support teams, it’s about more than resolving tickets – it’s about preventing churn. Every interaction with a frustrated customer is a chance to influence their decision to renew [3].
Success teams already focus on retention as part of their core responsibilities. However, support data fills in the gaps. A customer may appear to be thriving during quarterly reviews, but unresolved technical issues flagged by support could tell a different story. Companies that effectively integrate support data into their retention strategies report a 42% higher retention rate and a threefold return on their support investment [4].
By monitoring retention together, support can identify high-friction accounts and success can act before renewal dates. This collaboration shifts retention from being a success-only concern to a company-wide effort.
Net Promoter Score (NPS)
NPS gauges long-term loyalty by asking a simple question: “How likely are you to recommend us to a colleague?” Unlike metrics that focus on individual interactions, NPS reflects the combined impact of every touchpoint, from support resolutions to success-driven guidance [3].
"Metrics aren’t just performance indicators – they’re opportunities to fine-tune strategy, train smarter, and align cross-functional teams." – PartnerHero [3]
Support plays a pivotal role here. A single frustrating interaction can turn a promoter into a detractor, no matter how strong the relationship built by the success team. Success teams, on the other hand, influence NPS through strategic planning and relationship building. In B2B SaaS, the average NPS is around 40, but aligned teams can achieve scores of 50-70 [5].
When both teams track NPS together, it fosters accountability and ensures that low scores trigger immediate collaboration to resolve underlying issues. This metric highlights how every interaction shapes the customer’s overall perception.
First Contact Resolution (FCR)
FCR measures the percentage of issues resolved during the first interaction, without requiring follow-ups. For support teams, it’s an indicator of efficiency and product expertise. The benchmark for excellent FCR is 70-80%, and every 1% improvement reduces costs and boosts satisfaction by 1% [5].
For success teams, FCR reveals deeper issues like inadequate onboarding or product friction. If customers repeatedly contact support about the same problems, it’s a sign that initial training or documentation needs improvement.
By analyzing FCR trends, teams can identify gaps and take action. For instance, if FCR dips for a specific feature, success teams can update onboarding materials or provide additional training. Higher FCR rates can reduce churn by up to 67% [5].
Time-to-Value
Time-to-value measures how quickly customers achieve their desired outcomes after purchase. It’s a critical metric that ties together the efforts of both support and success teams, especially during onboarding. The faster customers see results, the less likely they are to churn early.
Support ensures technical issues don’t delay progress, while success teams set milestones and secure early wins. With machine learning tools, businesses can now predict churn risks up to 60 days in advance [4]. Tracking time-to-value together allows teams to coordinate efforts, accelerate results, and address risks before they escalate.
Churn Rate
Churn rate reflects the percentage of customers who cancel or choose not to renew. While success teams traditionally own this metric, support often serves as the final safeguard against churn [3]. Frequent support interactions can signal dissatisfaction and potential churn.
Companies with top-tier support see 40-60% lower churn rates, proving that support is more than just a cost center – it’s a growth driver [5]. Collaboration between support and success is key. Support can flag at-risk accounts, while success teams use that data to take proactive, relationship-focused steps.
High-effort customer experiences drive 96% of customers toward disloyalty, while low-effort experiences increase loyalty for 94% [5]. By sharing churn data and working together on prevention strategies, both teams contribute to long-term retention.
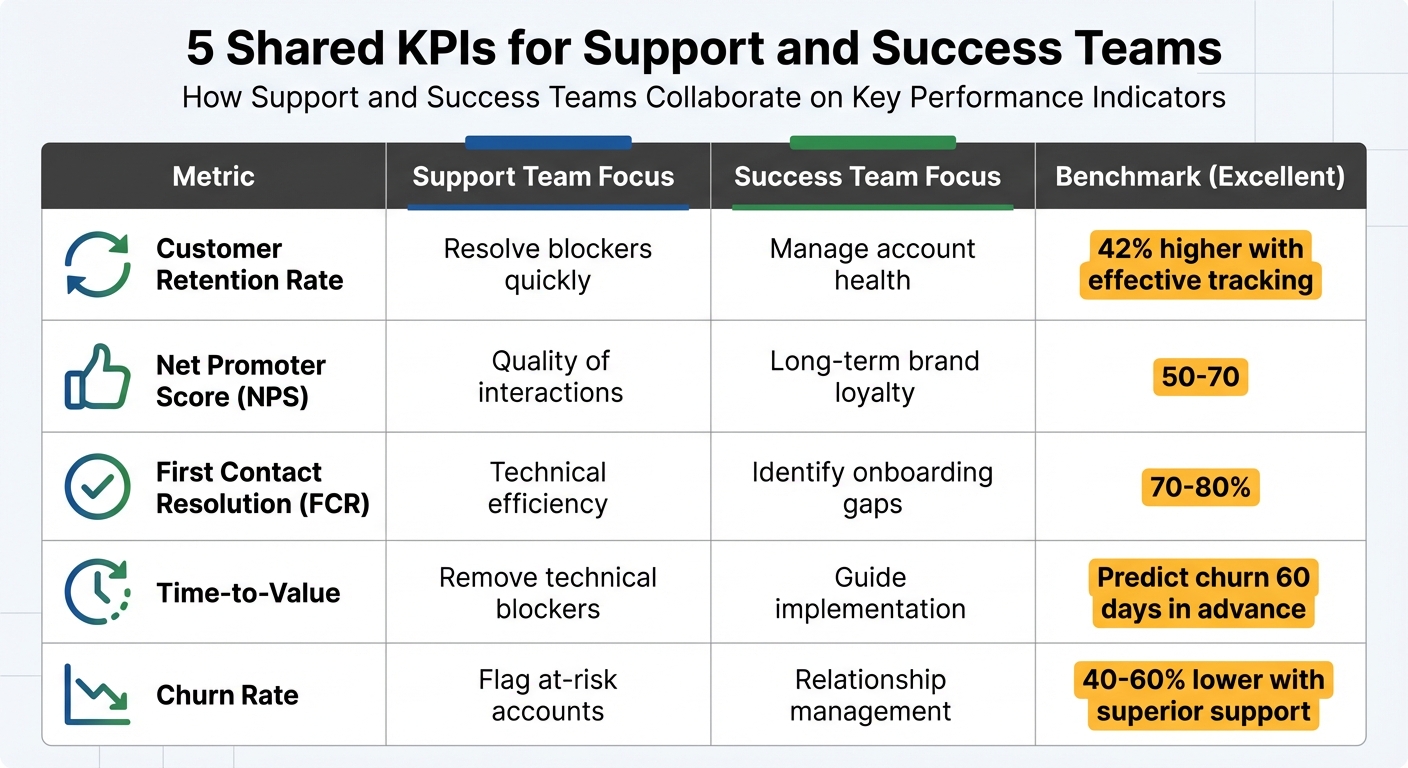
| Metric | Support Team Focus | Success Team Focus | Benchmark (Excellent) |
|---|---|---|---|
| Customer Retention Rate | Resolve blockers quickly | Manage account health | 42% higher with effective tracking [4] |
| Net Promoter Score (NPS) | Quality of interactions | Long-term brand loyalty | 50-70 [5] |
| First Contact Resolution | Technical efficiency | Identify onboarding gaps | 70-80% [5] |
| Time-to-Value | Remove technical blockers | Guide implementation | Predict churn 60 days in advance [4] |
| Churn Rate | Flag at-risk accounts | Relationship management | 40-60% lower with superior support [5] |
How to Implement Shared KPIs
Putting shared KPIs into action is where the real work begins. They’re essential for breaking down silos and aligning teams toward shared customer outcomes, especially in AI-driven, cost-conscious B2B support environments.
Define Clear Ownership and Measurement Methods
Start by organizing shared KPIs into three categories: Customer Satisfaction, Operational Efficiency, and Business Value [6]. This structure ensures that every KPI connects to meaningful goals, avoiding the trap of chasing irrelevant metrics.
Work with senior stakeholders and engineers to set benchmarks that are both realistic and measurable [6]. For example, when measuring First Contact Resolution (FCR), ensure all teams agree on a consistent definition.
Distinguish between AI performance and human-driven results to get clear operational insights [2]. For instance, in 2026, AI is expected to handle 27% of cases, with that number projected to rise to 50% by 2027 [2]. Tracking these separately provides a clearer picture of how each contributes to the customer journey.
Segment KPIs by customer tier to align support efforts with account priorities. For example, Strategic, Enterprise, and Commercial accounts should have distinct targets [2]. This ensures that a $500,000-per-year account doesn’t get the same treatment as a $10,000-per-year account.
Once ownership is clear, the next step is to ensure transparent reporting to keep everyone aligned.
Create Transparent Reporting Structures
With ownership in place, transparent dashboards become key. Replace outdated weekly reports with real-time dashboards that update instantly as events unfold [1]. Think of these as "flight deck" systems that provide early warnings for issues like SLA risks or backlog spikes, enabling teams to act before problems escalate.
Standardize data across all channels – email, chat, voice, and self-service – so performance comparisons are consistent throughout the customer journey [1]. For example, if the chat team achieves a 95% FCR rate while the email team lags at 60%, channel-specific reporting will highlight these gaps, helping you optimize resource allocation.
Keep reporting focused by tracking 5–7 key metrics tied to your main goals, such as growth or cost reduction, while monitoring an additional 8–12 secondary metrics on a quarterly basis [5]. This ensures you don’t overlook areas where speed might come at the expense of quality. For instance, prioritize metrics like First Response Time and FCR, but keep an eye on secondary indicators like reopen rates or escalation frequency.
When evaluating performance, use percentiles in addition to averages [2]. Averages can hide systemic issues. For example, if the average resolution time is 4 hours, but 20% of tickets take over 24 hours, focusing solely on the average misses critical details.
Build Feedback Loops for Continuous Improvement
Adopt a weighted KPI model that emphasizes the most critical metrics [6]. For instance, you could assign weights like 25% to Speed & Reliability, 25% to Resolution Quality, 20% to Workload Sustainability, 20% to Risk & Retention, and 10% to Learning Loops [2]. This creates a Support Health Index that you can benchmark monthly against your own goals and industry standards.
Automate alerts for SLA breaches to reduce manual oversight [1]. For example, if a Strategic account has been waiting for 9 minutes and your SLA is 10 minutes, the system should automatically escalate the ticket to a senior agent.
Use KPI data for daily stand-ups and live coaching sessions, rather than waiting for quarterly reviews [1]. When a metric shifts – like a sudden spike in backlog – assign a clear owner and action plan to address it. Establish "Learning Loops" to measure the time it takes to resolve recurring issues, whether through documentation or product fixes [2]. This approach helps reduce future ticket volume, not just address current issues.
Finally, close the loop on low customer satisfaction (CSAT) or Customer Effort Scores by identifying root causes and preventing recurrence [3][5]. High-effort support experiences drive disloyalty in 96% of customers, compared to just 6% for low-effort experiences [5]. Every low score is an opportunity to act swiftly and prevent churn.
Using AI to Improve KPI Tracking and Analysis
AI-native platforms take the hassle out of manual KPI tracking, allowing teams to focus on improving the customer experience. By integrating AI-driven analytics with shared metrics, support and success teams can spend less time on administrative work and more time making meaningful changes.
Automate KPI Calculations and Reporting
AI platforms handle complex metric calculations automatically. Key performance indicators like First Contact Resolution (FCR), Customer Satisfaction (CSAT), and churn predictions are updated in real time [1]. For instance, AI can analyze case histories to determine if an issue was resolved on the first attempt, solving a long-standing challenge in accurately measuring FCR.
These systems also monitor ticket analytics to spot trends like backlog increases, escalation spikes, or resolution delays. If escalation rates exceed the ideal benchmark of 5%, managers are alerted immediately – giving them a chance to address the issue before it spirals out of control. This proactive approach is far more effective than relying on static reports weeks after the fact [1].
AI ensures consistency across all communication channels – email, chat, voice, and self-service – offering a unified performance view. For example, you could compare a 95% FCR rate on chat with a 60% rate on email to identify areas needing improvement. With industry FCR benchmarks typically between 70% and 79% [1], this type of detailed insight is invaluable for optimizing customer interactions.
Once these metrics are automated, AI takes it a step further by offering advanced insights through predictive analytics.
Improve Data Accuracy with Predictive Analytics
AI doesn’t just automate processes – it makes them smarter. Predictive analytics shift support operations from reactive to proactive. Instead of waiting for customers to voice complaints, AI identifies warning signs early. For example, it can flag at-risk accounts by analyzing behavioral patterns like reduced product usage alongside emotional cues in conversation transcripts [2][7]. If a high-value account shows declining engagement and recent interactions reveal frustration, the system alerts the success team to intervene before renewal deadlines.
The results are impressive. Predictive service programs can cut Average Handle Time (AHT) by 23% and reduce Service Level Agreement (SLA) breaches by 42% [7]. At the same time, customer satisfaction scores can rise by 10 points, while churn rates drop by 15% [7]. AI-driven sentiment analysis also tracks customer emotions in real time, identifying frustration or dissatisfaction that could lead to churn. This matters because 90% of customers now expect an "immediate" response, with 60% defining "immediate" as within 10 minutes [2].
Predictive models also help managers prepare for future demand. By examining historical ticket volumes and external factors like billing cycles or product launches, AI can forecast surges weeks in advance. This foresight allows teams to adjust staffing levels ahead of time, avoiding last-minute scrambles [7].
The insights from predictive analytics are seamlessly integrated into AI-powered dashboards, offering real-time intelligence that teams can act on immediately.
Use AI-Powered Dashboards for Real-Time Insights
AI-powered dashboards replace outdated weekly reports with live, actionable data. As Eric Klimuk, Founder and CTO of Supportbench, explains:
"The best metrics don’t just track history – they change what happens next" [1].
These dashboards highlight anomalies, escalation spikes, and potential SLA breaches as they occur, empowering teams to address issues before they escalate further.
By consolidating data from every customer touchpoint, dashboards provide a comprehensive view of performance across all channels. For instance, if resolving an email inquiry takes 24 hours – the industry average for email – while a chat inquiry is resolved in 10 minutes, the dashboard brings this disparity to light. This makes it easier to pinpoint areas that need improvement [1].
Dashboards also monitor customer sentiment in real time, catching frustration patterns or churn signals that traditional surveys might miss. For example, if a customer mentions cancellation or downgrading in a conversation, the system alerts the success team to take immediate action. This proactive approach is especially critical in B2B settings, where losing a single strategic account can have a major financial impact.
To maximize their value, dashboards must align with strategic objectives. As Klimuk notes:
"If your dashboard isn’t aligned with OKRs, it’s just noise" [1].
Conclusion
Bringing support and success teams together through shared KPIs fosters collaboration and ensures both groups work toward unified goals. By focusing on key metrics, businesses can transform their support functions from a cost center into a growth driver that boosts revenue and builds customer loyalty [1][3].
AI-powered platforms make this alignment easier than ever. With automated KPI tracking, predictive analytics, and real-time dashboards, teams can skip tedious manual reporting and focus on actionable insights. This shift not only saves time but also delivers measurable returns – organizations see an average of $3.50 for every $1 invested in these technologies [5]. Teams can then concentrate on proactive strategies, like addressing early signs of churn or simplifying customer interactions.
These insights also play a critical role in continuous improvement. The most effective B2B companies in 2026 won’t just track performance – they’ll use shared metrics to create ongoing feedback loops. For example, when support teams identify a recurring issue or a product pain point, that information can flow seamlessly to success and product teams. This collaboration prevents future issues, reduces customer churn, and minimizes support tickets. It’s this kind of proactive feedback cycle that sets high-performing companies apart from those stuck in outdated, reactive models [2].
Eric Klimuk, Founder and CTO of Supportbench, puts it best:
"If you’re only tracking how many tickets your team closed last week, you’re flying blind." [1]
To get started, focus on a small set of metrics tied to strategic outcomes – like reducing churn, improving agent retention, or cutting costs per ticket. Equip both teams with the tools and visibility they need to act on these metrics. This approach ensures immediate, impactful results.
Start simple: pick one or two shared KPIs, automate their tracking with AI, and use real-time reporting to guide decisions. The payoff? Lower churn, stronger retention, and deeper customer connections.
FAQs
How do we define shared KPI ownership between support and success?
Shared KPI ownership brings support and customer success teams together by focusing on shared metrics tied to customer outcomes – such as retention rates, reduced churn, and time-to-value. For this to work, clear communication, consistent measurement methods, and transparency are essential. While support teams might prioritize metrics like first contact resolution, customer success teams often concentrate on renewal rates. By working collaboratively and holding each other accountable, these teams can boost customer satisfaction, encourage loyalty, and contribute to overall business growth.
What’s the best way to measure time-to-value in B2B SaaS?
To gauge time-to-value in B2B SaaS, start by pinpointing your product’s "value moment" – the point when customers first experience a real benefit. This could be achieving a critical business goal or unlocking the core functionality of your product. Measure the time it takes from their initial sign-up or interaction to reaching this milestone. By doing so, you can evaluate how well your onboarding process and customer success efforts are driving quick, impactful results.
How can AI flag churn risk before a renewal is at risk?
AI can spot churn risks well in advance by examining key customer data like product usage patterns, support interactions, sentiment analysis, and engagement trends. By using this information, it creates dynamic customer health scores that can forecast churn 60–90 days before a renewal. This gives teams the chance to act early and address potential issues.