What’s the best way to keep your B2B customers loyal? Make their experience easier.
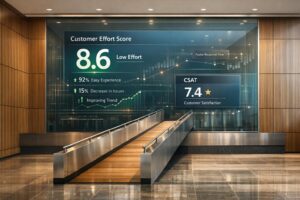
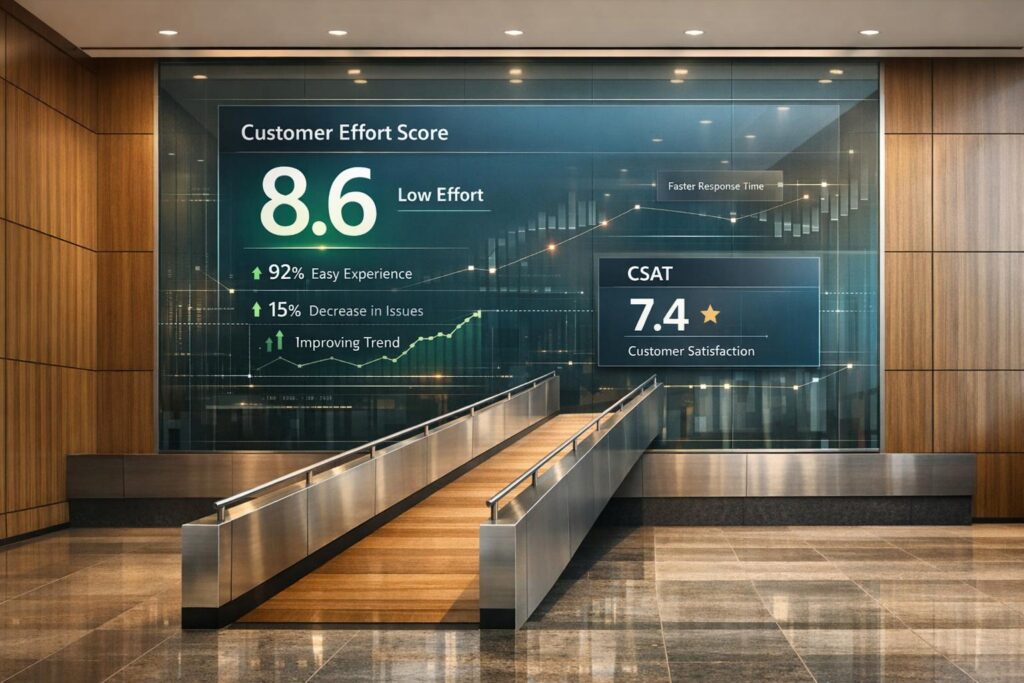
Customer Effort Score (CES) measures how easy it is for customers to complete tasks or resolve issues. Unlike CSAT, CES, and NPS, which tracks how happy customers feel, CES focuses on effort – a better predictor of loyalty. Studies show 96% of customers who face high-effort interactions lose loyalty, compared to just 9% of low-effort customers.
In B2B, where workflows are often complex and involve multiple stakeholders, CES is especially useful. It highlights pain points in processes like onboarding or technical support that CSAT might miss. A customer may rate their experience as satisfactory but still churn if the process was frustrating.
Here’s what you need to know:
- CES measures effort, not satisfaction. It asks, “How easy was this?” on a 1–7 scale.
- Low CES scores signal friction. These could stem from repetitive steps, unclear instructions, or poor handoffs.
- CES predicts retention better than CSAT. Happy customers can still churn if the process isn’t smooth.
- Use CES in key moments. Send surveys after onboarding, support tickets, or other effort-heavy tasks.
- AI tools can help. Real-time insights and automation reduce customer effort and improve CES scores. For a deeper look, see our guide to AI in customer support.
What is Customer Effort Score (CES) | How to calculate CES | When to use CES
sbb-itb-e60d259
What is Customer Effort Score (CES)?
CES vs CSAT vs NPS: Key Differences and When to Use Each Metric
Customer Effort Score (CES) is a way to measure how much effort a customer has to put in to resolve an issue, complete a task, or achieve their goal. Instead of asking customers, "How happy are you?", CES asks a more direct question: "How easy was this?"
The idea is simple: customers value ease over delight. A study from the Harvard Business Review revealed that 94% of customers who experienced low-effort interactions planned to repurchase, while only 4% of those who faced high-effort interactions felt the same [2][5]. This metric is especially relevant in B2B settings, where processes like onboarding or troubleshooting can involve multiple steps. CES helps identify if these steps are straightforward – or if they’re driving customers away.
What sets CES apart is how actionable it is. A low score pinpoints specific bottlenecks, like a confusing onboarding process or a support ticket that took too many follow-ups. This makes CES a practical tool for addressing operational issues, unlike broader metrics that focus on general customer sentiment.
How CES is Defined and Measured
CES is usually measured on a 1–7 Likert scale, where customers respond to statements like: "[Company] made it easy for me to handle my issue." A score of 1 means "Strongly Disagree", and 7 means "Strongly Agree." Some teams tweak the format and ask questions such as: "How easy was it to complete this task today?" with responses ranging from "Very Difficult" to "Very Easy."
To calculate CES, add up all the scores and divide by the total number of responses. For instance, if you get scores of 6, 7, 5, and 6, your CES would be 6.0. Scores above 5.0 are generally seen as good on a 7-point scale, with Software and SaaS companies often averaging between 5.2 and 5.6 [2].
| Format Type | Example Question | Scale |
|---|---|---|
| Likert Scale | "[Company] made it easy to resolve my issue." | 1 (Strongly Disagree) to 7 (Strongly Agree) |
| Ease Scale | "How easy was it to [complete task] today?" | 1 (Very Difficult) to 7 (Very Easy) |
| Effort Scale | "How much effort did you personally put forth?" | 1 (Very Low Effort) to 7 (Very High Effort) |
Timing is crucial. CES surveys should be sent immediately after the task is completed, whether it’s closing a support ticket or finishing onboarding. This ensures the customer’s perception of effort is fresh. Keep the survey short – stick to one rating question and one open-ended follow-up like: "What made this task easy or difficult?" This helps uncover the root cause of any issues.
Next, we’ll compare CES with other metrics like CSAT and NPS to show how it uniquely benefits B2B support.
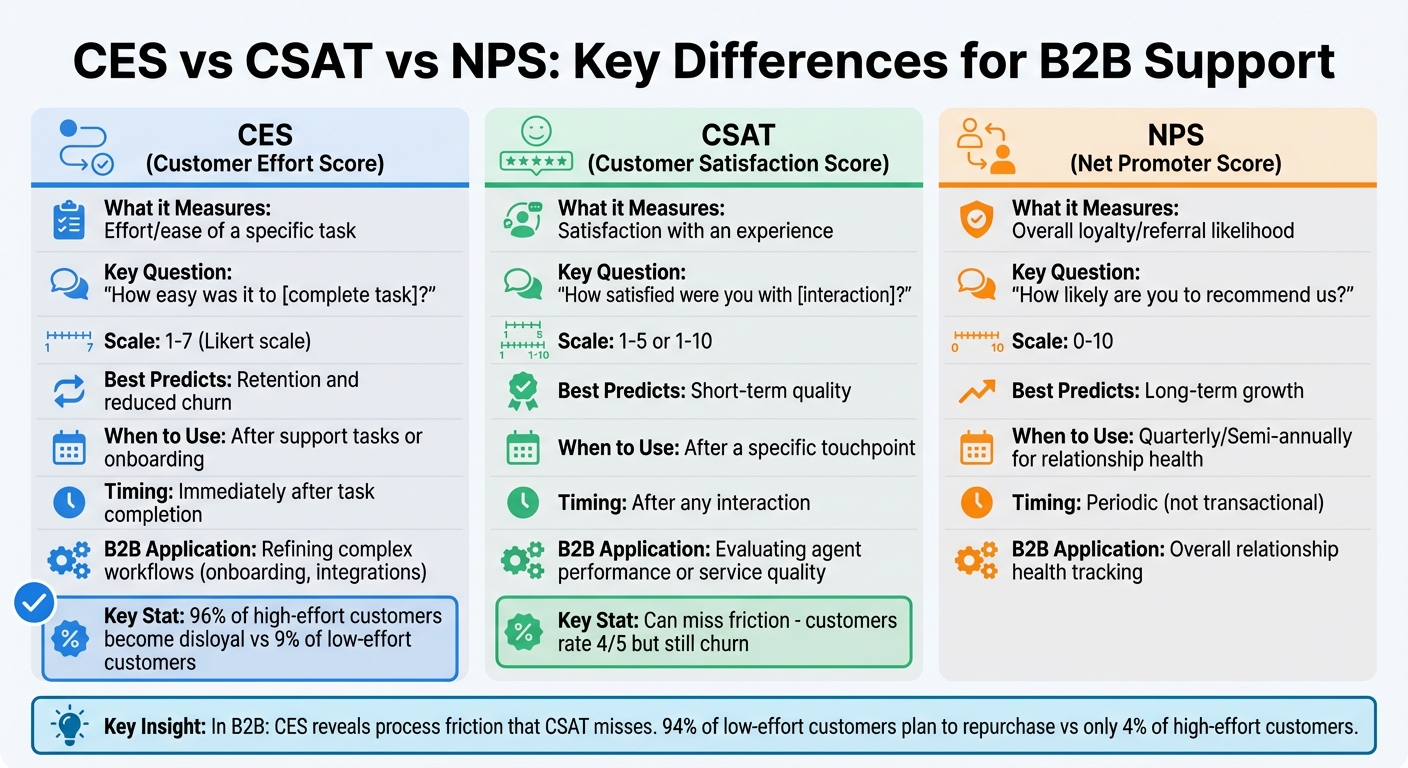
CES vs CSAT vs NPS: Key Differences
Now that we’ve covered how CES works, let’s see how it stacks up against other customer experience metrics.
CES, CSAT, and NPS all measure different aspects of customer experience. CSAT gauges satisfaction with a specific interaction, asking questions like "How satisfied were you?" after a touchpoint. NPS, on the other hand, looks at long-term loyalty by asking "How likely are you to recommend us?" and is typically used less frequently, such as quarterly.
CES, however, zeroes in on effort. It measures how easy – or difficult – it is for customers to achieve their goals. This makes it a strong predictor of retention and churn. For instance, a customer might rate their experience highly on CSAT because a support agent was helpful, but if resolving the issue required multiple calls and switching between channels, they might still leave. CES reveals these friction points.
| Metric | What it Measures | Best Predicts | When to Use |
|---|---|---|---|
| CES | Effort/ease of a specific task | Retention and reduced churn | After support tasks or onboarding |
| CSAT | Satisfaction with an experience | Short-term quality | After a specific touchpoint |
| NPS | Overall loyalty/referral likelihood | Long-term growth | Quarterly/Semi-annually for relationship health |
In B2B settings, where tasks often involve complex workflows and multiple stakeholders, CES stands out. It provides clear, actionable insights by identifying exactly where processes may be causing frustration. This makes it a powerful tool for improving customer experience in ways that directly impact retention.
When CES Outperforms CSAT in B2B Support
While CSAT tracks customer happiness, CES measures how much effort customers need to exert to achieve that satisfaction – and this distinction is crucial in B2B support.
Research reveals that 96% of customers who face high-effort interactions become disloyal, compared to just 9% of those with low-effort experiences [2]. Furthermore, 94% of customers who encounter low-effort interactions plan to repurchase, while only 4% of high-effort customers do the same [7]. These numbers highlight a major flaw in relying solely on CSAT: customers might be satisfied with the result but still churn if the process was too difficult.
"A customer can rate their satisfaction as 4/5 and still churn if the process was painful. CES catches what CSAT misses." – Johannes, Formbricks [2]
This "satisfied but frustrated" paradox is particularly common in B2B scenarios. For instance, a customer may give high CSAT scores because a support agent eventually resolved their technical issue. However, if that resolution involved multiple follow-ups, repeating information, or switching between communication channels, they’re likely to leave when their contract ends. CSAT reflects how well your team performed on a personal level, but CES uncovers inefficiencies in your overall process. This sets the stage for a deeper comparison between CES and CSAT.
CES vs CSAT: Side-by-Side Comparison
| Feature | CSAT (Customer Satisfaction Score) | CES (Customer Effort Score) |
|---|---|---|
| Question | "How satisfied were you with [interaction]?" | "How easy was it to [complete task]?" |
| Focus Area | Emotional sentiment after a touchpoint | Operational friction and ease of resolution |
| B2B Application | Evaluating agent performance or service quality | Refining complex workflows (onboarding, integrations) |
| Predictive Power | Limited; satisfied customers may still churn | High; effort strongly predicts disloyalty |
| Actionability | Useful for agent training | Ideal for process and UX improvements |
| Standard Scale | 1–5 or 1–10 | 1–7 (Likert scale) |
| Timing | After any interaction | After tasks requiring effort |
These differences highlight why CES is often a better fit for the intricate demands of B2B support.
Why CES Works Better for Complex B2B Support
CES becomes especially valuable in B2B support, where interactions often involve multiple stakeholders and technical challenges. In these environments, support isn’t just about resolving a single issue – it’s about navigating multi-step workflows, handling integrations, and meeting the needs of diverse roles. For example, an IT administrator setting up software will face different challenges than an end user completing a task or a CFO reviewing invoices. While CSAT captures the "mood" of the last interaction, CES digs deeper into the effort required by each persona, helping to pinpoint where friction occurs [1][6].
Another key advantage of CES is its ability to measure effort across the entire resolution journey, not just a single interaction [2]. If a technical issue drags on for weeks and involves multiple touchpoints, CSAT can only reflect satisfaction with the final resolution. CES, on the other hand, identifies whether customers had to chase responses, repeat themselves, or juggle multiple channels – all sources of frustration that can lead to churn, even if the problem is eventually resolved.
"Reducing customer effort is a far better predictor of loyalty than exceeding expectations or ‘delighting’ customers." – Matthew Dixon, Karen Freeman, and Nicholas Toman [2]
For B2B operations teams, CES provides actionable insights. Low CES scores can highlight process failures like poor handoffs, inadequate self-service options, or workflows that shift too much burden onto customers. This makes it possible to assign low CSAT scores to account managers for quick sentiment recovery, while high CES scores can be flagged for UX or product teams to address underlying issues [1]. These insights pave the way for improving B2B support processes, which we’ll explore further in the next section.
B2B Scenarios Where CES Beats CSAT
Customer Effort Score (CES) shines in situations where cumulative friction takes center stage. These are typically multi-step processes where the overall effort matters more than isolated moments of satisfaction.
Long-Running Technical Issues
When technical problems stretch over weeks or months, CES provides insights that Customer Satisfaction (CSAT) can’t. Issues requiring multiple escalations or repeated interactions often create a level of frustration that CSAT fails to capture. CES, however, measures the total effort required during the entire process, making it a strong indicator of potential churn.
Imagine a customer dealing with a three-week integration issue. They might rate their final interaction as satisfactory because the support agent was courteous and the problem was resolved. But if they had to repeat setup details multiple times and navigate several escalations, their CES score would reflect the frustration from that ongoing effort. This kind of prolonged friction significantly increases the risk of churn.
In B2B SaaS, high effort today often leads to lost customers tomorrow – even if they like your support team. A burdensome process can make them think twice about renewing their contract [1][8]. This is why CES is essential for identifying and addressing cumulative friction in B2B support.
Multi-Stakeholder Onboarding
Onboarding in B2B settings often involves multiple stakeholders – executives, administrators, and end users – each encountering unique challenges. While CSAT captures emotional responses to specific interactions, CES quantifies the effort required to achieve value, making it a better predictor of adoption and churn [1][8].
Take the case of a B2B software company: they reported a high CSAT score of 85% but still faced an alarming 40% annual churn rate. By introducing CES surveys tailored to different roles, they uncovered a critical issue. While executives were happy with the kickoff calls, administrators struggled with setup tasks that felt unnecessarily complex. After introducing self-service tools and clearer documentation, their CES score jumped from 45 to 72, leading to a 23% drop in churn [8]. Role-specific insights like these help pinpoint friction areas, enabling targeted improvements that boost adoption rates [1].
SLA-Driven Renewals and Service Recovery
CES proves invaluable during service recovery and renewal periods, acting as an early warning system for retention risks. For example, a customer might be satisfied with how a service outage was resolved (high CSAT) but still feel frustrated by the effort it took to get updates, escalate issues, or restore service. This creates "passive detractors" – customers who don’t voice complaints but quietly leave when their contract ends [8].
Research shows that low-effort interactions are closely tied to renewals, unlike high-effort experiences that drive customers away [8][7]. CES, by focusing on the overall operational friction, offers a clearer picture of renewal likelihood than CSAT, which only reflects the final resolution [4][3].
"Reducing customer effort is one of the most effective ways to increase retention rates." – Gartner [4]
How to Measure and Reduce Customer Effort in B2B
Setting Up CES Surveys in B2B
Measuring Customer Effort Score (CES) is simple, but in B2B environments, timing and context are everything. Stick with the standard 1–7 Likert scale, where scores above 5.0 are generally considered positive.
To get accurate feedback, automate survey triggers at key moments in the customer lifecycle – right after a ticket is closed, onboarding is completed, or a self-service interaction occurs. Timing is crucial here; the survey should reach the customer while the experience is still fresh in their mind [2][11]. Use event-based triggers like “support ticket resolved” or “onboarding finished,” and set limits to avoid over-surveying – one CES survey per customer per month is a good rule of thumb to prevent fatigue [2]. Keep it simple: a single rating question with an optional comment box for extra insights. This keeps the process quick and effortless for your customers [2].
Pair CES with First-Contact Resolution (FCR) metrics for a deeper look into customer effort. Why? Because unresolved issues often lead to repeat contacts, which are a major source of frustration. Aim for an FCR rate of at least 70% for high-touch channels like chat and phone [2]. Consider this: 96% of customers who encounter high-effort interactions are likely to become disloyal, compared to just 9% of those who have smooth, low-effort experiences [2].
While CES surveys provide valuable data, integrating AI can take things to the next level by offering real-time insights and actionable solutions.
Using AI to Lower CES Scores
AI tools can measure customer effort in real time, eliminating the need to wait for survey results. Platforms like Supportbench now use AI Predictive CES to analyze every interaction – whether it’s a call transcript, chat log, or ticket history – and generate effort scores [9]. This approach removes sampling bias and gives you a complete picture of customer effort.
One of AI’s biggest strengths is its ability to reduce friction. For example, AI-powered agent copilots can instantly pull up a customer’s full interaction history, ensuring they never have to repeat their story – a frustration that nearly 50% of customers identify as a "high-effort" experience [10]. AI can also create seamless handoffs by summarizing interactions, cutting down resolution times, and maintaining continuity. Plus, it can detect “near-miss” moments – when a customer is close to giving up – and step in with proactive support right when it’s needed [10].
AI can also improve self-service options. Regular audits of knowledge bases and chatbots ensure customers find solutions without hitting dead ends that lead to escalations. Additionally, real-time AI coaching can guide agents during live conversations, providing accurate answers faster and preventing confusing or drawn-out interactions [2]. In this way, AI doesn’t just measure effort – it actively works to reduce it.
By combining CES survey insights with AI-driven strategies, businesses can create smoother workflows and tackle even the most complex support challenges with less effort for the customer.
"Reducing customer effort is one of the most reliable predictors of customer loyalty, surpassing even traditional satisfaction metrics like Net Promoter Score (NPS)." – Gartner [9]
Conclusion
Looking at the comparison between CES and CSAT, the benefits of reducing customer effort stand out clearly. In B2B support, cutting down on friction is essential. Gartner’s research highlights that lowering customer effort is one of the best ways to improve retention rates [4]. The statistics speak for themselves: 59% of U.S. customers will abandon a company they love after multiple bad experiences, and 17% will leave after just one [3]. High-effort experiences often lead to churn, even if customers are ultimately satisfied [1].
CES shines by offering actionable insights into process issues that CSAT doesn’t address. This is especially valuable for areas like multi-stakeholder onboarding, technical integrations, and self-service attempts [1]. These insights are a game-changer for refining AI-driven tools, addressing documentation gaps, and enhancing agent training. Delivering a great customer experience can increase revenue by as much as 84% [3], and CES is the metric that helps you pave the way.
Here’s how to get started: Send out CES surveys immediately after high-effort interactions, such as troubleshooting or onboarding [4]. Establish Service Level Agreements (SLAs) to ensure quick responses to high-effort feedback – ideally the same day [1]. Share this feedback directly with product and UX teams for fast action [1]. Segment responses by persona to tackle the unique challenges faced by different user groups, like administrators and end users [1]. Leverage real-time AI insights to continuously improve your processes. By combining CES strategies with advanced AI tools, you can consistently reduce customer effort.
Currently, about 1 in 6 B2B companies already use CES alongside NPS to track both relationship health and ease of interactions [3]. If retention and operational efficiency are priorities for your business, CES deserves a central role in your support strategy. It’s not just about making customers happy in the moment – it’s about making their work simpler, every single time.
FAQs
What’s a “good” CES score for B2B support?
A "good" CES score for B2B support usually ranges between 4.0 and 5.0 on a 5-point scale. Alternatively, it can reflect an 80% or higher agreement that the process was easy. Such scores suggest minimal effort for customers, which often correlates with stronger customer loyalty.
When should I send CES surveys without annoying customers?
When it comes to CES surveys, timing is everything. Sending them right after a customer interaction or support experience is key. Why? Because the details are still fresh in the customer’s mind. This approach helps you get accurate feedback on how much effort they felt was involved.
Acting promptly not only uncovers any friction points but also allows you to enhance the overall experience. Plus, it strikes a balance – gathering insights without overwhelming customers with too many surveys.
How can AI reduce customer effort in long, complex tickets?
AI makes handling complex support tickets simpler for customers by automating repetitive tasks and organizing processes more effectively. AI-powered chatbots take care of routine questions, while smart triage systems collect essential information right from the start. Advanced tools for classification and routing ensure that tickets are sent to the right agent or team quickly, cutting down on unnecessary delays. Plus, AI agents offer consistent, around-the-clock support, reducing the need for back-and-forth exchanges. This speeds up resolutions and makes the entire experience smoother and easier for customers.
Related Blog Posts
- What CX metrics actually predict churn in B2B support (and how do you track them)?
- How do you measure support quality beyond QA scoring (and what to track instead)?
- How do you reduce customer effort (CES) in B2B support without lowering standards?
- Best Helpdesk Software with Built-in Customer Health Scoring