When managing thousands of support tickets, patterns often go unnoticed without a structured system. An incident taxonomy organizes tickets into clear categories (like service area, impact, and root cause), enabling teams to spot trends, fix recurring issues, and improve efficiency. Without it, inconsistent labels and vague tags like "Other" can lead to chaos, missed insights, and poor decision-making.
Key Takeaways:
- What is it? A structured framework to group incidents by metadata (e.g., severity, root cause).
- Why it matters: Prevents disorganized data, improves root cause analysis, and boosts operational efficiency.
- Steps to create it:
- Analyze past tickets to identify patterns.
- Build a two-tier structure (broad categories → specific subcategories).
- Standardize attributes like root cause, impact, and resolution type.
- Use AI tools for auto-tagging and trend analysis.
- Common pitfalls: Avoid too many categories, vague tags, or over-complicating the system.
- Metrics to track success: Classification accuracy (>90%), reclassification rate (<10%), and routing accuracy (>85%).
A well-designed taxonomy helps teams resolve issues faster, reduces repetitive problems, and ensures better data for decision-making.
4-Step Process to Build an Effective Incident Taxonomy for Support Teams
Defining Your Incident Category/Subcategory Model
sbb-itb-e60d259
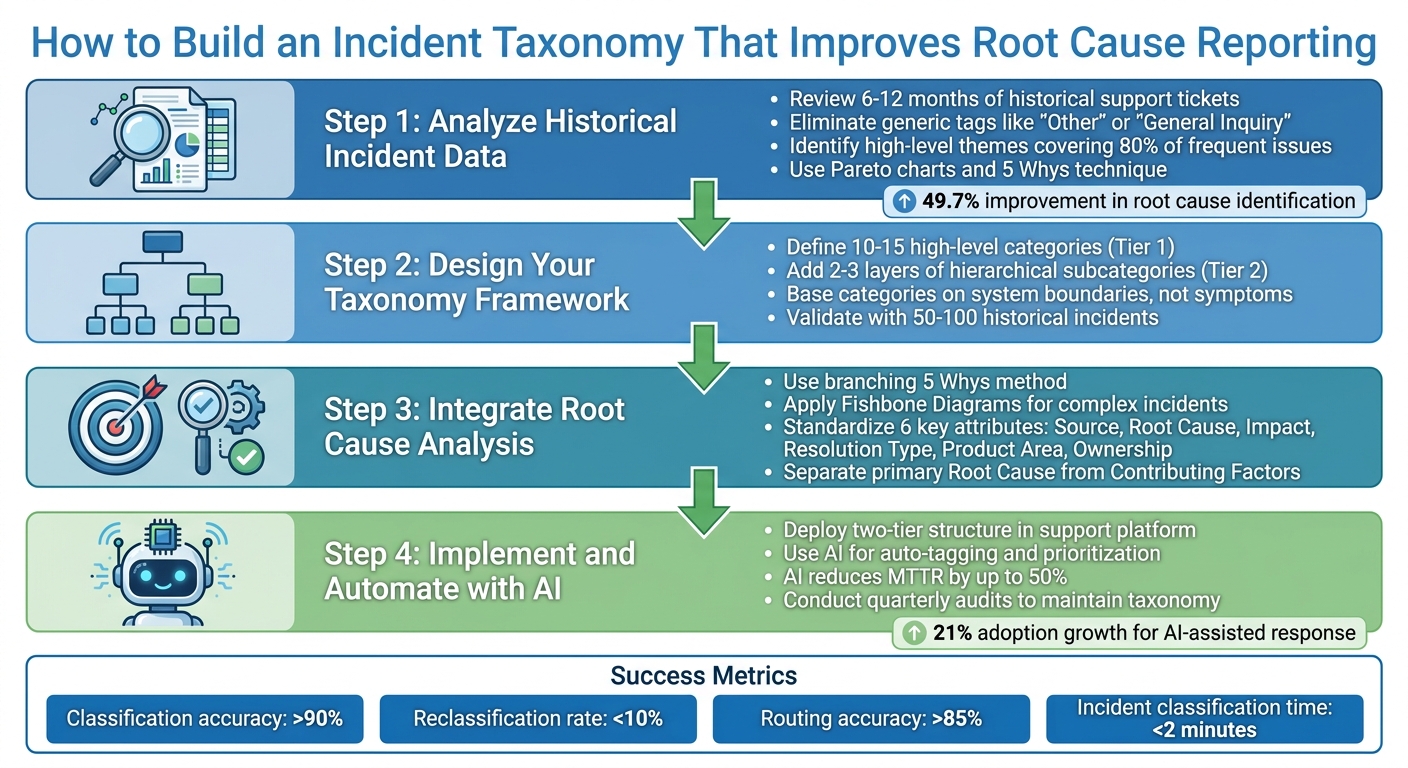
Step 1: Analyze Historical Incident Data
Digging into historical ticket data is the first step toward building a taxonomy that works. By identifying recurring issues, you’ll create a solid foundation for actionable and precise categories.
Review Historical Support Tickets
Start by gathering 6–12 months of historical support tickets. This range strikes a good balance: it’s enough data to spot patterns without pulling in outdated information [2]. Pay close attention to frequently occurring incidents and note the root causes that keep popping up.
Here’s an example: one team managed to organize hundreds of thousands of tickets by grouping them into categories like errors, feature questions, and requests. This framework made it much easier to analyze trends [2].
As you review, get rid of generic tags like "Other" or "General Inquiry." These labels don’t tell you anything useful and will only muddy your analysis [2]. Instead, stick with specific and standardized terms. If you notice overlapping tags, consolidate them under a single, clear label [2].
Identify High-Level Themes
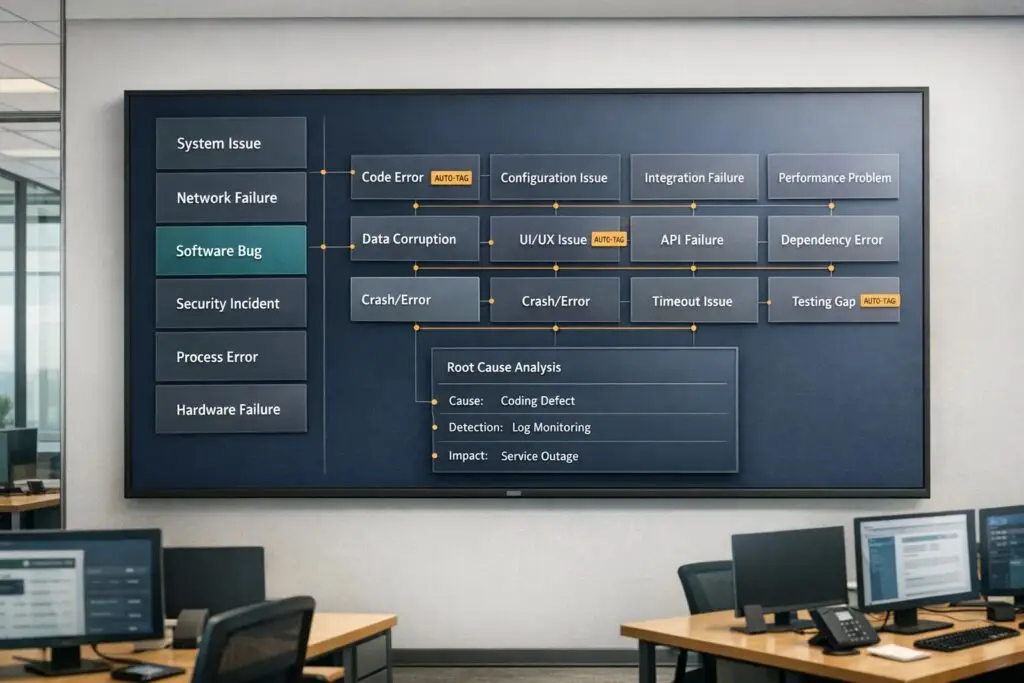
Once your ticket review is complete, it’s time to group frequent incidents into broader themes. Focus on the 80% of issues that show up most often. The rare, edge-case incidents can be handled separately using routing rules or by optimizing your support workflows or a distinct field [2]. Common high-level themes often include categories like Technical Issues, Billing & Payments, Feature Requests, and Account Management.
From here, structure these themes using a two-tier model. The first tier includes stable, overarching topics, while the second tier dives into specific subcategories. For instance, under "Technical Issues" (Tier 1), you might include subcategories like "Login", "Performance", "API", or "Integration" (Tier 2) [2].
To ensure your categories are accurate, use tools like Pareto charts to pinpoint the most frequent issues. You can also apply the 5 Whys technique to dig deeper and uncover the root causes of recurring problems [3][4]. This way, your taxonomy will be based on real-world data, not assumptions.
Step 2: Design Your Incident Taxonomy Framework
Once you’ve analyzed historical data, often using advanced analytics and insights, the next step is creating a structure that balances breadth and specificity. The framework should be broad enough to include all potential incidents but detailed enough to guide actionable responses.
Define High-Level Categories
Start by identifying 10–15 high-level categories that cover your support system comprehensively without overwhelming your team [1]. A study by Microsoft Azure, which examined over 2,000 production incidents across 450+ services, found that a well-structured set of high-level categories simplifies incident logging and reduces misclassification [1,3].
Instead of focusing on symptoms like "slow performance" or "weird behavior", base your categories on system boundaries or failure types, such as retrieval issues, policy violations, integration errors, or hardware malfunctions [6]. As Heavy Thought Laboratories aptly put it:
"If you cannot name the boundary that broke, you are not debugging yet." – Heavy Thought Laboratories [6]
For example, IT help desks often use categories like Applications, Hardware, Network, and Training, while call centers might prefer Account & Billing, Technical Support, and Orders [1]. Each category should correspond to a specific response playbook and have clearly defined ownership for resolution [3,13].
Once you’ve established these high-level categories, refine the framework by layering it with more detailed subcategories.
Add Hierarchical Subcategories
Enhance your taxonomy by adding 2–3 layers of hierarchical subcategories to pinpoint specific failure types. Think of it as a funnel: broad categories at the top, narrowing down to more specific issues. For instance, under "Hardware", you might include "Desktop", then drill further to "Monitor", and finally specify issues like "No Power" or "Flickering" [1].
This detailed structure helps streamline incident classification and speeds up resolution. Companies with intuitive taxonomies have reported capturing 60% more information during initial calls and achieving a 90% SLA compliance rate [1]. The key is ensuring that every subcategory aligns with a unique resolution process or team assignment [1].
However, keep the structure simple. Overly complex systems can lead to misclassification [7]. Regularly review incidents tagged as "Other" to identify gaps in your taxonomy and determine if new subcategories are needed [1].
Use Examples to Validate Categories
Once your taxonomy is defined, test its effectiveness with real-world data. Use 50–100 historical incidents to validate that each one fits neatly into a single category [1]. If incidents don’t align with a specific category or appear to fit multiple ones, it’s a signal to refine your framework [1].
High-level categories should remain stable even as new product features are introduced, while subcategories can evolve to accommodate changes [6]. This ensures your taxonomy stays relevant and adaptable over time.
Step 3: Integrate Root Cause Analysis into Taxonomy
To effectively resolve incidents, it’s essential to connect each issue to its true cause rather than just describing the symptoms. For instance, "database slowness" might point to an observation, but the actual cause could be something like an "N+1 query introduced during deployment" [9]. If you fail to make this distinction, you’ll likely end up addressing the same issues over and over again.
Use Root Cause Analysis Techniques
One effective approach is the branching 5 Whys method. Instead of stopping at a single line of questioning, explore parallel threads. For example, ask both why the error occurred and why monitoring failed to catch it [9]. This dual approach uncovers not just the technical failure but also any gaps in your processes.
For more intricate incidents, tools like Fishbone Diagrams can help. These diagrams, built around the "6Ms" framework, allow teams to categorize issues and determine whether they stemmed from human error, hardware failure, process breakdowns, or something else entirely [8]. Another useful technique is Barrier Analysis, which focuses on identifying failed safety measures or process controls that allowed the incident to happen [8].
The goal is to base every conclusion on solid, objective evidence. As Deploy & Pray explains:
"The goal isn’t to find someone to blame. It’s to find the specific, traceable, fixable condition that – if changed – would have prevented the incident entirely." [9]
To ensure your analysis is credible, link every finding to tangible evidence like log entries, metrics, or timestamps. This approach ensures conclusions are verifiable and not just based on memory. By standardizing key incident attributes, you can turn these insights into consistent and actionable data.
Standardize Key Incident Attributes
To streamline your analysis and improve consistency, standardize six critical incident attributes:
- Source: Where the issue was first identified, such as through a customer report, internal monitoring, or QA testing.
- Root Cause: The underlying reason for the incident, chosen from a predefined list to ensure uniform categorization. Many teams use the RUF framework, classifying incidents into Reliability (errors/outages), Usability (how-to queries), or Functionality (missing features) [2].
- Impact: Measures the severity of the incident and identifies the affected customer segment (e.g., Enterprise or SMB). This includes whether the incident posed a risk to SLA performance [2].
- Resolution Type: Describes how the issue was resolved – whether through a code fix, a refund, a documentation update, or a configuration change.
- Product Area: Specifies the feature or module involved in the incident.
- Ownership: Identifies the department responsible for resolving the issue [2].
Additionally, separate the primary, fixable Root Cause from any Contributing Factors, such as systemic gaps like insufficient monitoring. Include a Root Cause Confidence field (Low/Medium/High) to indicate how certain the team is about their analysis [8][9].
| Attribute | Description | Example Values |
|---|---|---|
| Source | Where the incident was first identified | Customer report, API monitor, QA testing |
| Root Cause | Underlying reason, selected from a standardized picklist | Software bug, human error, hardware failure |
| Impact | Severity and affected customer segment (including SLA risk) | Enterprise customer, service outage, high priority |
| Resolution Type | How the incident was resolved | Code fix, refund, documentation update |
| Product Area | Specific feature or module involved | Login Module, Reporting Engine, Billing Portal |
| Ownership | Department responsible for resolution | Engineering, Customer Support |
| Contributing Factors | Additional systemic gaps that worsened the incident | Monitoring gap, process gap, architecture gap |
Step 4: Implement and Automate with AI Tools
Scaling your taxonomy effectively means overcoming the limitations of manual tagging. Manual processes often buckle under high ticket volumes, leading to inconsistent categorization and unreliable reporting. AI-powered automation solves these problems by applying your taxonomy instantly and uniformly to every incoming incident. This ensures both speed and consistency.
Deploy Taxonomy in Your Support Platform
Start by embedding your taxonomy directly into your support platform using a two-tier structure. The first tier should include mandatory, high-level categories (Tier 1: Topic), while the second tier can provide optional subcategories (Tier 2: Subtopic). For example, a ticket about an "Invalid credentials error" might be tagged as Technical Issue (Tier 1) and Login (Tier 2).
To ensure clarity and consistency, Tier 1 categories should be stable and mutually exclusive, leaving no room for ambiguity. Avoid vague, catch-all tags like "Other" or "General Inquiry." Standardize terminology to avoid confusion – stick to a single term per concept (e.g., "Billing" instead of alternating between "Invoicing" and "Payments"). Defining each tag with a concise, one-sentence description will help your team apply them consistently.
You can take this a step further by linking taxonomy tags to automated workflows. For instance, tickets tagged as "Escalation" or "Service Outage" can be routed directly to the engineering team with a predefined SLA. Once your taxonomy is deployed, automation can take over to manage increasing ticket volumes.
Use AI for Auto-Tagging and Prioritization
AI tools simplify the tagging process by analyzing ticket content and automatically applying the appropriate Tier 1 and Tier 2 tags based on your predefined rules. This eliminates the need for agents to manually select tags, making the process faster, more scalable, and more consistent.
Recent data shows that organizations using AI-assisted incident response have seen adoption grow by 21%, with 63% already leveraging it [11]. AI can reduce Mean Time to Resolution (MTTR) by up to 50% and cut incident containment time by 40% [11]. One study analyzing 100,000 cloud incidents found a 49.7% improvement in identifying root causes through AI [11].
AI also provides classification summaries, helping agents understand the logic behind each tag and spot potential errors [12]. By including confidence levels (e.g., High/Medium/Low) with each tag, AI can flag uncertain cases for human review.
Beyond tagging, AI can group incidents with similar symptoms, dependencies, or error patterns to uncover systemic issues, such as faulty configurations or aging hardware [11]. It can also generate concise summaries of complex incidents, saving agents from digging through lengthy ticket threads. For historical analysis, AI can retroactively apply your taxonomy to past incidents, revealing long-term trends [13].
To implement AI tagging, start with non-critical categories and require human oversight during the initial phase [11]. Regular quarterly audits are crucial for maintaining a clean taxonomy. These reviews help consolidate overlapping tags, remove unused ones, and ensure your system aligns with your evolving support needs.
| Feature | Manual Tagging (Agent-Driven) | AI-Driven Tagging |
|---|---|---|
| Consistency | Low – varies by individual | High – follows standardized rules |
| Scalability | Poor – struggles with volume | High – handles thousands of tickets |
| Speed | Slow – requires manual effort | Instant – fully automated |
| Historical Analysis | Difficult and time-intensive | Easy – enables retrospective tagging |
Common Pitfalls and Best Practices for Validation
Even a well-thought-out taxonomy can fall apart if it becomes overly complicated or disconnected from day-to-day operations. One of the biggest challenges is overspecificity – creating too many unique tags for minor incidents. This approach scatters data, making it harder to identify trends. Teams often fall into this trap when they add a new tag for every slight variation instead of grouping similar issues together.
Avoid Over-Categorization
Keep your Tier 1 categories concise – aim for no more than 10 distinct and clearly defined options. Eliminate vague tags like "Other" or "General Inquiry", as these tend to become catch-all categories that obscure meaningful insights. Consistency is key: standardize your terminology to avoid confusion (e.g., stick with "Billing" rather than switching between "Payments" and "Invoicing"). To make things clearer, provide a one-sentence definition for each category so everyone interprets them the same way [2].
Focus on the most common incidents, covering the 80% of issues you encounter most frequently. Avoid overcomplicating the taxonomy to accommodate rare edge cases. As Shabie aptly puts it:
"If you find yourself spending more time arguing about category boundaries than using the categories, you’re already too deep in the tail" [14].
Once you’ve established clear boundaries for your categories, test them out with real data to ensure they hold up in practice.
Validate with Real Incidents
Testing is a critical step that builds on your earlier design work and analysis of historical data. Before deploying your taxonomy across the organization, test it against 50–100 recent incidents. Have multiple agents independently tag the same tickets, then compare their results. If there’s significant disagreement, it’s a sign that your category definitions need work. Pay close attention to tags that agents find confusing and refine those definitions immediately. If placeholder tags like "Other" are frequently used during this pilot phase, it’s a clear sign that your primary categories don’t align with the actual issues your team handles [2].
Once your categories are validated, establish a routine for reviewing and updating them to match evolving needs.
Iterate for Continuous Improvement
Schedule regular audits – every three months is a good starting point – to review tag usage. Consolidate any overlapping tags and remove those that haven’t been used in the past 90 days [2]. Keep an eye on how often tickets fall into unmapped categories. If you see a spike, it’s a sign that your taxonomy needs adjustments to reflect current trends in customer issues [10]. This ongoing process ensures your taxonomy stays relevant and effective, whether it’s used by humans or AI systems. Implementing AI-powered ticket routing can further enhance this process by automating the classification of incoming requests.
| Validation Metric | Red Flag | Healthy State |
|---|---|---|
| Tier 1 Volume | More than 10 categories | 5–10 stable categories |
| "Other" Tag Usage | High usage (catch-all dumping ground) | Zero or near-zero usage |
| Tag Depth | 4+ levels of subcategories | 2 levels (Topic > Subtopic) |
| Consistency | Agents use varying tags for the same issue | One-sentence definitions guide uniform usage |
Measuring Success: The Impact of Taxonomy on Reporting
Once you’ve established and fine-tuned your incident taxonomy, the next step is to evaluate its effectiveness using targeted metrics.
Key Metrics to Track
To gauge performance, focus on these critical metrics:
- Classification accuracy: Strive for an accuracy rate above 90% [5]. If you’re falling short, it could mean your category definitions need tweaking, or your team might require more training.
- Incident classification time: Ensure incidents are categorized in under 2 minutes [5]. Longer times may indicate overly complex or unclear categories.
- Reclassification rate: Aim to keep this below 10% [5]. High reclassification rates suggest that initial tagging is ambiguous or inconsistent.
- Routing accuracy: This metric shows whether incidents are correctly routed to the appropriate team on the first try. A target of over 85% [5] is ideal. Missed targets here can lead to wasted time and frustrated agents and customers.
- Escalation rates: High escalation rates often point to poor classification or gaps in your taxonomy [15][16].
- First-touch resolution rate: A high rate here indicates that your taxonomy is well-structured and your playbooks are effective, enabling immediate resolution for many incidents [15].
For example, Carrefour tackled their mean time to resolve (MTTR) in 2021 by leveraging insights into system performance. By refining their incident response processes, they achieved a 3x faster response rate to security threats and improved their ability to make informed, preventative decisions [16].
Use Dashboards for Reporting
Dashboards are invaluable for turning raw data into actionable insights. They can help visualize incident trends and pinpoint areas for improvement:
- Incident volume by category: Track trends over time to identify recurring issues, such as spikes in login or billing problems [2].
- Pareto analysis: Use Pareto charts to determine the 20% of root causes responsible for 80% of incidents. This enables leadership to focus resources where they’ll make the most impact [17].
- Catch-all tag volume: High usage of generic tags signals the need to refine Tier 1 categorization options [2].
Papa Johns offers a great example. In 2026, they implemented custom dashboards to monitor their hybrid environment. This allowed them to resolve release issues on the same day, cutting down a previously multi-day lag [16].
Additionally, break down SLA compliance by taxonomy type. For instance, if "Database" incidents are consistently missing SLA targets while "UI" issues meet them, it highlights where your team needs to improve [5]. Reviewing dashboards quarterly can also help identify and eliminate unused or overlapping tags [2].
Conclusion: Building a Scalable Framework for Success
Creating an effective incident taxonomy is an ongoing process that evolves alongside your operations.
Key Takeaways for Support Leaders
The best taxonomies are built around three pillars: stability, flexibility, and governance. Keep Tier 1 categories stable and limited to fewer than 10 options. This reduces the risk of overwhelming agents and ensures consistent reporting [2]. On the other hand, Tier 2 subcategories can be more adaptable, allowing you to address new issues without disrupting historical data.
"A scalable request taxonomy is less about finding the ‘perfect’ set of categories and more about building a repeatable operating system." – fitgap [10]
Think of your taxonomy as a piece of well-maintained code. Use a versioned mapping table with effective and sunset dates to keep historical reports intact. For example, if "Login Issues" is renamed to "Authentication Errors", this system ensures year-over-year comparisons remain accurate [10]. Assign a single owner to oversee the change log, and only approve new categories based on clear criteria – not just ad hoc suggestions from agents.
AI tools can assist but shouldn’t replace human oversight. Leverage AI clustering to spot emerging trends in tickets, but always validate these findings manually before introducing new categories [10]. This prevents redundancy and avoids clutter from near-duplicate labels. Additionally, monitor the use of the "Other" tag – if it accounts for more than 10% of tickets, your taxonomy likely needs adjustment [2][10].
These principles lay the groundwork for effective implementation.
Next Steps for Implementation
Begin with the RUF Framework: classify tickets into one of three categories – Reliability (errors/performance issues), Usability (how-to inquiries), or Functionality (feature requests) [2]. This straightforward model provides immediate clarity and complements the standardized attributes discussed earlier.
Set a recurring schedule to review, consolidate, and update your taxonomy [10][2]. Document concise, one-sentence definitions for each category in your internal knowledge base to ensure uniform understanding across your team [2].
Modern AI-driven platforms can automate tasks like classification, routing, and reporting, saving up to 35 hours of manual work each month [1]. By adopting this structured approach, ticket tagging evolves from a routine task into a strategic tool. Your taxonomy becomes the backbone of your strategy, turning classification into a key driver of operational success [2]. Following these steps, support leaders can build a scalable, AI-enabled framework that grows with their needs.
FAQs
What’s the fastest way to start an incident taxonomy without boiling the ocean?
The fastest way to create an incident taxonomy without making it overly complex is to start small and build from there. Begin by reviewing past incident data to pinpoint the most common or impactful issues. Then, group these into broad categories. Over time, you can refine these categories into subcategories, organizing them in a clear, hierarchical structure. This method keeps things simple, relevant, and easy to scale as needed.
How can we keep root cause labels consistent across teams and tools?
Creating consistency in root cause labels starts with a clear, standardized taxonomy. This means crafting a system that’s easy to understand yet detailed enough to capture the necessary information. Striking this balance ensures the labels are both practical and meaningful.
Here are some ways to achieve this:
- Standardized Definitions: Clearly define each label to avoid confusion. Everyone on the team should have a shared understanding of what each term means.
- Training and Guidelines: Provide training sessions or written guidelines to ensure everyone applies the labels consistently.
- Automation Tools: Leverage automation to enforce or suggest tags. Tools with predefined rules can help reduce human error and variability.
- Regular Reviews: Periodically evaluate and refine your taxonomy. This helps address inconsistencies and ensures the system evolves alongside your team’s support needs.
By implementing these practices, you can create a system that minimizes confusion and adapts to changes over time.
When should we let AI auto-tag tickets, and when should humans review?
AI works best for auto-tagging tickets when the classification system is well-defined, consistent, and the tickets follow predictable trends. However, human oversight becomes essential for managing cases that are complex, unclear, or require careful interpretation – especially when accuracy is a top priority. Striking this balance allows automation to handle routine tasks efficiently while ensuring precision for more intricate support scenarios.