
Want to stop customers from leaving before it’s too late? A churn-risk rubric can help you predict which accounts are at risk by analyzing support interactions. Key metrics like unresolved tickets, negative sentiment, or spikes in ticket volume can signal dissatisfaction early. By turning these signals into a scoring model, you can act quickly to retain customers.
Here’s how to do it:
- Identify churn signals: Look for patterns like rising ticket volumes, sentiment shifts, or SLA breaches.
- Create a scoring model: Assign weights to these signals based on their predictive power.
- Use AI for automation: Let AI detect patterns and calculate risk scores in real time.
- Test and refine: Validate your rubric with historical data and adjust regularly.
Why this matters: Retaining customers is far more cost-effective than acquiring new ones. A 5% improvement in retention can increase profits by 25–95%. Start using your support data to prevent churn today.
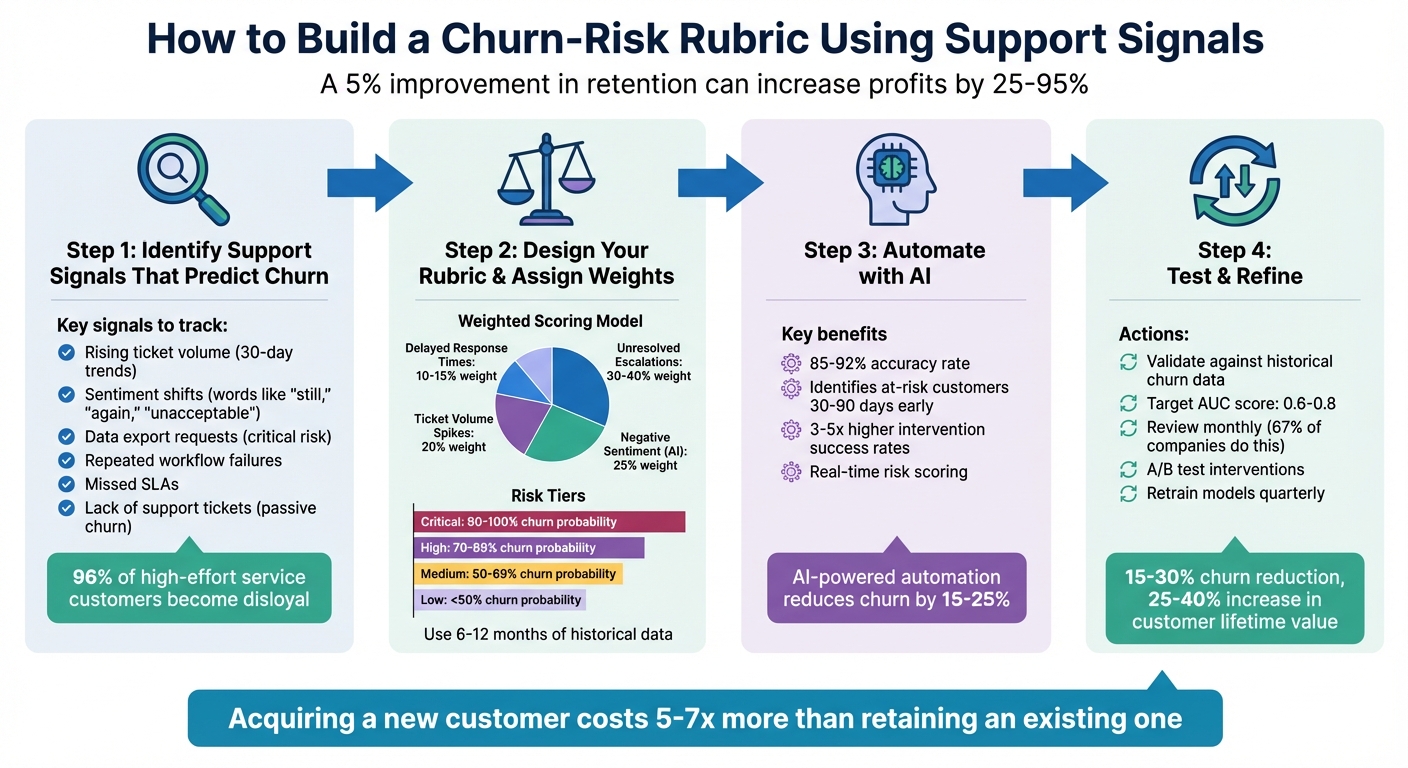
4-Step Process to Build a Churn-Risk Rubric Using Support Signals
Get Quick Insights & Easily Predict Customer Churn: AI & ML Classification
sbb-itb-e60d259
Step 1: Identify Support Signals That Predict Churn
To manage churn effectively, start by pinpointing support signals that strongly correlate with the likelihood of a customer leaving. This means digging into your support data to uncover patterns that show up consistently in accounts that churned compared to those that stayed.
The most telling signals often highlight customer effort and product friction. Research backs this up: 96% of customers who experience high-effort service grow disloyal, while only 9% of low-effort service customers do the same [4]. This makes effort-centered signals – like unresolved issues or escalations – much more reliable than surface-level metrics like login frequency.
Core Support Metrics to Track
Here are some key metrics that can act as early warnings for churn risk:
- Rising ticket volume: A steady increase in tickets over a 30-day period suggests recurring technical problems, confusing workflows, or poor product adoption. While a one-off issue might not be alarming, consistent friction can erode trust over time.
- Shifts in sentiment: Language changes – words like "still", "again", "unacceptable", or "disappointed" – can signal growing frustration. AI-powered sentiment analysis tools can help detect these subtle shifts that manual reviews might overlook.
- Requests for data exports: When customers ask for bulk data exports, it often signals they’re considering a migration or evaluating alternatives. This is a serious red flag, as it frequently reflects an intention to leave.
- Repeated workflow failures: Persistent breakdowns in key workflows or integrations can cause user fatigue and shake confidence in your product’s reliability. Watch for repeated tickets tied to the same issue – these indicate unresolved problems.
- Missed SLAs (Service Level Agreements): Failing to meet response or resolution deadlines, especially for high-value accounts, can seriously damage trust. It suggests process issues and might push customers toward more reliable competitors.
- Lack of support tickets: A sudden drop in support contact isn’t always a good sign. It can mean a customer has disengaged entirely – a passive churn signal that’s easy to miss when focusing only on active complaints.
| Support Signal | Significance | Risk Level |
|---|---|---|
| Data Export Request | Indicates potential migration or cancellation | Critical |
| Sustained Ticket Volume | Highlights ongoing friction or adoption issues | High |
| Negative Sentiment Shift | Suggests eroding trust and emotional disengagement | Medium/High |
| Repeated SLA Breaches | Signals unreliability, especially for enterprises | High |
| Frequent Workflow Errors | Causes user fatigue and questions about ROI | Medium |
| Absence of Support Tickets | Suggests passive disengagement | High |
Focus on Measurable Signals
Once you’ve identified these signals, make sure each one can be tracked and quantified. This ensures consistency and allows you to monitor trends over time. Avoid relying on vague impressions – stick to solid metrics like monthly ticket counts, sentiment scores, and escalation rates.
Start by leveraging data already available in your support logs. Metrics like ticket volume, backlog age, and CSAT, CES, and NPS scores [3] require no extra setup and can provide immediate insights. As your processes evolve, you can add more advanced signals, such as feature-specific engagement drops or billing-related concerns.
Finally, tie these signals to revenue impact. Not every at-risk account will carry the same weight, so prioritize based on factors like Monthly Recurring Revenue (MRR) or Lifetime Value (LTV) [5]. This allows you to focus your efforts where they matter most.
Step 2: Design Your Rubric Criteria and Assign Weights
Now that you’ve identified the key support signals, it’s time to turn them into a scoring model. The aim here is to create a rubric that’s both objective and actionable, allowing you to quickly pinpoint which customers are at risk and need immediate attention.
Start by analyzing 6–12 months of historical data. Compare the support behaviors of customers who churned with those who renewed or expanded. Look closely at their support activity 90, 180, and 270 days before the churn event to uncover recurring patterns [11].
Set Signal Thresholds and Risk Levels
The next step is defining thresholds that distinguish normal customer behavior from concerning patterns. A reliable way to do this is through cohort analysis. Divide your historical data into 10 equal-sized groups (deciles) based on metrics like ticket volume or sentiment scores. Then, calculate the churn rate for each group. For example, if customers with more than five unresolved tickets in 30 days show a higher churn rate, that becomes your threshold [8].
Another effective method is calculating signal lift – the ratio of churn rates between customers exhibiting a signal versus those who don’t. Signals with a lift of 2x or more are strong predictors and should be given more weight [1].
Use percentiles to define risk tiers instead of static thresholds. For instance, the top 5% of customers with the highest churn probability might fall into the "Critical" risk category, while the next 15% could be labeled "High" risk [7].
Here’s an example of risk tiers based on churn probability:
| Risk | Churn Probability | Action/Intervention |
|---|---|---|
| Critical | 90% – 100% | Immediate executive outreach; aggressive retention offers [7][11] |
| High | 70% – 89% | Dedicated Success Manager intervention; technical audit [7][11] |
| Medium | 50% – 69% | Targeted product training; feature education campaigns [7][11] |
| Low | < 50% | Standard automated nurturing; monitor for changes [7][11] |
Build a Weighted Scoring Model
To make your rubric even more effective, assign weights to each signal based on its predictive power. Focus on leading indicators – those that appear early and reliably predict churn – over lagging ones like missed payments, which often come too late to act [11].
For example:
- Unresolved escalations should carry the most weight (30–40%) because they are strong indicators of frustration [11][1].
- Negative sentiment detected by AI deserves a medium-high weight (around 25%), as it signals emotional detachment [11][1].
- Ticket volume spikes might be given 20%, while delayed response times could be weighted at 10–15% [11].
| Support Signal Example | Weighting Logic |
|---|---|
| Unresolved Escalations | High Weight (30-40%) – Strong predictor of frustration [11][1] |
| Negative Sentiment (AI) | Medium-High Weight (25%) – Indicates emotional detachment [11][1] |
| Ticket Volume Spikes | Medium Weight (20%) – Suggests engagement or struggle [6][11] |
| Delayed Response Times | Low Weight (10-15%) – Secondary contributor to churn [11] |
Standardize all signals on a 1–10 scale [11]. Use rolling 30-day windows to capture recent changes in customer behavior instead of relying on static averages [9]. This ensures your rubric stays responsive to shifts in customer health.
Before using your rubric, test it against a hold-out set of historical data. Check whether the scores you assign would have accurately predicted past churn events [8][10]. A good churn prediction model should achieve an AUC (Area Under the Curve) score between 0.6 and 0.8 [8]. If your model falls short, revisit your thresholds and weights.
Finally, integrate these scores with account revenue data to prioritize retention efforts where they’ll have the biggest financial impact. For instance, focus on customers with high-risk scores and significant revenue potential (e.g., MRR or LTV). This ensures your team’s efforts are both targeted and impactful.
Step 3: Automate Signal Detection and Scoring with AI
Manually predicting churn becomes impossible when you’re dealing with thousands of tickets, tracking engagement patterns, and scoring hundreds of accounts. AI removes this bottleneck by analyzing all customer interactions – across email, chat, phone, and Slack – around the clock, without relying on sampling [13][12].
The real game-changer here isn’t just speed. AI uncovers patterns that human analysts might overlook. For example, it can detect a sequence of three product errors followed by a 40% drop in logins over 30 days, flagging churn risks without the need for individual alerts [13]. Predictive models that incorporate these signals achieve impressive accuracy rates of 85–92% and can identify at-risk customers 30–90 days before they cancel. This early detection is critical because intervention success rates are 3–5 times higher during this window [14]. These insights pave the way for a closer look at how AI extracts signals and scores risk in real time.
AI-Driven Signal Extraction
AI relies on tools like Natural Language Understanding (NLU) and sentiment analysis to detect signals that humans might miss. It can interpret emotional cues such as frustration, disappointment, or sarcasm in support tickets – even when customers don’t explicitly voice their concerns [13]. This is especially useful for identifying silent churn, where warning signs aren’t obvious.
Platforms like Supportbench take this a step further, offering predictive CSAT, CES, and NPS metrics directly within case lists. These tools can also flag First Contact Resolution (FCR) failures by analyzing case histories – something that was previously difficult to track without AI [13]. Beyond ticket-level insights, AI can summarize entire case histories, monitor sentiment trends over time, and even detect non-ticket signals, such as delays in email responses or the departure of a key contact (e.g., through email bounces or LinkedIn data) [12].
When setting up your AI system, focus on tracking changes over time rather than just absolute numbers. For instance, a customer with 10 open tickets might not be at risk, but if their ticket volume jumps from 2 to 10 in 30 days, that sharp increase is a clear warning sign [14].
Once signals are accurately extracted, real-time risk scoring turns these insights into actionable strategies.
Real-Time Risk Scoring and Alerts
Static reports – whether weekly or monthly – are too slow to prevent churn effectively. AI-powered systems calculate risk scores in real time and trigger workflows the moment a customer’s risk level becomes critical [13][14]. By combining these refined signals with your weighted scoring model, you can create alerts that align with your priorities. For example, if a customer’s churn risk hits a critical threshold, the system can automatically escalate the case, notify the Customer Success Manager via Slack, and launch a tailored email sequence.
Organizations that integrate churn scores into automated CRM workflows often see a 15–25% reduction in churn [14]. The secret? Context. When saving risk scores to your CRM (like Salesforce or HubSpot), always include the top three risk factors. This way, agents see more than just "83% churn risk" – they get actionable insights like "83% risk due to declining feature usage, unresolved escalations, and negative sentiment in the last three interactions" [14].
Supportbench’s AI automation simplifies this process by prioritizing cases, categorizing customers into risk tiers (Critical, High, Moderate, Low), and assigning playbooks for each tier. Its AI Agent-Copilot can even search historical cases and knowledge bases to suggest solutions, helping agents resolve issues faster and reduce the friction that leads to churn.
"The prediction model alone generates no value – the value comes from acting on predictions." – Digital Applied [14]
Set up dashboards to display real-time risk scores across your customer base. Use filters like revenue tier, contract renewal dates, and signal categories to focus on areas with the biggest financial impact. And remember: improving customer retention by just 5% can boost profits by 25–95%, while acquiring a new customer costs 5–25 times more than keeping an existing one [2].
Step 4: Test, Implement, and Refine Your Rubric
Making sure your churn-risk rubric works as intended is critical. Skipping this step could lead to wasted efforts on false positives or missing the customers who are actually at risk of leaving.
"The most accurate [Customer Health Scoring] systems don’t start with a list of ‘best practices’ or copy-pasted templates. They start by reverse-engineering outcomes" [11].
Validate Scores Against Historical Churn Data
Start by comparing past churned and retained customers over the last 6–12 months. Look for patterns in customer behavior leading up to churn. For example, create a table of churned accounts with their churn dates and cross-reference it with monthly data on metrics like ticket volume, sentiment analysis, and escalation rates. This helps identify the signals that precede churn [11] [15].
Use cohort analysis to confirm whether customers in higher-risk categories consistently show higher churn rates [15]. Metrics like ROC_AUC, precision, and recall are useful for evaluating your model’s performance [10] [15]. A good churn prediction model typically has an AUC score between 0.6 and 0.8 [15]. When testing with historical data, apply time series splitting to get a more accurate read on future predictions [15].
Track Performance and Adjust Regularly
Ongoing monitoring is a must. Around 67% of companies review their churn data monthly to evaluate the effectiveness of their retention strategies [16]. Create a feedback loop to measure the outcomes of your interventions. For instance, did a high-risk customer who received proactive customer support end up renewing? Are your "critical" accounts churning as expected? Use these insights to fine-tune your thresholds and adjust signal weights every quarter [11] [16].
Segment your customers by tenure and run A/B tests to see how different strategies work for at-risk groups [15] [10] [16]. The reasons for churn and the signals to watch for can vary greatly between new customers (under three months) and those who’ve been with you for over a year [16]. Keep in mind that the median churn rate for private SaaS companies in 2022 was 13% [10]. Use this as a benchmark, but also account for your specific business model and customer base.
Conclusion
Turning support data into a churn-risk rubric shifts your support operations from merely reacting to problems to actively preventing customer loss. Signals like support tickets, escalations, sentiment trends, and response times are already at your disposal – it’s about quantifying, prioritizing, and acting on them.
AI-driven models offer a significant edge, achieving 80–90% accuracy compared to manual rule-based methods, which typically hit 65–75%. Implementing these models can reduce churn by 15–30% and increase customer lifetime value by 25–40% [17]. As Frederick Reichheld from Bain & Company wisely put it:
"Acquiring a new customer can cost five to seven times more than retaining an existing one, while increasing customer retention rates by just 5% can increase profits by 25% to 95%" [18].
This highlights the critical need to act on AI insights swiftly. A model that drives timely interventions is far more valuable than a sophisticated one that sits idle [14].
To keep your efforts effective, regular updates are crucial. Retrain your models every quarter to address accuracy drift as customer behavior changes. Continuously assess which signals remain reliable predictors and phase out those that no longer add value. A/B testing your interventions ensures that adjustments produce measurable results and cost savings.
Validate your scoring model using historical churn data, and as your data grows, scale with AI to refine your approach. By leveraging support signals and refining your rubric over time, you can transform your customer support from reactive troubleshooting to a strategic retention powerhouse. The signals are there – use them wisely.
FAQs
How do I pick the best churn signals from our support tickets?
When it comes to identifying customers who might be unhappy or considering leaving, paying attention to specific patterns in their behavior and communication is crucial. Here are some key signals to watch for:
- Unresolved Tickets: A backlog of unresolved issues can signal frustration, especially if customers feel their concerns aren’t being addressed quickly enough.
- Frequent Escalations: If a customer repeatedly escalates their issues, it’s often a sign they’re dissatisfied with the initial support they’ve received.
- Negative Sentiment Trends: Look for patterns of negativity in customer interactions, such as complaints or critical feedback across multiple touchpoints.
- Recurring Problems: When the same issues keep coming up without resolution, it can erode trust and patience over time.
- Explicit Statements: Phrases like "I regret choosing this service", "I’m thinking of canceling", or "I’m looking at other options" are direct red flags.
Using AI tools can make spotting these signals much easier. By analyzing support data, you can uncover trends and sentiments that might otherwise go unnoticed. This allows your team to step in early, address customer concerns, and reduce the risk of churn effectively.
How do I set weights and thresholds without a data scientist?
When developing a churn-risk rubric, the first step is to pinpoint key support indicators. These might include unresolved tickets, escalation frequency, sentiment trends, and response times. Each of these signals plays a role in identifying potential churn, so it’s important to weigh them appropriately.
Start by assigning initial weights to each signal. You can base these weights on industry benchmarks or your own experience with customer behavior. Next, establish thresholds. This can be done by analyzing historical data or applying straightforward rules of thumb. For instance, you might set a threshold for unresolved tickets based on the average number that leads to churn in past cases.
The real magic happens in the fine-tuning. Treat this rubric as a living tool. Regularly review and adjust both weights and thresholds as you gather more results. The goal is to keep it flexible and effective – no data scientist required.
What’s the fastest way to automate churn-risk scoring with AI?
The fastest way to set up churn-risk scoring with AI is by leveraging support-related data points like unresolved tickets, frequent escalations, sentiment shifts, and response times. AI tools can process these signals in real time, generating dynamic health scores that predict churn as far as 90 days ahead. This gives support teams the chance to quickly address at-risk accounts, cutting down on manual work and enabling timely, targeted action.