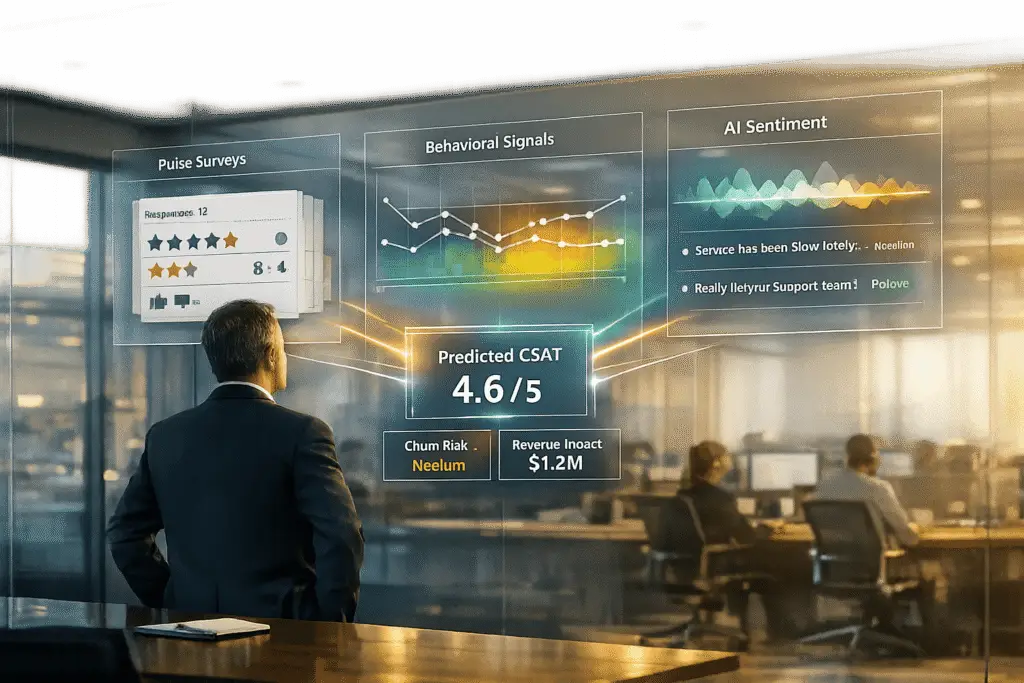
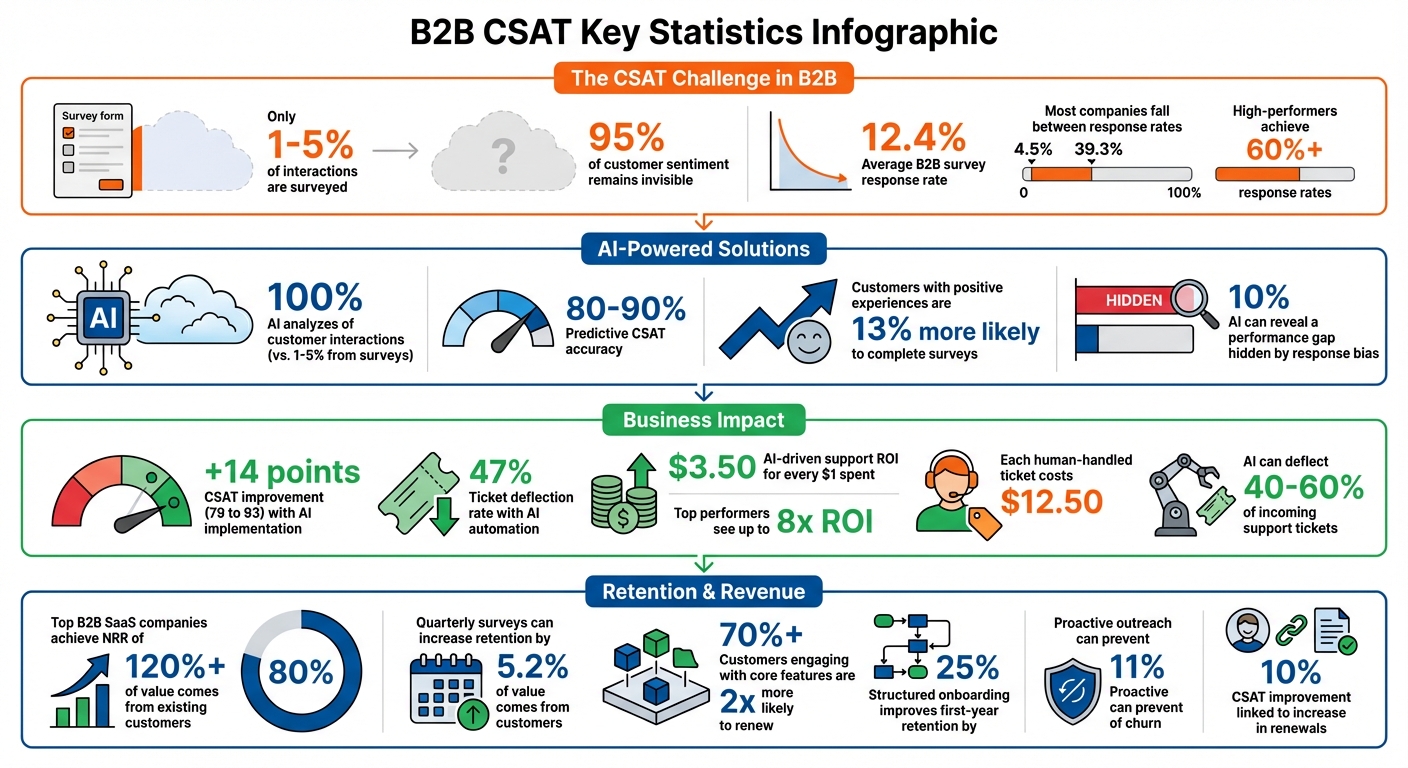
B2B CSAT scores often fail to reflect true customer satisfaction. Why? Only 1–5% of interactions are surveyed, leaving the majority of customer sentiment invisible. This creates blind spots that can lead to customer churn, especially in complex B2B relationships where multiple stakeholders and long sales cycles are involved.
To bridge this gap, you need to go beyond traditional surveys. Use these strategies to align CSAT with actual customer health:
- Simplify surveys: Shorten them to 2–6 questions and deliver them in-app for higher response rates.
- Combine feedback sources: Integrate data from tickets, emails, and chat to get a fuller picture.
- Leverage AI: Analyze 100% of interactions with AI-driven sentiment analysis to predict satisfaction.
- Track behaviors: Monitor usage patterns, support interactions, and renewal signals for early warnings.
- Link CSAT to outcomes: Tie scores to renewals, revenue, and cost metrics for actionable insights.
B2B CSAT Key Statistics: Response Rates, AI Accuracy, and Business Impact
Measuring Customer Satisfaction In A B2B Company
sbb-itb-e60d259
Step 1: Collect and Organize Limited CSAT Data
One of the toughest hurdles in B2B is simply getting customers to respond. The average response rate for B2B surveys is just 12.4%, with most companies falling between 4.5% and 39.3%[3]. High-performing organizations, however, often achieve response rates of 60% or more[3]. What sets them apart? It comes down to smart survey design and consolidating data effectively.
Design Targeted Surveys for High-Value Accounts
Keep it short and sweet – stick to 2 to 6 questions.[3] Response rates drop sharply once surveys exceed 15 questions[5]. Let respondents know up front how long the survey will take (ideally under two minutes) and explain how their input will be used[3].
Deliver surveys in-app, not via email. Entelo, a recruiting software company, made the switch from email-based surveys to in-app NPS surveys and saw their response rate jump from about 24% to 60%, eventually stabilizing near 50%[5]. In-app surveys catch customers while they’re already engaged, making it much more likely they’ll take the time to respond.
Timing is everything. For B2B relationships, quarterly surveys are ideal. Research shows this cadence can lead to a 5.2% increase in retention[3]. A single reminder can boost response rates by up to 50%, but overdoing follow-ups can backfire[3].
ICON Communication took things to the next level, achieving a 100% response rate by leveraging an Account Experience platform to manage their NPS program. This high engagement level helped drive 80% of their new business through customer referrals[3]. Ian Luck, VP of Marketing at CustomerGauge, sums it up perfectly:
"The number one way to improve your response rates is to show your customers that it’s worth their time to reply."[3]
Once you’ve optimized your surveys, it’s time to broaden your approach by integrating feedback from other sources.
Consolidate Feedback from Multiple Sources
Surveys are just one piece of the puzzle. To get a full picture of customer sentiment, you need to combine feedback from all touchpoints. In B2B, valuable insights are often buried in help desk tickets, email threads, call recordings, and even Slack conversations. Keeping this data siloed limits your ability to act on it effectively. Consolidating these sources is key to turning scattered, unstructured feedback into actionable insights[2].
Start by auditing every channel where customer interactions happen – help desk, live chat, email, and any other digital tools. Then, bring these data streams together on a unified platform. For example, Cynet used generative AI to integrate feedback and saw CSAT jump by 14 points (from 79 to 93), while also deflecting 47% of support tickets[2].
Pay attention to early signals. While CSAT scores are lagging indicators that come in after the fact, emotional cues from support tickets and calls can highlight potential churn risks before a survey is even completed[2]. Companies that monitor and act on these signals tend to see an average 25% boost in customer satisfaction[2].
Using a single system to manage feedback across channels – whether it’s chat, email, or support tickets – reduces the hassle of switching between tools and makes it easier to reconcile CSAT data with service-level agreements (SLAs)[6]. To streamline analysis, include structured fields like drop-down options in surveys instead of relying solely on open-text responses[6]. And when ticket volumes are low (a few hundred per week), consider analyzing CSAT scores quarterly instead of weekly to identify meaningful trends without getting distracted by random fluctuations[6].
Step 2: Use Customer Behavior as CSAT Indicators
When survey responses are limited, customer behavior becomes your go-to source for insights. CSAT surveys typically capture feedback from just 1–5% of customers, often reflecting only the most extreme experiences [1]. This leaves the vast majority – about 95% – unheard. The upside? AI models now analyze behavioral patterns to predict satisfaction levels with 80–90% accuracy [1][10].
For example, in May 2025, Intercom‘s support team adopted an AI-driven Customer Experience (CX) Score. Instead of relying on surveys that covered only 8% of interactions, the AI analyzed 100% of conversation transcripts. This shift revealed a 10% performance gap, where AI-predicted scores were lower than surveyed CSAT due to response bias. Customers with positive experiences were 13% more likely to fill out a survey [8]. As Director Franka put it:
"You can’t fix what you can’t see. CX shows us everything. And that’s exactly what we need to get better." [8]
Analyze Support Interaction Patterns
The first signs of dissatisfaction often show up in customer behavior during support interactions, not in survey results. For instance, a recontact within 3–7 days is a strong indicator of potential churn [9]. High recontact rates tied to specific issues, like billing or integrations, suggest that first-contact resolution may be falling short.
Key metrics to track include Time-to-First-Meaningful-Response (TTFMR), which measures the time it takes to deliver a response that prompts customer action [9]. Customers tend to value a slightly longer wait if it avoids being transferred repeatedly. Monitoring the number of transfers and "turns" in a conversation can reveal how much back-and-forth is causing frustration.
It’s also important to normalize response metrics by channel and evaluate entire interaction episodes, rather than focusing solely on individual touchpoints. This approach provides a clearer view of the customer journey [9]. Beyond support interactions, keeping an eye on renewal and product usage behavior can offer deeper insights into customer sentiment.
Track Renewal and Churn Signals
Behavioral data from support interactions can also help you predict renewal and churn. In B2B SaaS, time-to-first-value and key activation milestones within the first 1–6 weeks are strong indicators of long-term satisfaction and retention [12]. Pay attention to "moments of truth", such as the first invoice, initial support request, or a delayed delivery. Drops in satisfaction during these moments often signal potential churn [11].
Integrate these behavioral signals with your CRM to correlate them with metrics like Annual Recurring Revenue (ARR) and renewal forecasts [12]. Create a closed-loop process where signs of dissatisfaction – like cancellation intent or a high-effort interaction – trigger follow-ups within 24–48 hours [11][12]. Keep in mind that CSAT reflects how customers feel about their most recent interaction, but renewal trends provide a broader picture of the overall relationship.
Lastly, consider the full trajectory of a support experience. For example, a customer who starts an interaction feeling frustrated but ends it feeling relieved demonstrates a positive shift, which is often more meaningful than a consistently neutral experience [1].
Step 3: Apply AI for Sentiment Analysis and CSAT Prediction
Traditional surveys often only capture feedback from a small fraction – typically 1–5% – of your customer base. AI can close this gap by analyzing 100% of your support conversations [1]. Instead of relying solely on survey responses, AI dives into language patterns, emotional cues, sentiment changes, and behavioral signals across voice, chat, and email interactions [10]. This method ensures insights are gathered even from customers who don’t participate in surveys [15].
Predictive CSAT models are highly accurate, with validation rates of 80–90% when compared to actual survey results [10]. These models are trained on clean historical data with known satisfaction outcomes, allowing them to benchmark current conversations against past patterns [10]. For instance, the B2B cybersecurity company Cynet leveraged Mosaic AI’s generative tools to automate routine tasks and provide instant answers. This effort led to a 14-point increase in CSAT (from 79 to 93 points) and a 47% ticket deflection rate, with nearly half of all tickets resolved at Tier 1 without escalation [2].
This robust analysis lays the groundwork for detailed sentiment evaluation in customer support interactions.
Run Sentiment Analysis on Support Interactions
AI goes far beyond basic keyword detection – it interprets grammar, syntax, context, and subtle nuances in unstructured text. It evaluates emotion, tone, and intent to create a comprehensive picture of customer sentiment. This process works across all communication channels, as patterns like tone, word choice, and response speed reveal satisfaction trends in both written and spoken interactions.
To ensure accuracy, analyze every conversation channel – not just help desk tickets – to capture a full range of sentiment signals [2]. Before deploying predictive AI, make sure your CRM data is clean and conversations are properly tagged. This ensures the system learns effectively from historical interactions and improves its prediction accuracy over time [10]. Additionally, prioritize accurate transcription for voice interactions, as errors in converting speech to text can compromise the quality of AI predictions [1].
Once sentiment is extracted, predictive models transform these insights into actionable CSAT scores.
Generate Predictive CSAT Scores with AI
Predictive CSAT models use machine learning to infer customer satisfaction from all conversations, filling in gaps left by traditional surveys [1]. These models analyze signals like sentiment, emotion, intent, and agent behavior to deliver actionable insights [1]. For example, tracking sentiment shifts during a conversation can be particularly revealing – a customer who begins frustrated but ends relieved often represents a more meaningful positive experience than one with a neutral tone throughout [1].
To refine AI-predicted scores, compare them with post-contact surveys and manual quality checks [1]. This triangulation helps improve model accuracy while expanding your understanding of customer experiences. Keep an eye out for the "accuracy paradox", where a model might seem 85% accurate by consistently predicting "satisfied" but misses the critical 15% of dissatisfied customers. To address this, measure precision and recall specifically for dissatisfied interactions, as these cases often require immediate attention [1].
Finally, set up real-time alerts for negative signals like rising frustration or cancellation intent during live interactions. This allows supervisors to step in and resolve issues before the call or chat ends, ensuring a better outcome for both the customer and the business.
Step 4: Connect CSAT to Business Outcomes
CSAT scores become a true growth driver when they’re linked to revenue, retention, and cost metrics. For B2B companies where feedback is often limited, it’s essential to connect satisfaction data to key indicators like Net Revenue Retention (NRR), contract renewals, and cost-to-serve. By combining insights from behavioral analytics and AI-driven sentiment analysis, you can turn customer feedback into actionable strategies for growth.
Top-performing B2B SaaS companies boast an NRR of over 120% [16], with about 80% of their value coming from existing customers [18]. When CSAT feedback is sparse, consider using Customer Health Scoring. This metric blends satisfaction signals with real-time data like login frequency, feature usage, and support ticket activity [16]. Companies that implement formal health scoring often see an NRR boost of 6 to 12 points [16].
"Failing to connect feedback data with actionable sales metrics turns insights into isolated facts." – Julien Quintard, Founder & CEO, Routine [12]
Integrate CSAT data into your CRM system, tagging it by account and Annual Recurring Revenue (ARR) [12]. Break down feedback further by product feature, persona, or ticket type to identify what drives renewals or churn. For example, high NPS scores can automatically trigger invitations for case studies or participation in customer councils [12]. Align these findings with renewal metrics and cost measures to gain a full understanding of customer behavior.
Measure CSAT Impact on Renewals
To link CSAT to renewals, track satisfaction scores alongside contract milestones. Sending NPS surveys 90 days before a renewal allows you to assess the health of the relationship and uncover expansion opportunities [12]. Data shows that customers engaging with over 70% of core features are twice as likely to renew [17]. Additionally, use Customer Effort Score (CES) during onboarding or feature adoption as an early warning sign – high effort levels can signal potential churn, even when overall satisfaction seems positive [12][19].
Set up automated workflows to address low scores quickly. For instance, a detractor score should trigger a task for the account owner within two hours, prompting action like a value review meeting [12]. Companies that conduct regular Quarterly Business Reviews (QBRs) report 33% higher revenue from expansions [16]. Structured onboarding can also improve first-year retention by 25%, creating a strong foundation for satisfaction and upsell potential [16][17].
| Metric | Best Timing | Business Outcomes Linked |
|---|---|---|
| CSAT | Post-support ticket, post-onboarding | Support quality, feature readiness [12] |
| NPS | 90 days before renewal, post-EBR | Renewal risk, expansion opportunities [12] |
| CES | During onboarding, new feature adoption | Churn prediction, product engagement [12] |
Balance CSAT with Cost-to-Serve Metrics
While driving renewals is crucial, keeping costs in check is just as important. You can achieve both by using automation strategically. AI-powered self-service tools can deflect 40–60% of incoming support tickets, allowing human agents to focus on more complex, high-value tasks [7]. With each human-handled ticket costing an average of $12.50, deflecting 3,000 tickets a month could save around $37,500 [7]. On average, AI-driven support delivers $3.50 in ROI for every $1 spent, with top performers seeing returns as high as 8x [7].
Before rolling out efficiency tools, establish baseline metrics like CSAT, First Response Time (FRT), Average Handle Time (AHT), and Ticket Deflection Rate [7]. Segment CSAT by ticket type to pinpoint which issues cause the most frustration and which are quick to resolve [13]. Keep an eye on queue health metrics like wait times and SLA compliance to ensure operational speed doesn’t come at the expense of customer experience [14].
"The old playbook of hiring more reps and running more training to improve CSAT has hit a wall of diminishing returns. The new playbook is about systems, not just headcount." – Team Mosaic, Mosaic AI [7]
Use Retrieval-Augmented Generation (RAG) to ensure AI tools only pull information from verified knowledge bases, reducing the risk of errors [7]. Instead of reacting to individual score fluctuations, focus on rolling 4-week CSAT averages to identify long-term trends in customer health [12].
Step 5: Create Real-Time Dashboards for Continuous Monitoring
Your dashboard isn’t just a tool – it’s your frontline defense against churn. When CSAT responses are sparse, a well-designed dashboard acts as an early warning system, pinpointing potential issues before they escalate. Thanks to AI-native dashboards, the old days of relying on monthly reports are over. Now, you can monitor customer interactions in real time across all touchpoints, allowing you to act on insights immediately – long before renewals are at risk.
"Churn is rarely a surprise if you know where to look. But the problem is that conventional dashboards bury the warning signs in aggregate scores and monthly reports." – Stephen Christou, Marketing Director, SentiSum [20]
Unify multiple data streams into one view. A great dashboard combines direct CSAT feedback with AI-predicted satisfaction scores, sentiment analysis from support tickets, and behavioral signals like product usage, feature adoption, and user activity. This creates a continuous flow of data that links insights directly to action, ensuring you’re always a step ahead.
Include Key CSAT Metrics in Dashboards
To make your dashboard truly effective, focus on five core metric categories:
- Sentiment: Track CSAT, NPS, and AI-predicted satisfaction to gauge customer feelings.
- Efficiency: Monitor First Response Time (FRT), Average Resolution Time (ART), First Contact Resolution (FCR), and SLA compliance for team performance.
- Behavioral: Use product usage, feature adoption, and active user trends (DAU/MAU) as signals for renewal likelihood.
- Financial: Link support outcomes to business performance with metrics like Monthly Recurring Revenue (MRR), Customer Lifetime Value, and churn rate.
- Risk: Spot trouble early with health scores, ticket volume spikes, and escalation trends.
Predictive CSAT models now analyze every customer interaction – not just the small percentage captured by surveys [13]. This means every support ticket, chat, and email generates an inferred satisfaction score that feeds into your dashboard. Companies using predictive insights have seen CSAT scores jump by 14% in less than three weeks [13].
To take it further, set up real-time alerts (via Slack or email) to notify account managers when critical metrics hit concerning thresholds. For example, if a high-value account’s health score dips into the danger zone or an SLA breach occurs, your team can act immediately [20][21]. Make sure your dashboard also allows for drill-down views so managers can explore the "why" behind the numbers, such as specific ticket comments or chat logs [20].
| Metric Category | Key Metrics to Include | Purpose in B2B Support |
|---|---|---|
| Sentiment | CSAT, NPS, AI-Predicted Satisfaction | Tracks customer feelings about the brand and interactions |
| Efficiency | FRT, ART, FCR, SLA Compliance | Measures support team performance and responsiveness |
| Behavioral | Product Usage, Feature Adoption, DAU/MAU | Identifies renewal opportunities and at-risk accounts |
| Financial | MRR, Customer Lifetime Value, Churn Rate | Links support efforts to business outcomes |
| Risk | Health Score, Ticket Spikes, Escalation Trends | Flags accounts needing immediate attention to prevent churn |
By integrating these metrics, your dashboard becomes a powerful tool for quick, informed decision-making, directly supporting your efforts to retain customers and boost renewals.
Use Dashboards to Identify At-Risk Accounts
Dashboards should prioritize actionable insights. Configure them to automatically escalate low AI-predicted scores or urgent sentiment flags to the appropriate account manager, complete with context and recommended next steps [22]. This transforms your dashboard from a passive reporting tool into a dynamic command center for proactive intervention.
Tailor views by role to streamline decision-making. Executives need a high-level overview of company health and revenue impact. Account managers benefit from detailed account-level data, including ticket history and renewal risks. Support team leads require operational metrics like queue health and SLA compliance [22][23]. When each stakeholder sees only what’s relevant to their role, decisions are quicker, and accountability improves.
Establish a consistent review schedule to turn insights into action. Review negative feedback and new responses daily, and analyze trends monthly to connect CSAT data with renewal and churn metrics [4]. With 80% of consumers and business buyers saying customer experience is as important as the product itself [24], your dashboard should reflect this by giving customer health the same priority as revenue.
Finally, validate AI predictions regularly by comparing them to actual outcomes. This feedback loop refines your models over time, building trust in the system. Reaching out proactively when warning signs appear can prevent 11% of churn, and improving CSAT scores has been linked to a 10% increase in renewals and new client acquisitions [4].
Common Mistakes and How to Validate Your Data
Refining your CSAT analysis methods is critical, but even small errors can lead to big misunderstandings about customer satisfaction. Sparse CSAT responses, for example, increase the risk of missteps. A single misinterpreted data point could steer efforts in the wrong direction, hiding the real issues. Some of the biggest pitfalls include relying on aggregated averages, falling into survivorship bias, and trusting AI models that seem accurate but overlook the most critical customer segments.
Avoid Drawing Conclusions from Small Sample Sizes
The averaging trap is one of the most common errors. Imagine your overall CSAT score jumps from 78% to 84%. That sounds like a win, right? But when you dig deeper, you might discover that lower-spending, less satisfied customers have left the dataset entirely. What’s left are high-satisfaction "VIPs", inflating the average. This doesn’t mean problems were solved – it just means dissatisfied customers left.
"An average that isn’t segmented is a story with missing chapters." – Mallory Antomarchi, Data Analyst [26]
Survivorship bias adds another layer of distortion. Often, dashboards only show data for customers who completed onboarding or stuck around long enough to receive a survey. The ones who abandoned the process? They’re invisible. Even those who skip surveys are often meaningfully different from those who respond, leading to a skewed view of your customer base [1].
To avoid these traps, always segment your data before celebrating. Break down scores by factors like customer tier, geography, or acquisition channel. Ask yourself, “Who’s missing from this data?” Make an effort to gather insights from churned customers or those who abandoned onboarding. Using both month-over-month and year-over-year comparisons can also help you spot false growth narratives that hide long-term issues [26].
Take the example of Bedrock, a real estate firm that tackled inconsistent data definitions and duplicate reporting by adopting OvalEdge’s Business Glossary and Data Quality tools in November 2025. They standardized terms like "property" across departments and used Auto Data Lineage to trace errors back to their source. This step helped avoid the "garbage in, garbage out" problem, which plagues 82% of organizations that spend at least one day a week fixing master data issues [28].
Verify AI-Generated Predictions
Accurate segmentation sets the stage for validating AI predictions in CSAT modeling. While AI-generated CSAT predictions can achieve 80–90% accuracy when calibrated correctly [1], relying on accuracy alone can be misleading. For instance, if 85% of your customers are genuinely satisfied, a model that predicts "satisfied" for every interaction would still hit 85% accuracy – but it would completely miss the 15% of dissatisfied customers who are at risk of churning.
"Accuracy alone can mislead teams because contact center datasets often skew toward satisfied customers. A model that simply predicts ‘satisfied’ for every interaction could show 85% accuracy… but it would completely miss the 15% who aren’t." – Cresta [1]
To ensure reliability, triangulate AI predictions with post-contact survey results and QM assessments. Focus on identifying dissatisfied customers by prioritizing precision and recall over overall accuracy. Before deploying AI scores, run parallel tests by comparing predictions to manual quality management (QM) scores and survey results. This calibration ensures the model’s thresholds are aligned with reality.
For example, Snap Finance implemented AI-driven quality management, achieving 100% QA automation. This led to a 23% boost in CSAT and a 40% reduction in average handle time [1]. Similarly, CVS Health moved from scoring just 5% of calls using traditional methods to 100% call scoring with AI-powered analytics, closing critical visibility gaps [1]. These cases show how validating AI predictions can enhance customer support operations while improving efficiency.
Regular recalibration is non-negotiable. As customer expectations, product offerings, and team dynamics change, your models must evolve too. Check whether behaviors flagged by AI correlate with key business outcomes like renewals or reduced churn. Since AI models often inherit errors from raw text, auditing transcription quality across all channels – voice, chat, and email – is essential before fully trusting sentiment analysis [1].
Poor data preparation wastes 44% of analysts’ time each week [27], and 86% of financial services leaders admit they lack confidence in using their data due to delays and formatting issues [25]. The biggest mistakes often come not from bad data but from presenting good data without proper context [26]. Always prioritize thorough analysis over rushing to conclusions. Accuracy and context are your best tools for making informed decisions.
Conclusion
Improving CSAT in the B2B world requires more than just occasional survey responses. Companies that excel in this area integrate structured data, AI-powered insights, and behavioral signals to create a full picture of customer health. With tools like data consolidation and behavioral analysis, AI is reshaping how we think about CSAT.
The transition from using lagging indicators to adopting predictive tools is already in motion. AI is turning CSAT into a forward-looking metric by analyzing all customer interactions – emails, chats, and support tickets – rather than relying solely on surveys [7]. For instance, by 2025, generative AI implementations boosted CSAT scores by 14 points and reduced support ticket volumes by 47%, proving that even with limited traditional feedback, intelligent systems can deliver clear, measurable improvements [7]. Similarly, Rapid7 achieved a 95% CSAT score despite increasing ticket volumes, thanks to unifying fragmented knowledge across their systems [7].
"The future of customer experience won’t be defined by the companies that have the most support agents. It will be defined by the companies that have the most intelligent, efficient, and scalable systems." – Team Mosaic [7]
The days of simply adding more support agents to meet demand are fading. Instead, the focus has shifted to building scalable, intelligent systems. Sentiment analysis, for example, helps companies detect early warning signs and avoid inconsistent service quality caused by the "agent lottery" – where the customer experience depends too heavily on the individual representative [7]. Businesses that adopt sentiment analysis report, on average, a 25% increase in satisfaction, with top performers seeing up to an 8x return on investment for every dollar spent on AI-based customer experience tools [7].
To make CSAT a true driver of growth, businesses must consolidate data sources, monitor leading indicators, and ensure AI predictions align with actual outcomes. Tying CSAT to metrics like Net Revenue Retention and cost-to-serve transforms it from a simple feedback measure into a key strategic asset.
FAQs
How can I trust CSAT when only a few customers respond?
In B2B scenarios where CSAT responses are limited, it’s essential to approach the scores with care. To gain a clearer picture, combine these scores with qualitative data, such as open-ended feedback and psychographic insights, which can reveal the underlying reasons behind customer sentiments.
Additionally, rely on multiple touchpoints and monitor other metrics like Net Promoter Score (NPS) or Customer Effort Score (CES) to create a more comprehensive understanding of customer satisfaction. Think of CSAT as just one piece of the puzzle, working alongside other tools to better reflect the full customer experience.
What behaviors best predict churn when CSAT is sparse?
When CSAT scores are limited, there are still clear behaviors that can signal potential churn. These include reduced engagement, missed milestones, unresolved support tickets, and noticeable drops in usage patterns.
Specific red flags might look like this:
- No login activity for over 30 days
- Overdue tasks piling up
- Conversations going stale
- Backlogs of unresolved tickets
On top of these, sentiment analysis can reveal subtler signs, such as shifts in tone or passive-aggressive language in communication. Spotting these early gives teams a chance to step in and address dissatisfaction before it turns into customer churn.
How do I validate AI-predicted CSAT before acting on it?
To ensure the accuracy of AI-predicted CSAT (Customer Satisfaction), it’s important to compare the predictions with actual survey results and quality assessments. This helps confirm whether the model is aligning with real customer feedback. Regular calibration of the AI model against this feedback is essential, along with ongoing performance monitoring to track its reliability over time.
Additionally, creating workflows that connect predictions to real-time actions can help bridge the gap between forecasts and actual customer experiences. Continuously refining the model based on updated feedback ensures it stays relevant and accurate. Frequent validation is crucial for making decisions that truly reflect customer satisfaction.